Home > Comparison > Technology > INTC vs KLAC
The strategic rivalry between Intel Corporation and KLA Corporation shapes the semiconductor industry’s future. Intel stands as a capital-intensive semiconductor manufacturer, delivering diverse computing products. KLA operates as a specialized high-margin process control and yield management provider within the same sector. This head-to-head pits broadscale manufacturing against precision technology leadership. This analysis seeks to identify which business model offers the superior risk-adjusted return for a diversified portfolio in today’s dynamic technology landscape.
Table of contents
Companies Overview
Two giants shape the semiconductor landscape with distinct roles and strategies in 2026.
Intel Corporation: Semiconductor Titan and Platform Innovator
Intel dominates as a leading semiconductor manufacturer with a $232B market cap. It generates revenue by designing and selling CPUs, chipsets, accelerators, and high-performance compute solutions for diverse industries. In 2026, Intel emphasizes AI-driven computing and autonomous driving platforms, leveraging partnerships to expand its technological moat in emerging markets.
KLA Corporation: Precision Yield Management Leader
KLA stands out with a $188B market cap as a specialist in semiconductor process control and yield management. Its revenue stems from wafer inspection, defect analysis, and manufacturing diagnostics critical to chip production quality. The company’s 2026 focus targets advanced metrology and process-enabling technologies, enhancing semiconductor fabrication efficiency amid rising industry complexity.
Strategic Collision: Similarities & Divergences
Intel pursues a broad platform approach, integrating compute and AI solutions, while KLA operates a niche focused on precision process control and yield optimization. Both compete indirectly by enabling semiconductor innovation but target different stages of the value chain. Intel’s scale and diversification contrast with KLA’s specialized technological edge, defining their unique risk and growth profiles for investors.
Income Statement Comparison
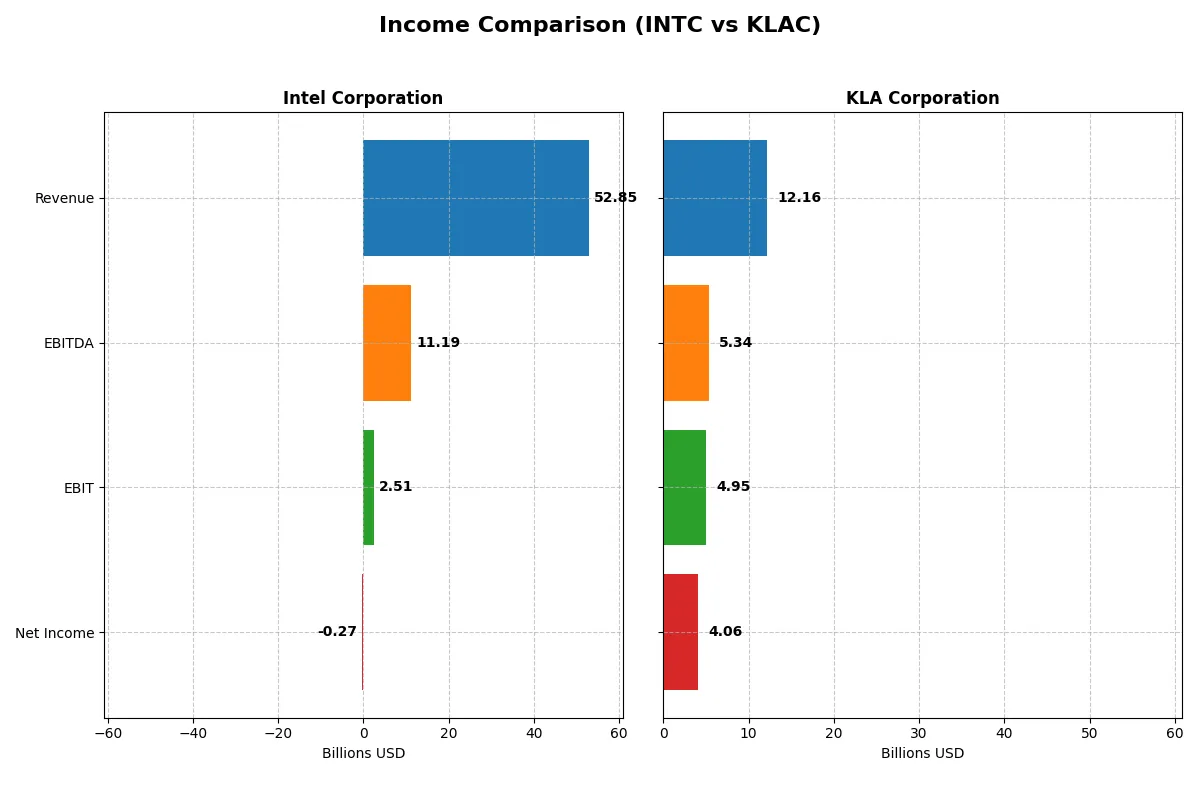
This data dissects the core profitability and scalability of both corporate engines to reveal who dominates the bottom line:
| Metric | Intel Corporation (INTC) | KLA Corporation (KLAC) |
|---|---|---|
| Revenue | 52.85B | 12.16B |
| Cost of Revenue | 34.38B | 4.58B |
| Operating Expenses | 20.60B | 2.33B |
| Gross Profit | 18.48B | 7.58B |
| EBITDA | 11.19B | 5.34B |
| EBIT | 2.51B | 4.95B |
| Interest Expense | 953M | 302M |
| Net Income | -267M | 4.06B |
| EPS | -0.08 | 30.53 |
| Fiscal Year | 2025 | 2025 |
Income Statement Analysis: The Bottom-Line Duel
This income statement comparison reveals how efficiently each company converts revenue into profits and sustains its core business momentum.
Intel Corporation Analysis
Intel’s revenue declined by 0.47% in 2025 to $52.9B, continuing a downward trend since 2021. Gross margin improved to 35%, signaling better cost control, but net margin turned negative at -0.5%, reflecting a net loss of $267M. The sharp EBIT rebound (+125%) shows operational recovery, yet persistent net losses raise efficiency concerns.
KLA Corporation Analysis
KLA posted robust revenue growth of 23.9% in 2025, reaching $12.2B, driven by expanding demand. Its gross margin soared to 62%, and net margin at 33.4% indicates exceptional profitability. EBIT grew 41%, underscoring strong operating leverage. KLA’s consistent margin expansion and earnings momentum highlight its operational strength.
Margin Power vs. Revenue Scale
KLA outperforms Intel with superior margin profiles and strong revenue growth, delivering $4.1B net income on $12.2B revenue versus Intel’s $267M net loss on $52.9B. KLA’s operational efficiency and expanding profits mark it as the clear fundamental winner. Investors seeking growth and profitability will find KLA’s profile more compelling.
Financial Ratios Comparison
These vital ratios act as a diagnostic tool to expose the underlying fiscal health, valuation premiums, and capital efficiency of the companies compared below:
| Ratios | Intel Corporation (INTC) | KLA Corporation (KLAC) |
|---|---|---|
| ROE | -0.23% | 86.56% |
| ROIC | -0.02% | 37.97% |
| P/E | -658.38 | 29.34 |
| P/B | 1.54 | 25.39 |
| Current Ratio | 2.02 | 2.62 |
| Quick Ratio | 1.65 | 1.83 |
| D/E (Debt-to-Equity) | 0.41 | 1.30 |
| Debt-to-Assets | 22.03% | 37.89% |
| Interest Coverage | -2.23 | 17.34 |
| Asset Turnover | 0.25 | 0.76 |
| Fixed Asset Turnover | 0.50 | 9.70 |
| Payout Ratio | 0 | 22.27% |
| Dividend Yield | 0% | 0.76% |
| Fiscal Year | 2025 | 2025 |
Efficiency & Valuation Duel: The Vital Signs
Ratios serve as a company’s financial DNA, exposing hidden risks and operational strengths investors must grasp.
Intel Corporation
Intel’s profitability metrics reveal weakness, with negative ROE and net margin signaling operational challenges. Its P/E ratio is unusually negative, reflecting earnings instability. The valuation appears stretched despite a solid current ratio of 2.02. Intel pays no dividends, instead allocating over 26% of revenue to R&D, aiming to fuel future growth amid current profitability struggles.
KLA Corporation
KLA demonstrates robust profitability, boasting a 87% ROE and a strong 33% net margin. Valuation multiples are high, with a P/E near 29 and a price-to-book ratio exceeding 25, suggesting an expensive stock. The company maintains a healthy current ratio above 2.6 and offers a modest 0.76% dividend yield, balancing shareholder returns with ongoing investments in R&D.
Valuation Stretch vs. Operational Strength
KLA offers superior profitability and operational efficiency but trades at rich multiples, increasing valuation risk. Intel’s weaker margins and returns contrast with a more conservative balance sheet and a strong R&D focus. Investors seeking growth through innovation may prefer Intel’s reinvestment profile, while those valuing current profitability face a premium with KLA.
Which one offers the Superior Shareholder Reward?
Intel Corporation (INTC) pays no dividend and struggles with negative free cash flow (-$1B in 2025), limiting buybacks. KLA Corporation (KLAC) yields 0.76% with a 22% payout ratio and robust buybacks fueled by $28B free cash flow. KLAC’s disciplined capital allocation and consistent cash generation support sustainable returns. INTC’s reinvestment focus amid margin pressures weighs on shareholder rewards. I conclude KLA offers a more attractive total return profile in 2026 due to its stronger cash flow, disciplined buybacks, and modest but sustainable dividends.
Comparative Score Analysis: The Strategic Profile
The radar chart reveals the fundamental DNA and trade-offs of Intel Corporation and KLA Corporation, highlighting their strategic strengths and vulnerabilities:
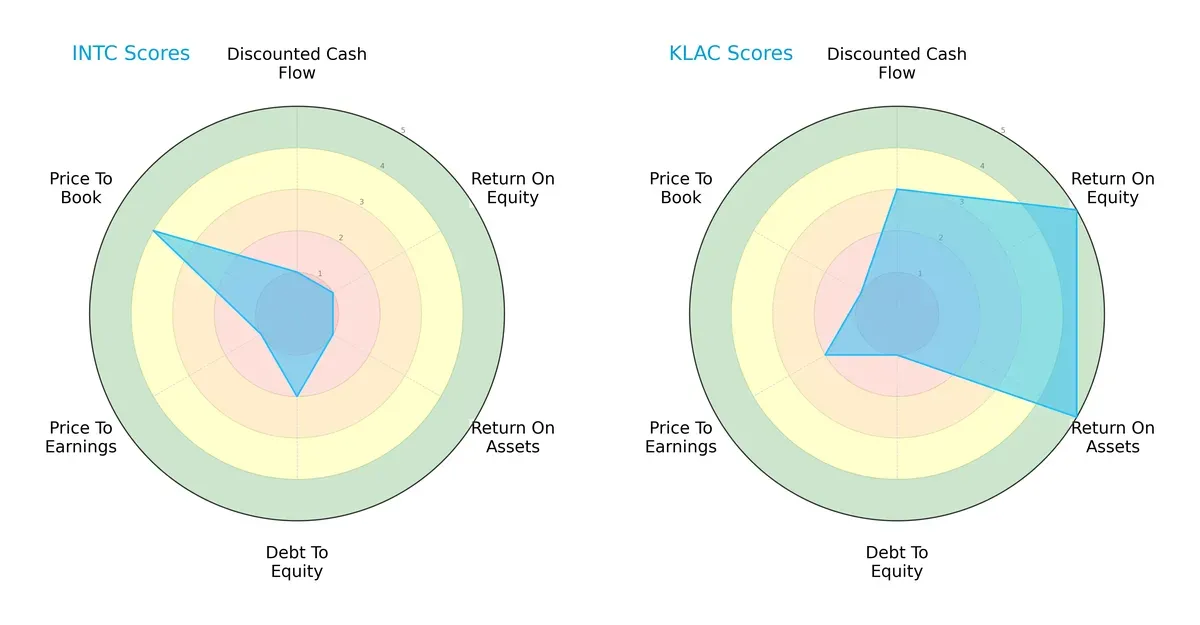
KLA dominates in profitability with top scores in ROE (5) and ROA (5), showcasing efficient asset use and equity returns. Intel lags with consistently low profitability scores (all 1s) but holds a relative edge in Price-to-Book valuation (4 vs. 1). Intel shows moderate Debt-to-Equity discipline (2) versus KLA’s more leveraged stance (1). KLA’s profile is less balanced, relying heavily on operational efficiency, while Intel’s scattered scores reflect struggles across cash flow and valuation metrics.
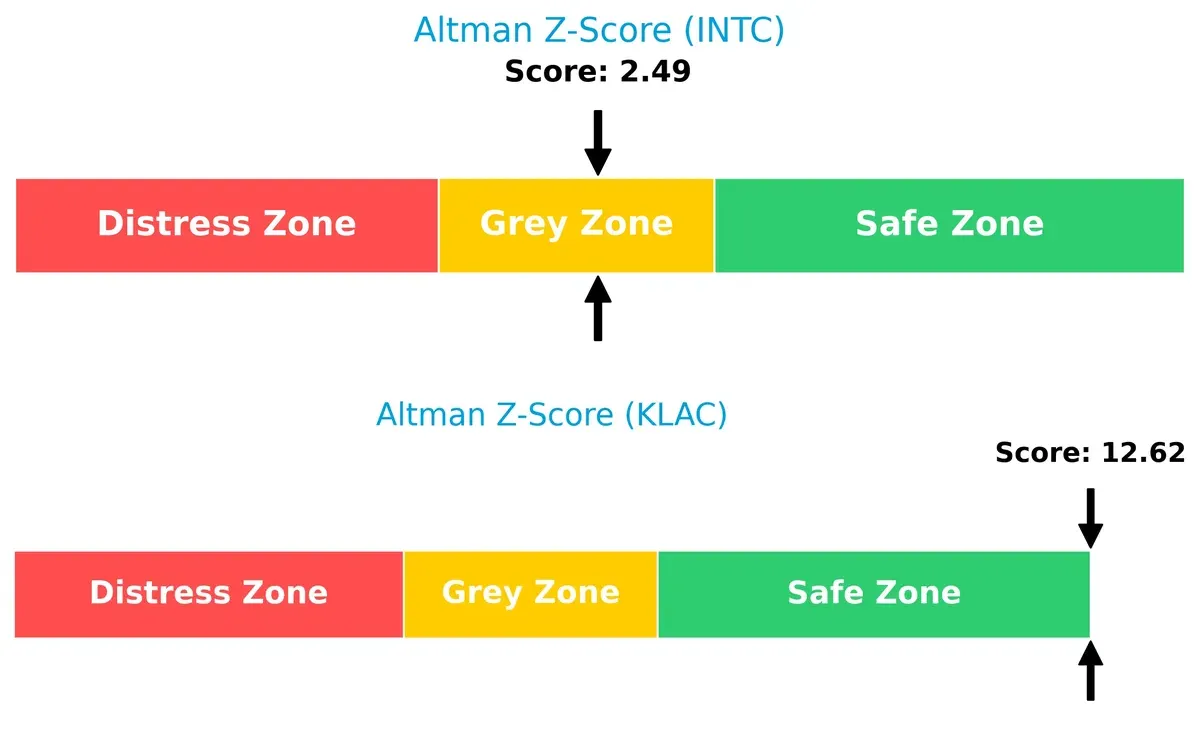
Bankruptcy Risk: Solvency Showdown
KLA’s Altman Z-Score of 12.62 places it firmly in the safe zone, signaling robust solvency and low bankruptcy risk. Intel’s score of 2.49 falls in the grey zone, indicating moderate risk and financial vulnerability in the current cycle:
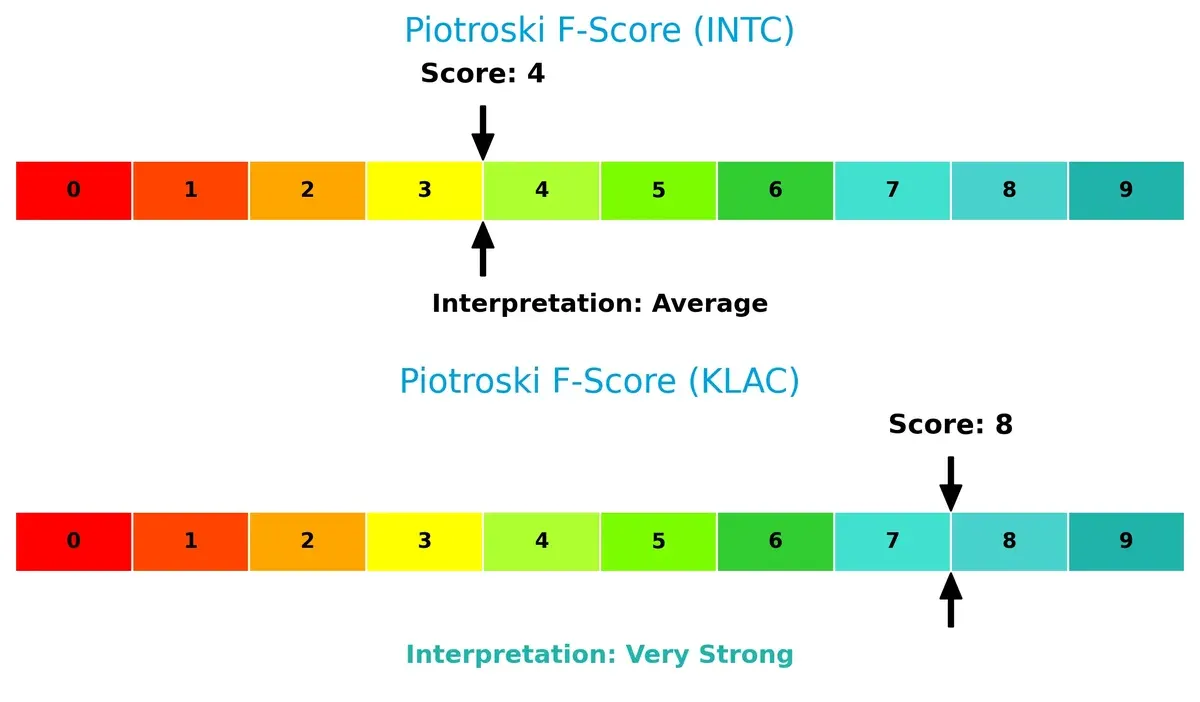
Financial Health: Quality of Operations
KLA scores an impressive 8 on the Piotroski F-Score, reflecting strong internal financial health and operational quality. Intel’s middling score of 4 signals average health, with potential red flags in profitability or liquidity metrics that warrant caution:
How are the two companies positioned?
This section dissects Intel and KLA’s operational DNA by comparing revenue distribution and internal dynamics. The goal is to confront their economic moats and identify the more resilient, sustainable competitive advantage.
Revenue Segmentation: The Strategic Mix
The following visual comparison dissects how Intel Corporation and KLA Corporation diversify their income streams and where their primary sector bets lie:
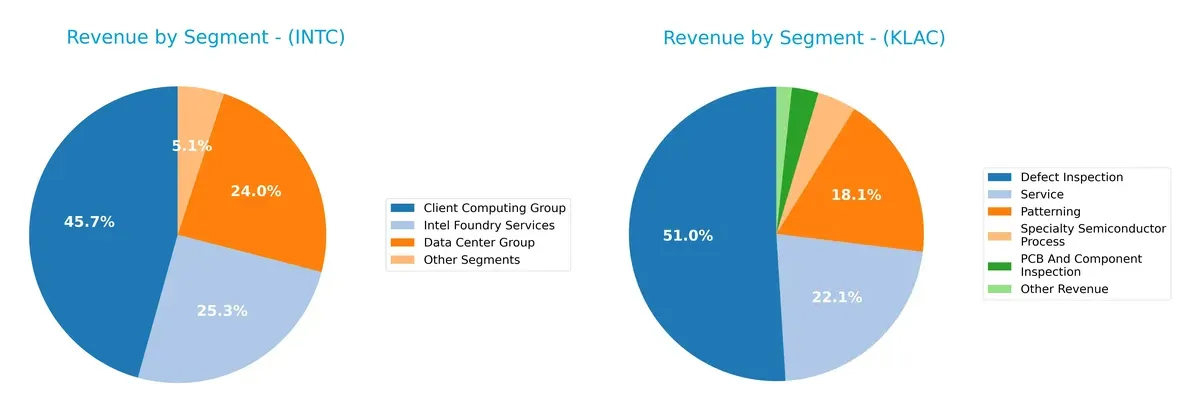
Intel’s revenue pivots on Client Computing Group at $32.2B, anchored by Data Center Group ($16.9B) and Intel Foundry Services ($17.8B). This mix shows moderate diversification with strong bets on core computing and foundry services. KLA’s revenue, however, dwarfs in Defect Inspection at $6.2B, supported by Service ($2.7B) and Patterning ($2.2B). KLA’s concentration in defect inspection signals infrastructure dominance but also a concentration risk compared to Intel’s broader ecosystem.
Strengths and Weaknesses Comparison
This table compares the Strengths and Weaknesses of Intel Corporation and KLA Corporation:
Intel Corporation Strengths
- Diversified revenue streams across computing, data center, foundry, and IoT segments
- Favorable liquidity ratios with current ratio 2.02 and quick ratio 1.65
- Moderate leverage with debt-to-assets at 22.03%
- Strong global presence including significant US and Asia sales
KLA Corporation Strengths
- High profitability with net margin 33.41%, ROE 86.56%, and ROIC 37.97%
- Favorable liquidity and coverage ratios with current ratio 2.62 and interest coverage 16.37
- Efficient asset use with fixed asset turnover 9.7
- Balanced geographic exposure including China, Taiwan, and North America
Intel Corporation Weaknesses
- Negative profitability metrics: net margin -0.51%, ROE -0.23%, ROIC -0.02%
- Unfavorable asset turnover metrics indicating inefficiency
- No dividend yield in 2025
- Slightly unfavorable global ratio opinion
KLA Corporation Weaknesses
- High debt-to-equity ratio 1.3 indicating leverage risk
- Unfavorable valuation multiples: PE 29.34 and PB 25.39
- Dividend yield low at 0.76%
- Slightly unfavorable weighted average cost of capital at 10.42%
Intel shows strength in liquidity and diversification but suffers from weak profitability and operational inefficiencies. KLA excels in profitability and asset efficiency but carries higher leverage and valuation risks. These contrasts highlight different strategic and financial profiles within the semiconductor sector.
The Moat Duel: Analyzing Competitive Defensibility
A structural moat is the only reliable shield protecting long-term profits from relentless competitive erosion. Let’s dissect the moats of two semiconductor giants:
Intel Corporation: Scale and Legacy-Driven Cost Advantage
Intel’s moat stems primarily from its vast manufacturing scale and established supply chain. This advantage yields a respectable gross margin of 35%, but declining ROIC signals weakening profitability. In 2026, new product launches and AI applications could stabilize its cost edge, yet competitive pressure threatens margin sustainability.
KLA Corporation: Precision and Innovation-Backed Technological Moat
KLA’s moat hinges on advanced process control technology, differentiating it from Intel’s scale focus. It commands a stellar 62% gross margin and boasts accelerating ROIC, indicating robust value creation. Expansion into specialty semiconductor markets and AI-driven metrology solutions should deepen its moat further in 2026.
Verdict: Cost Leadership vs. Technological Dominance
KLA exhibits a wider and deeper moat with growing ROIC and superior margins, proving its competitive advantage is durable and innovation-led. Intel’s declining ROIC and value destruction reveal its cost advantage is under siege. KLA stands better equipped to defend and expand market share in this evolving semiconductor landscape.
Which stock offers better returns?
The past year reveals sharply contrasting gains: Intel Corporation shows steady price acceleration, while KLA Corporation delivers a dramatic surge amid heightened volatility.
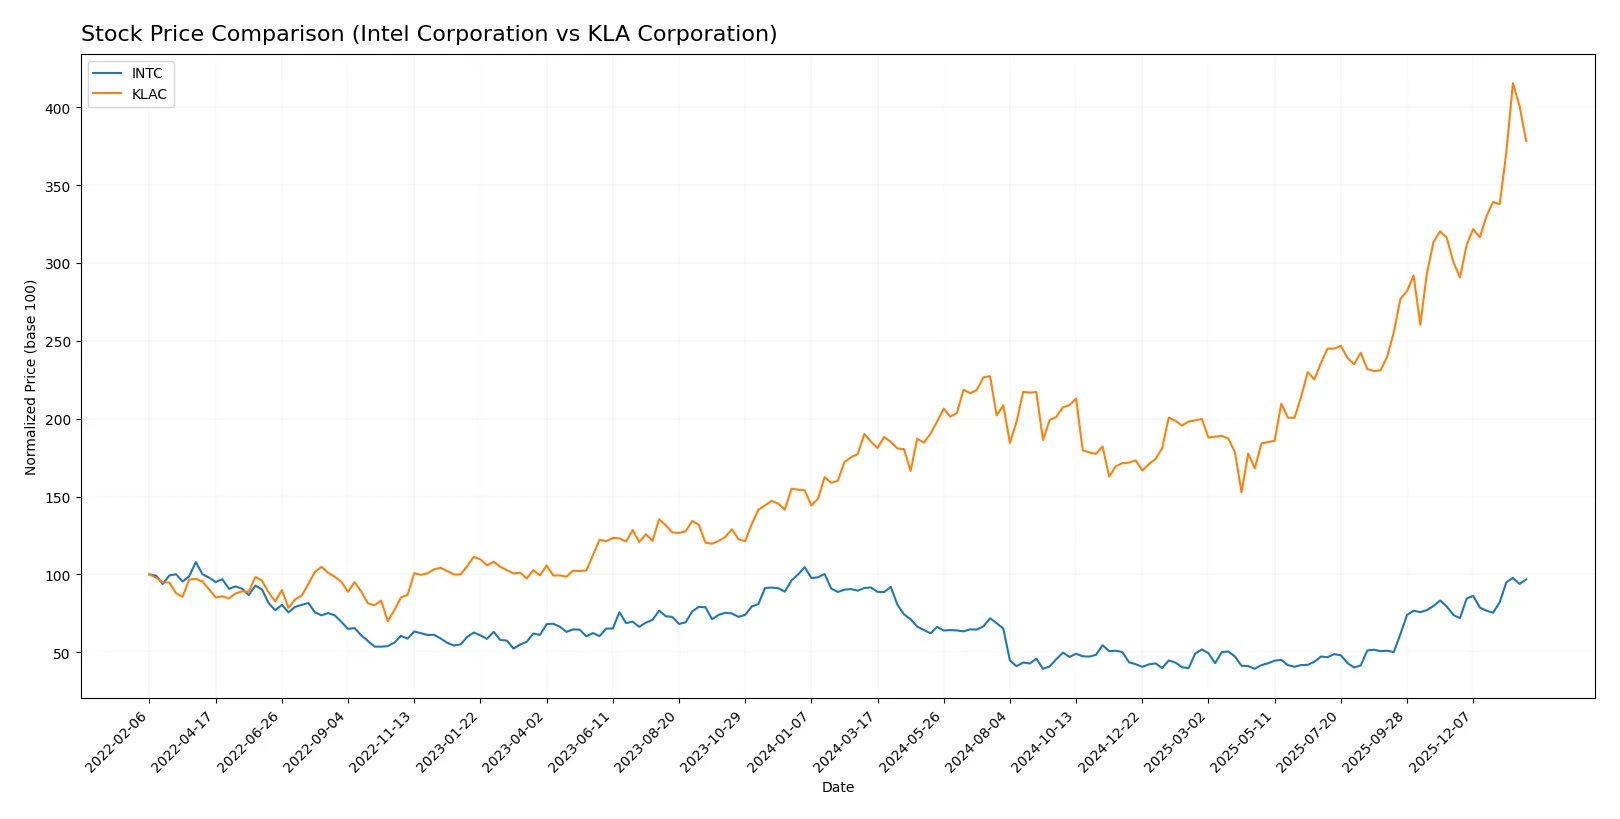
Trend Comparison
Intel Corporation’s stock rose 5.61% over the past 12 months, indicating a bullish trend with accelerating momentum and moderate volatility (8.11 std deviation). Its price ranged from 18.89 to 46.96.
KLA Corporation’s stock surged 104.22% over the same period, also bullish with accelerating momentum but much higher volatility (213.25 std deviation). The price spiked from 576.53 to 1567.82.
KLA Corporation outperformed Intel significantly in market returns, delivering over 100% gains compared to Intel’s modest 5.6% increase.
Target Prices
Analysts present a broad but optimistic target price range for Intel and KLA Corporation.
| Company | Target Low | Target High | Consensus |
|---|---|---|---|
| Intel Corporation | 20 | 66 | 46.95 |
| KLA Corporation | 1400 | 1900 | 1672.25 |
Intel’s target consensus aligns closely with its current price, suggesting limited upside. KLA’s target consensus sits significantly above the current price, indicating stronger growth expectations.

Don’t Let Luck Decide Your Entry Point
Optimize your entry points with our advanced ProRealTime indicators. You’ll get efficient buy signals with precise price targets for maximum performance. Start outperforming now!
How do institutions grade them?
Intel Corporation Grades
The table below summarizes recent grades assigned by reputable institutions to Intel Corporation:
| Grading Company | Action | New Grade | Date |
|---|---|---|---|
| RBC Capital | Maintain | Sector Perform | 2026-01-23 |
| Keybanc | Maintain | Overweight | 2026-01-23 |
| Evercore ISI Group | Maintain | In Line | 2026-01-23 |
| Needham | Maintain | Hold | 2026-01-23 |
| Benchmark | Maintain | Buy | 2026-01-23 |
| Rosenblatt | Maintain | Sell | 2026-01-23 |
| UBS | Maintain | Neutral | 2026-01-23 |
| Citigroup | Maintain | Neutral | 2026-01-23 |
| Stifel | Maintain | Hold | 2026-01-23 |
| Wedbush | Maintain | Neutral | 2026-01-23 |
KLA Corporation Grades
Below is a summary of recent grades assigned by credible institutions to KLA Corporation:
| Grading Company | Action | New Grade | Date |
|---|---|---|---|
| Oppenheimer | Maintain | Outperform | 2026-01-30 |
| Barclays | Maintain | Overweight | 2026-01-30 |
| Cantor Fitzgerald | Maintain | Overweight | 2026-01-30 |
| Jefferies | Maintain | Buy | 2026-01-30 |
| Stifel | Maintain | Buy | 2026-01-30 |
| Wells Fargo | Maintain | Overweight | 2026-01-30 |
| Needham | Maintain | Buy | 2026-01-30 |
| RBC Capital | Maintain | Sector Perform | 2026-01-30 |
| Deutsche Bank | Maintain | Hold | 2026-01-21 |
| Needham | Maintain | Buy | 2026-01-20 |
Which company has the best grades?
KLA Corporation consistently receives stronger grades such as Outperform and multiple Buy ratings. Intel’s grades cluster around Hold and Neutral. This difference may influence investor sentiment and risk appetite.
Risks specific to each company
The following categories identify the critical pressure points and systemic threats facing both firms in the 2026 market environment:
1. Market & Competition
Intel Corporation
- Faces intense competition from AMD and TSMC, pressuring margins and market share.
KLA Corporation
- Leads in semiconductor process control with strong technological moats, but faces cyclical demand fluctuations.
2. Capital Structure & Debt
Intel Corporation
- Maintains moderate leverage with a debt-to-equity ratio of 0.41, indicating controlled financial risk.
KLA Corporation
- Higher debt-to-equity ratio at 1.3 raises financial vulnerability despite strong earnings.
3. Stock Volatility
Intel Corporation
- Beta of 1.35 implies above-market volatility, reflecting sensitivity to sector cycles.
KLA Corporation
- Beta of 1.44 indicates higher volatility, amplifying risk in turbulent markets.
4. Regulatory & Legal
Intel Corporation
- Subject to US antitrust scrutiny and export controls impacting China sales.
KLA Corporation
- Faces regulatory risks related to export controls but less exposed to direct antitrust issues.
5. Supply Chain & Operations
Intel Corporation
- Large-scale manufacturing exposes Intel to semiconductor supply chain disruptions.
KLA Corporation
- Supply chain risks mitigated by niche focus on inspection tools, but still sensitive to chip industry downturns.
6. ESG & Climate Transition
Intel Corporation
- Invests heavily in sustainable manufacturing, but energy intensity remains a concern.
KLA Corporation
- ESG policies mature with strong governance, yet faces pressure to reduce carbon footprint in manufacturing support.
7. Geopolitical Exposure
Intel Corporation
- Significant global footprint exposes Intel to US-China tensions and trade restrictions.
KLA Corporation
- Also exposed to geopolitical tensions, but with a narrower product scope limiting risk magnitude.
Which company shows a better risk-adjusted profile?
Intel’s biggest risk is operational and competitive pressure, reflected in weak profitability and average financial health scores. KLA faces higher financial leverage risk but boasts strong profitability, superior Altman Z-Score, and robust Piotroski scores. KLA’s niche leadership and healthier cash flow profile give it a better risk-adjusted stance despite higher debt. Recent steep stock volatility at KLA (-15% drop) signals market sensitivity but also opportunity, whereas Intel’s negative margins remain a red flag. I see KLA as the safer choice for risk-conscious investors in 2026.
Final Verdict: Which stock to choose?
Intel Corporation’s superpower lies in its resilient operational liquidity and ongoing R&D commitment, positioning it as a turnaround story. However, its declining profitability and value destruction signal a point of vigilance. It suits portfolios aiming for aggressive growth with a high tolerance for operational risks.
KLA Corporation commands a durable moat with its exceptional capital efficiency and strong profitability metrics. Its robust income growth and financial stability offer a safer profile compared to Intel. This stock fits well in GARP (Growth at a Reasonable Price) portfolios seeking sustainable expansion with disciplined capital use.
If you prioritize turnaround potential and are comfortable with volatility, Intel might appeal due to its foundational R&D investments despite current headwinds. However, if you seek consistent value creation and superior profitability, KLA outshines with a durable competitive advantage and stronger financial health, albeit at a premium valuation.
Disclaimer: Investment carries a risk of loss of initial capital. The past performance is not a reliable indicator of future results. Be sure to understand risks before making an investment decision.
Go Further
I encourage you to read the complete analyses of Intel Corporation and KLA Corporation to enhance your investment decisions: