Home > Comparison > Technology > INTC vs INDI
The strategic rivalry between Intel Corporation and indie Semiconductor defines the current trajectory of the semiconductor industry. Intel operates as a capital-intensive giant with diversified chip manufacturing and computing platforms. Indie Semiconductor focuses on niche automotive chips and software, targeting advanced driver assistance and connectivity. This analysis contrasts their growth models to identify which offers a superior risk-adjusted return for a diversified technology portfolio.
Table of contents
Companies Overview
Intel Corporation and indie Semiconductor, Inc. stand out as innovators in the semiconductor industry with markedly different scales and market approaches.
Intel Corporation: Semiconductor Giant with Diverse Platforms
Intel dominates the semiconductor market with a broad product portfolio spanning CPUs, chipsets, and accelerators. Its revenue engine hinges on platform products and tailored solutions for cloud, enterprise, and embedded applications. In 2026, Intel sharpens its strategic focus on high-performance compute and AI-driven autonomous driving technologies, leveraging partnerships to enhance innovation.
indie Semiconductor, Inc.: Niche Automotive Semiconductor Specialist
indie Semiconductor carves a niche in automotive semiconductors and software for advanced driver assistance and connected car applications. The company generates revenue through specialized devices like ultrasound sensors and photonic components. Its 2026 strategy centers on expanding offerings for electrification, infotainment, and cloud-enabled automotive connectivity, carving out a unique technology edge in a growing sector.
Strategic Collision: Similarities & Divergences
Both companies compete in semiconductors but diverge sharply in scale and focus. Intel pursues a diversified platform approach targeting multiple verticals, while indie Semiconductor adopts a specialized strategy focused on automotive technology. Their primary battleground lies in embedded systems for connected and autonomous vehicles. This contrast creates distinct investment profiles: Intel offers broad industry exposure, whereas indie targets high-growth automotive innovation.
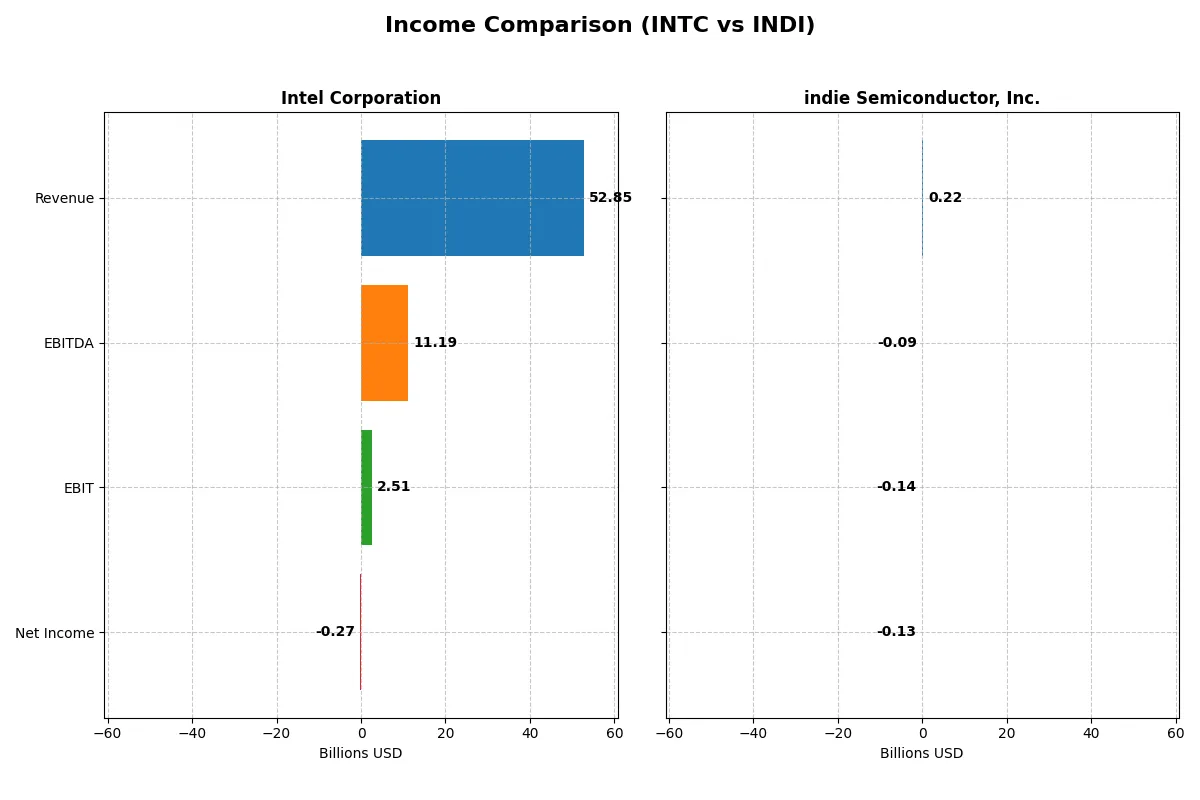
Income Statement Comparison
This data dissects the core profitability and scalability of both corporate engines to reveal who dominates the bottom line:
| Metric | Intel Corporation (INTC) | indie Semiconductor, Inc. (INDI) |
|---|---|---|
| Revenue | 52.9B | 217M |
| Cost of Revenue | 34.4B | 126M |
| Operating Expenses | 20.6B | 260M |
| Gross Profit | 18.5B | 90M |
| EBITDA | 11.2B | -94M |
| EBIT | 2.5B | -137M |
| Interest Expense | 953M | 9.3M |
| Net Income | -267M | -133M |
| EPS | -0.08 | -0.76 |
| Fiscal Year | 2025 | 2024 |
Income Statement Analysis: The Bottom-Line Duel
This income statement comparison reveals the true efficiency and profitability dynamics of Intel Corporation and indie Semiconductor, Inc.
Intel Corporation Analysis
Intel’s revenue declined slightly from $53.1B in 2024 to $52.9B in 2025, with net income improving dramatically from a $18.8B loss to a modest $267M loss. Gross margin remains favorable at 35%, reflecting solid production efficiency. Despite negative net margin, a 125% EBIT growth signals operational recovery momentum in 2025.
indie Semiconductor, Inc. Analysis
indie Semiconductor’s revenue dipped 2.9% to $217M in 2024, yet gross profit surged 264%, lifting gross margin to a favorable 42%. However, EBIT margin stays deeply negative at -63%, with net losses exceeding $132M. The company shows improving EPS growth but struggles to contain operating losses and negative net margin.
Margin Strength vs. Scale and Stability
Intel balances scale with recovering operational efficiency, trimming net losses sharply while maintaining strong gross margins. indie Semiconductor impresses with rapid gross profit growth and margin expansion but faces severe net losses and weak EBIT margins. Intel’s profile suits investors favoring scale and improving fundamentals; indie Semiconductor appeals to those prioritizing growth potential despite high risk.
Financial Ratios Comparison
These vital ratios act as a diagnostic tool to expose the underlying fiscal health, valuation premiums, and capital efficiency of the companies compared below:
| Ratios | Intel Corporation (INTC) | indie Semiconductor, Inc. (INDI) |
|---|---|---|
| ROE | -0.23% | -31.73% |
| ROIC | -0.02% | -19.25% |
| P/E | -658.4 | -5.35 |
| P/B | 1.54 | 1.70 |
| Current Ratio | 2.02 | 4.82 |
| Quick Ratio | 1.65 | 4.23 |
| D/E | 0.41 | 0.95 |
| Debt-to-Assets | 22.0% | 42.3% |
| Interest Coverage | -2.23 | -18.37 |
| Asset Turnover | 0.25 | 0.23 |
| Fixed Asset Turnover | 0.50 | 4.30 |
| Payout ratio | 0 | 0 |
| Dividend yield | 0 | 0 |
| Fiscal Year | 2025 | 2024 |
Efficiency & Valuation Duel: The Vital Signs
Ratios act as a company’s DNA, exposing hidden risks and operational strengths unseen in headline figures.
Intel Corporation
Intel shows weak profitability with negative ROE at -0.23% and a slim net margin of -0.51%, signaling operational challenges. The stock’s P/E is negative but marked favorable, reflecting losses rather than high valuation. Intel maintains a solid current ratio at 2.02 and returns no dividend, prioritizing reinvestment in R&D at 26% of revenue to drive future growth.
indie Semiconductor, Inc.
indie Semiconductor faces deeper profitability issues with a severe negative ROE of -31.73% and a net margin of -61.2%, indicating heavy losses. The P/E ratio is also negative yet favorable, reflecting the same loss condition. The company holds a high current ratio of 4.82 but suffers poor interest coverage. It pays no dividend, investing heavily in R&D at over 80% of revenue to fuel innovation.
Valuation Stretch vs. Profitability Struggles
Intel offers a more balanced profile with moderate operational risks and reasonable liquidity, despite unprofitable metrics. indie Semiconductor’s ratios reveal more acute losses and financial strain, offset only by aggressive R&D. Risk-tolerant investors seeking growth may lean toward indie’s innovation focus, while those favoring stability might prefer Intel’s steadier financial footing.
Which one offers the Superior Shareholder Reward?
Intel Corporation (INTC) eschews dividends in 2025, with a 0% payout ratio and negative free cash flow (-1.0/share), but maintains a strong buyback capacity supported by a 2.0 current ratio and moderate debt levels (debt/equity 0.41). indie Semiconductor, Inc. (INDI) pays no dividends and shows negative profitability and cash flow, with no buyback activity and high leverage (debt/equity 0.95). I see INTC’s distribution model as more sustainable, balancing capital allocation between buybacks and reinvestment. INDI’s losses and no shareholder distributions pose high risk. In 2026, I favor INTC for a superior total return profile driven by prudent buybacks and financial resilience.
Comparative Score Analysis: The Strategic Profile
The radar chart reveals the fundamental DNA and trade-offs of Intel Corporation and indie Semiconductor, highlighting their distinctive financial strengths and weaknesses:
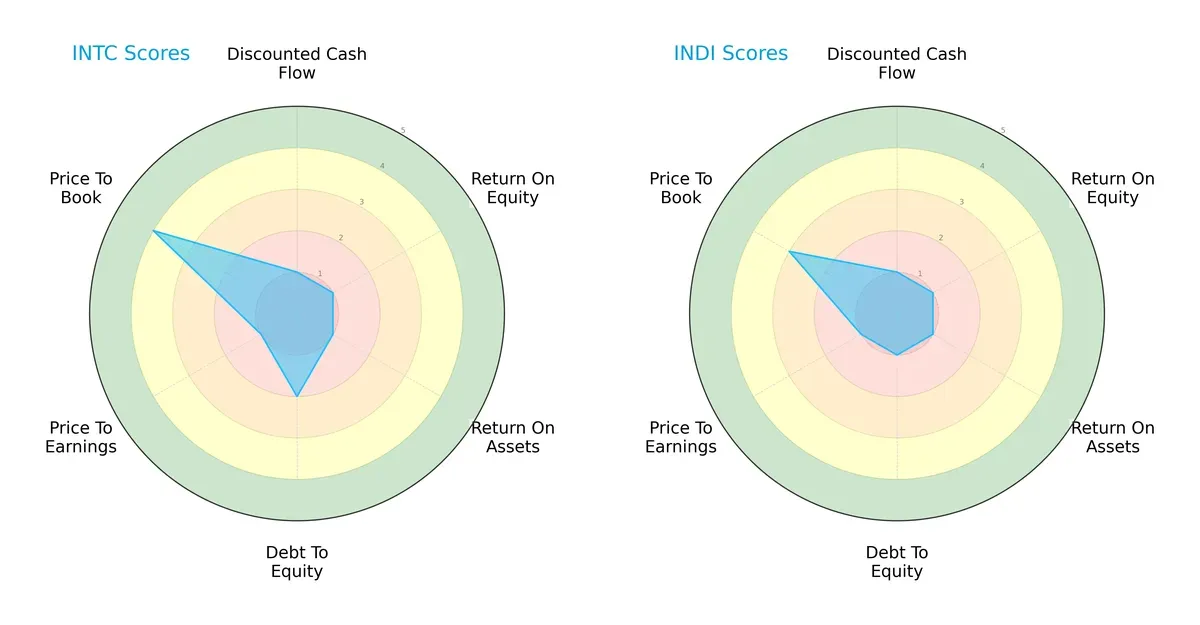
Intel shows a more balanced profile with moderate debt management and favorable price-to-book valuation. Indie Semiconductor relies heavily on cost control but scores very low on financial leverage and valuation metrics, indicating higher risk and less efficient capital use.
Bankruptcy Risk: Solvency Showdown
Intel’s Altman Z-Score of 2.49 places it in the grey zone, signaling moderate bankruptcy risk, while indie Semiconductor’s 0.22 marks it deep in the distress zone:
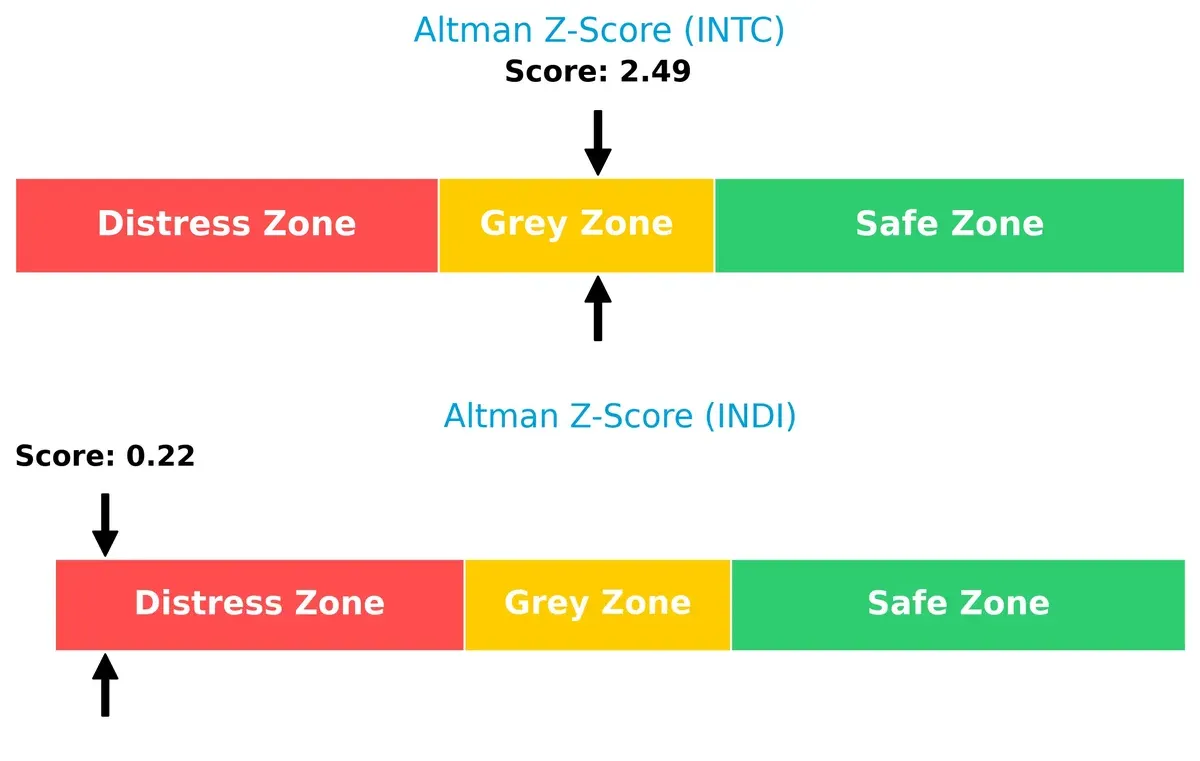
Intel’s relative solvency strength suggests better endurance through economic cycles. Indie Semiconductor faces significant bankruptcy risk, requiring cautious consideration.
Financial Health: Quality of Operations
Intel’s Piotroski F-Score of 4 indicates average financial health, outperforming indie Semiconductor’s weak score of 2, which raises red flags on internal operational metrics:
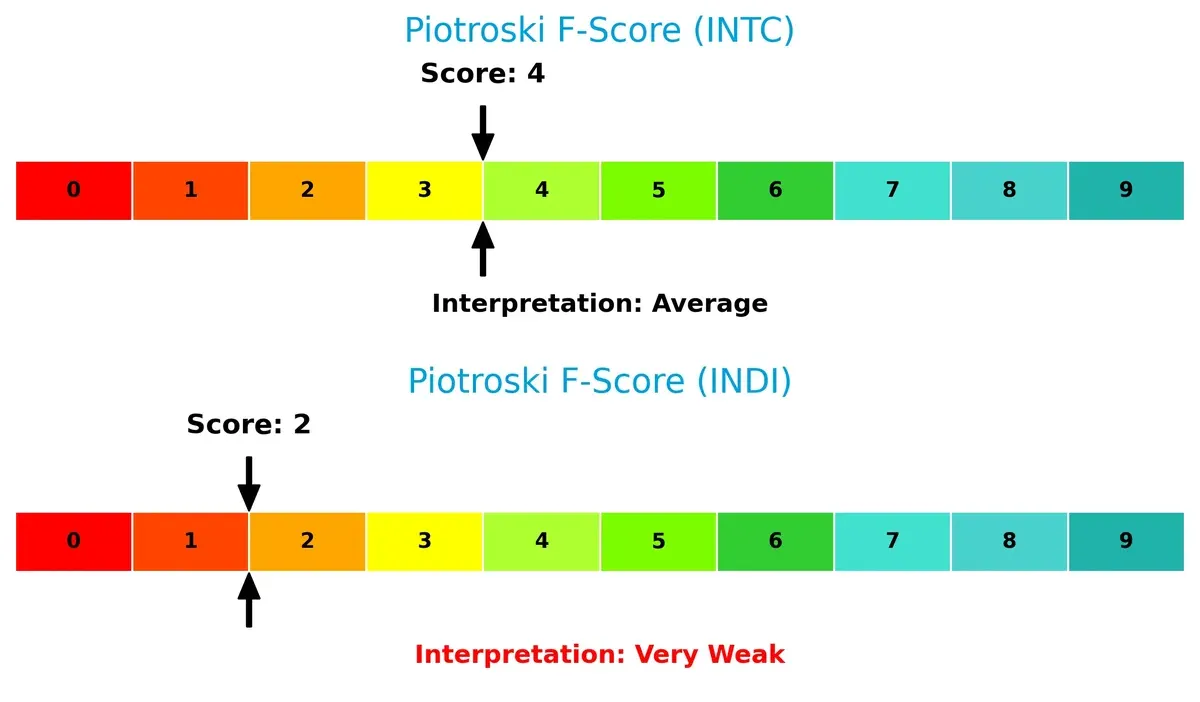
Intel demonstrates more robust profitability and efficiency. Indie Semiconductor’s weak score suggests operational challenges and higher financial instability.
How are the two companies positioned?
This section dissects INTC and INDI’s operational DNA by comparing revenue distribution and internal dynamics. The goal is to confront their economic moats to reveal the most resilient, sustainable advantage.
Revenue Segmentation: The Strategic Mix
The following visual comparison dissects how Intel Corporation and indie Semiconductor diversify their income streams and where their primary sector bets lie:
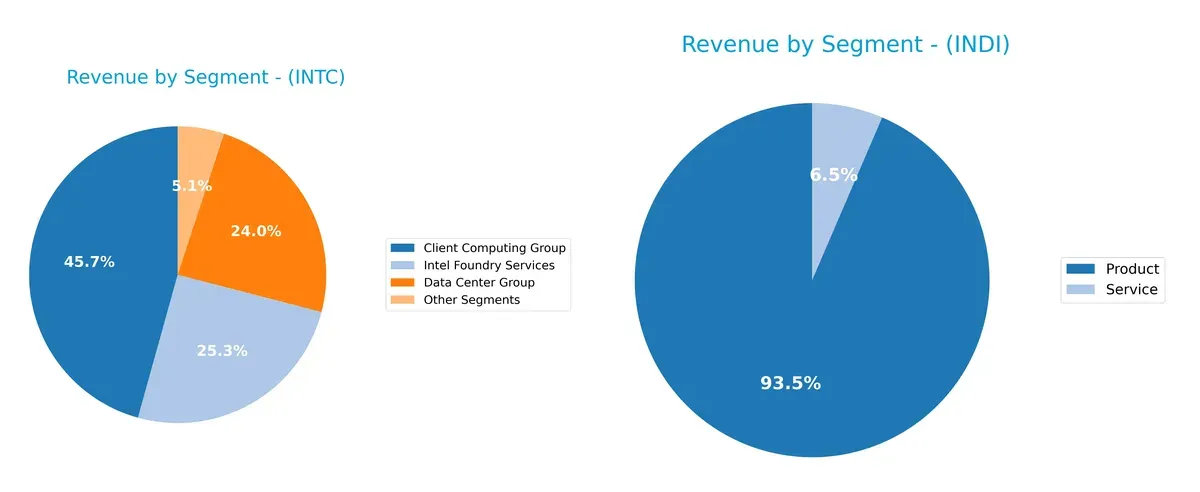
Intel Corporation dwarfs indie Semiconductor in scale, with a well-diversified mix across Client Computing Group ($32.2B), Data Center Group ($16.9B), and Foundry Services ($17.8B). Indie Semiconductor relies heavily on its Product segment ($203M in 2024) with a smaller Service component ($14M). Intel’s broad ecosystem reduces concentration risk and anchors infrastructure dominance. Indie’s focus on Products signals narrower market exposure and higher dependency on single-segment performance.
Strengths and Weaknesses Comparison
This table compares the Strengths and Weaknesses of Intel Corporation and indie Semiconductor, Inc.:
Intel Corporation Strengths
- Strong revenue diversification across computing, data center, foundry, and other segments
- Established global presence with significant sales in US, Singapore, Taiwan, and China
- Favorable liquidity ratios with current ratio at 2.02 and quick ratio at 1.65
indie Semiconductor, Inc. Strengths
- Favorable fixed asset turnover indicating efficient use of property and equipment
- Positive PE ratio despite losses suggests some market confidence
- Quick ratio favorable at 4.23, indicating good short-term liquidity management
Intel Corporation Weaknesses
- Negative profitability metrics including net margin (-0.51%) and ROE (-0.23%)
- Unfavorable asset and fixed asset turnover ratios signal inefficiencies
- No dividend yield, which may deter income-focused investors
indie Semiconductor, Inc. Weaknesses
- Severely negative profitability metrics with net margin at -61.2% and ROE at -31.73%
- Unfavorable WACC at 11.32% and negative interest coverage indicate financial stress
- High debt to equity ratio of 0.95 and unfavorable current ratio despite good quick ratio
Intel’s strengths lie in its diversified, global revenue base and solid liquidity, offset by weak profitability and asset efficiency. indie Semi shows operational efficiency in assets but faces deep profitability issues and financial leverage risks, impacting its risk profile.
The Moat Duel: Analyzing Competitive Defensibility
A structural moat is the only lasting shield that protects long-term profits from relentless competitive erosion. Here’s how Intel and indie Semiconductor stack up:
Intel Corporation: Legacy Scale & Diversification
Intel’s primary moat lies in its vast manufacturing scale and product breadth, supported by high gross margins around 35%. However, its ROIC has plunged below WACC, signaling value erosion. New markets like autonomous driving offer hope but also stiff innovation demands in 2026.
indie Semiconductor, Inc.: Niche Innovation & Emerging Tech
indie Semiconductor banks on its specialized automotive semiconductors moat, distinguished by product innovation rather than scale, contrasting Intel’s breadth. Despite a strong gross margin of 42%, its ROIC sharply trails WACC, reflecting ongoing value destruction. Growth in electrification tech could reshape its moat if execution improves.
Scale Dominance vs. Specialized Innovation: Who Defends Better?
Both firms suffer severely negative ROIC trends, indicating shrinking competitive moats. Yet, Intel’s entrenched scale and diverse revenue streams give it a wider and more durable moat. Intel appears better positioned to defend market share amid intensifying sector competition in 2026.
Which stock offers better returns?
The stock prices of Intel Corporation and indie Semiconductor, Inc. exhibit contrasting dynamics over the past year, with Intel showing a sustained upward trajectory and indie Semiconductor facing significant declines.
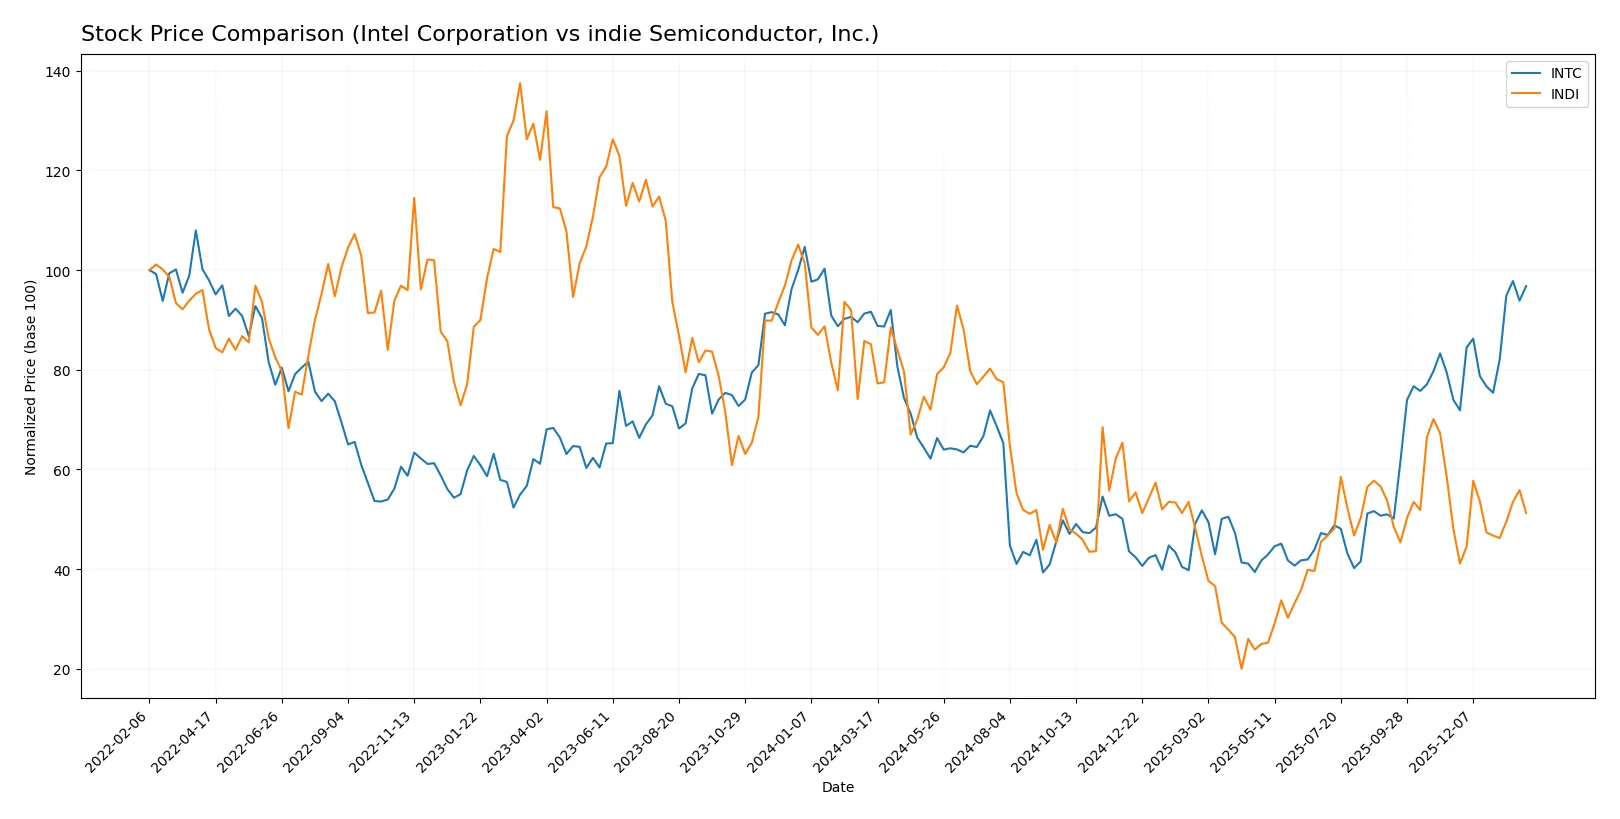
Trend Comparison
Intel’s stock gained 5.61% over the past 12 months, marking a bullish trend with acceleration and volatility at 8.11. Its price ranged between 18.89 and 46.96, with a strong recent surge of 30.83%.
indie Semiconductor’s stock fell 39.79% in the same period, reflecting a bearish trend despite acceleration. Volatility remained low at 1.32, with prices ranging from 1.6 to 7.43 and a modest recent rebound of 6.49%.
Intel outperformed indie Semiconductor with a positive 12-month return and stronger upward momentum, delivering the highest market performance in this comparison.
Target Prices
Analysts present a clear consensus on target prices for Intel Corporation and indie Semiconductor, Inc.
| Company | Target Low | Target High | Consensus |
|---|---|---|---|
| Intel Corporation | 20 | 66 | 46.95 |
| indie Semiconductor, Inc. | 8 | 8 | 8 |
Intel’s consensus target of 46.95 closely aligns with its current price of 46.47, reflecting balanced market expectations. indie Semiconductor’s target of 8 suggests significant upside from its current price of 4.1, indicating bullish analyst sentiment.

Don’t Let Luck Decide Your Entry Point
Optimize your entry points with our advanced ProRealTime indicators. You’ll get efficient buy signals with precise price targets for maximum performance. Start outperforming now!
How do institutions grade them?
The institutional grades for Intel Corporation and indie Semiconductor, Inc. are presented below:
Intel Corporation Grades
The following table summarizes Intel Corporation’s recent institutional grades:
| Grading Company | Action | New Grade | Date |
|---|---|---|---|
| RBC Capital | Maintain | Sector Perform | 2026-01-23 |
| Keybanc | Maintain | Overweight | 2026-01-23 |
| Evercore ISI Group | Maintain | In Line | 2026-01-23 |
| Needham | Maintain | Hold | 2026-01-23 |
| Benchmark | Maintain | Buy | 2026-01-23 |
| Rosenblatt | Maintain | Sell | 2026-01-23 |
| UBS | Maintain | Neutral | 2026-01-23 |
| Citigroup | Maintain | Neutral | 2026-01-23 |
| Stifel | Maintain | Hold | 2026-01-23 |
| Wedbush | Maintain | Neutral | 2026-01-23 |
indie Semiconductor, Inc. Grades
The following table summarizes indie Semiconductor, Inc.’s recent institutional grades:
| Grading Company | Action | New Grade | Date |
|---|---|---|---|
| UBS | Maintain | Neutral | 2025-11-10 |
| Benchmark | Maintain | Buy | 2025-06-25 |
| Benchmark | Maintain | Buy | 2025-06-11 |
| Benchmark | Maintain | Buy | 2025-05-21 |
| Benchmark | Maintain | Buy | 2025-05-13 |
| Craig-Hallum | Maintain | Buy | 2025-05-13 |
| Keybanc | Maintain | Overweight | 2025-05-13 |
| Benchmark | Maintain | Buy | 2025-04-09 |
| Benchmark | Maintain | Buy | 2025-02-21 |
| Keybanc | Maintain | Overweight | 2025-02-21 |
Which company has the best grades?
indie Semiconductor, Inc. consistently receives Buy and Overweight grades, signaling stronger institutional confidence. Intel Corporation’s grades vary widely from Buy to Sell, reflecting mixed sentiment. This divergence may affect investor perception of stability and growth prospects.
Risks specific to each company
The following categories identify the critical pressure points and systemic threats facing both firms in the 2026 market environment:
1. Market & Competition
Intel Corporation
- Large market cap provides scale advantages but faces intense competition from AMD, Nvidia, and TSMC.
indie Semiconductor, Inc.
- Small cap with niche automotive focus, vulnerable to larger semiconductor firms expanding into its segment.
2. Capital Structure & Debt
Intel Corporation
- Moderate debt-to-equity (0.41) and manageable interest coverage (2.63) signal balanced leverage.
indie Semiconductor, Inc.
- High debt-to-equity (~0.95) and negative interest coverage (-14.8) raise serious solvency concerns.
3. Stock Volatility
Intel Corporation
- Beta of 1.35 indicates moderate volatility typical for large tech stocks.
indie Semiconductor, Inc.
- Beta of 2.54 signals very high volatility, reflecting speculative and risky profile.
4. Regulatory & Legal
Intel Corporation
- Subject to global antitrust scrutiny and export controls affecting supply chains.
indie Semiconductor, Inc.
- Faces automotive industry regulations and safety standards that could increase compliance costs.
5. Supply Chain & Operations
Intel Corporation
- Complex multi-segment operations risk supply disruptions but benefit from diversification.
indie Semiconductor, Inc.
- Limited scale and supplier base increase operational fragility.
6. ESG & Climate Transition
Intel Corporation
- Advanced sustainability programs but high energy consumption in fabrication raises transition risks.
indie Semiconductor, Inc.
- Emerging company with limited ESG disclosures, increasing investor uncertainty.
7. Geopolitical Exposure
Intel Corporation
- Significant exposure to US-China tensions impacting chip manufacturing and exports.
indie Semiconductor, Inc.
- Smaller footprint reduces direct geopolitical risks but limits global market access.
Which company shows a better risk-adjusted profile?
Intel Corporation’s scale and more balanced financial structure provide a better risk-adjusted profile than indie Semiconductor’s high leverage and operational fragility. Intel’s biggest risk lies in fierce market competition and geopolitical tensions, while indie Semiconductor’s solvency and volatility pose existential threats. Intel’s grey zone Altman Z-Score contrasts sharply with indie’s distress zone, underscoring my caution with indie’s financial health.
Final Verdict: Which stock to choose?
Intel Corporation’s superpower lies in its robust operational infrastructure and solid liquidity, underpinning its ability to weather cyclical downturns. However, its declining ROIC and ongoing value destruction serve as a point of vigilance. Intel fits portfolios seeking established industry players with potential for turnaround and moderate risk tolerance.
indie Semiconductor commands a strategic moat through its heavy investment in R&D, aiming to carve a niche in semiconductor innovation. Its higher liquidity ratios suggest relative safety, though the company struggles with profitability and financial stability. indie suits investors focused on speculative growth with appetite for early-stage risk.
If you prioritize resilience and established scale, Intel outshines indie with stronger cash flow fundamentals despite profitability headwinds. However, if you seek aggressive growth and can bear volatility, indie offers superior innovation exposure though with notable financial fragility. Each scenario demands careful risk calibration aligned with investor objectives.
Disclaimer: Investment carries a risk of loss of initial capital. The past performance is not a reliable indicator of future results. Be sure to understand risks before making an investment decision.
Go Further
I encourage you to read the complete analyses of Intel Corporation and indie Semiconductor, Inc. to enhance your investment decisions: