Home > Comparison > Technology > INTC vs GFS
The strategic rivalry between Intel Corporation and GLOBALFOUNDRIES Inc. defines the semiconductor industry’s evolution. Intel operates as a diversified technology giant with integrated design and manufacturing across multiple product lines. GLOBALFOUNDRIES focuses exclusively on foundry services, emphasizing wafer fabrication for a range of semiconductor devices. This head-to-head reflects a clash between broad innovation and specialized manufacturing. This analysis aims to identify which trajectory offers superior risk-adjusted returns for a diversified portfolio in 2026.
Table of contents
Companies Overview
Intel Corporation and GLOBALFOUNDRIES Inc. stand as pivotal players shaping the semiconductor industry’s future.
Intel Corporation: Semiconductor Giant with Diversified Platforms
Intel dominates as a leading semiconductor designer and manufacturer. It generates revenue through CPUs, chipsets, and system-on-chip solutions across consumer, enterprise, and cloud markets. In 2026, its strategy focuses on advancing high-performance computing and autonomous driving technologies, leveraging AI partnerships to enhance innovation.
GLOBALFOUNDRIES Inc.: Specialized Semiconductor Foundry
GLOBALFOUNDRIES operates as a dedicated semiconductor foundry, manufacturing integrated circuits for diverse electronic devices. Its revenue stems from wafer fabrication and mainstream process technologies. The 2026 focus centers on expanding wafer production capacity and refining process technologies to support next-gen microprocessors and communication chips.
Strategic Collision: Similarities & Divergences
Intel integrates design and manufacturing, pursuing a vertically integrated model, while GLOBALFOUNDRIES emphasizes an open foundry service. Their primary battleground is chip manufacturing sophistication and capacity. Intel’s diversified platform approach contrasts with GLOBALFOUNDRIES’ pure-play foundry focus, creating distinct investment profiles rooted in breadth versus specialization.
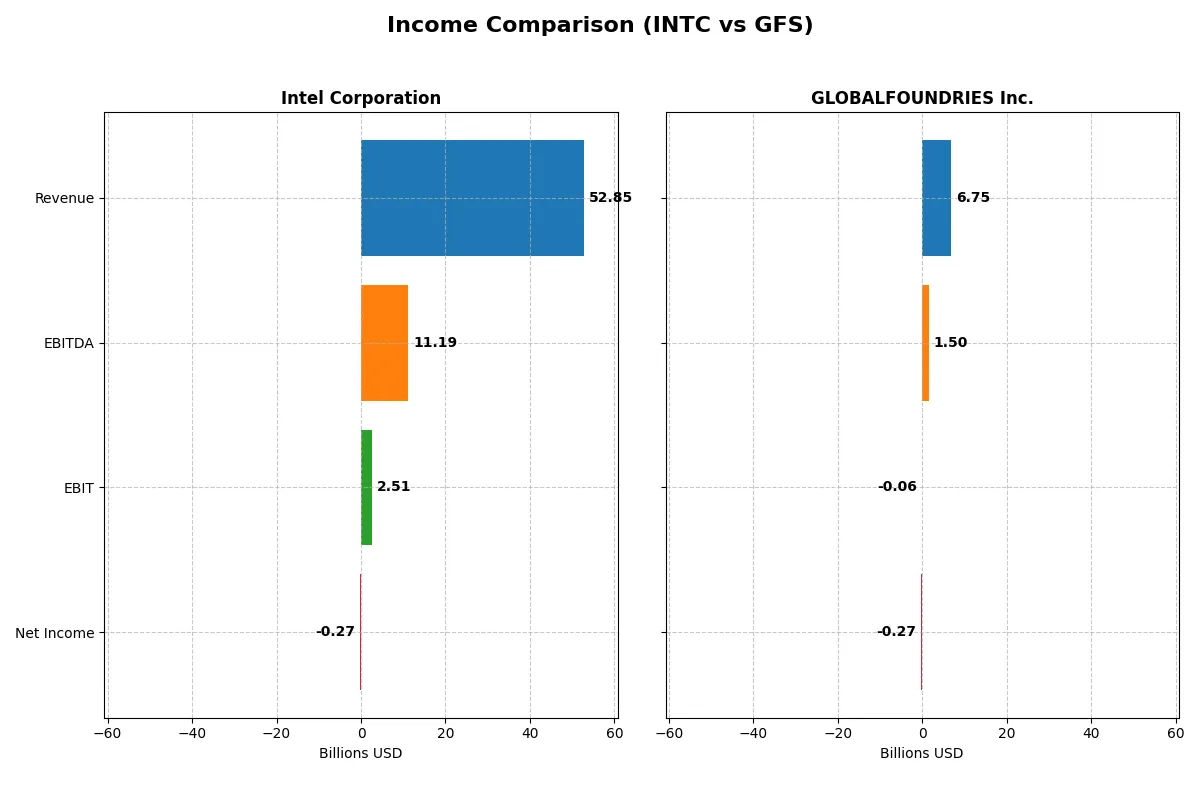
Income Statement Comparison
This data dissects the core profitability and scalability of both corporate engines to reveal who dominates the bottom line:
| Metric | Intel Corporation (INTC) | GLOBALFOUNDRIES Inc. (GFS) |
|---|---|---|
| Revenue | 52.9B | 6.75B |
| Cost of Revenue | 34.4B | 5.10B |
| Operating Expenses | 20.6B | 1.87B |
| Gross Profit | 18.5B | 1.65B |
| EBITDA | 11.2B | 1.50B |
| EBIT | 2.51B | -64M |
| Interest Expense | 953M | 145M |
| Net Income | -267M | -265M |
| EPS | -0.08 | -0.48 |
| Fiscal Year | 2025 | 2024 |
Income Statement Analysis: The Bottom-Line Duel
This income statement comparison reveals which company manages its revenue and expenses more efficiently, exposing the true strength of their corporate engines.
Intel Corporation Analysis
Intel’s revenue declined from $79B in 2021 to $53B in 2025, signaling shrinking top-line scale. Its gross margin remains solid near 35%, but net income swung from a $20B profit in 2021 to a $267M loss in 2025, reflecting margin compression. Despite recent operating losses, Intel improved EBIT by 125% year-over-year, showing signs of operational recovery.
GLOBALFOUNDRIES Inc. Analysis
GLOBALFOUNDRIES posted revenue growth from $4.9B in 2020 to $6.75B in 2024 but suffered a shrinking gross margin around 24%. Its net income fluctuated, peaking at $1B in 2023 before sliding to a $265M loss in 2024. The company’s EBIT turned negative recently, indicating deteriorating operational efficiency amid declining profitability.
Margin Strength vs. Revenue Stability
Intel commands a higher gross margin and shows improving EBIT momentum despite top-line contraction, whereas GLOBALFOUNDRIES grows revenue but struggles with negative net margins and EBIT losses. Intel’s profile suits investors prioritizing margin recovery and operational stability. GLOBALFOUNDRIES appeals more to those focused on revenue growth despite current profitability challenges.
Financial Ratios Comparison
These vital ratios act as a diagnostic tool to expose the underlying fiscal health, valuation premiums, and capital efficiency of the companies compared below:
| Ratios | Intel Corporation (INTC) | GLOBALFOUNDRIES Inc. (GFS) |
|---|---|---|
| ROE | -0.23% | -2.46% |
| ROIC | -0.02% | -1.47% |
| P/E | -658.4 | -89.5 |
| P/B | 1.54 | 2.20 |
| Current Ratio | 2.02 | 2.11 |
| Quick Ratio | 1.65 | 1.57 |
| D/E | 0.41 | 0.22 |
| Debt-to-Assets | 22.0% | 13.8% |
| Interest Coverage | -2.23 | -1.48 |
| Asset Turnover | 0.25 | 0.40 |
| Fixed Asset Turnover | 0.50 | 0.82 |
| Payout Ratio | 0 | 0 |
| Dividend Yield | 0 | 0 |
| Fiscal Year | 2025 | 2024 |
Efficiency & Valuation Duel: The Vital Signs
Ratios act as a company’s DNA, unveiling hidden risks and operational excellence that raw numbers alone cannot reveal.
Intel Corporation
Intel’s profitability ratios paint a challenging picture with negative ROE and net margins, signaling operational struggles. Its low P/E suggests a cheap valuation, yet the firm lacks dividends, channeling resources heavily into R&D, reflecting a growth focus. Despite a stable current ratio and manageable debt, efficiency metrics remain weak, hinting at structural hurdles.
GLOBALFOUNDRIES Inc.
GLOBALFOUNDRIES shows deeper profitability deficits with more negative ROE and net margins, coupled with a higher WACC that pressures returns. The firm’s P/E also signals undervaluation, but interest coverage is negative, flagging financial stress. The company avoids dividends, likely reinvesting in growth, yet operational efficiency remains below par, emphasizing risk in execution.
Valuation Caution Meets Operational Challenge
Intel offers a more balanced risk profile with better liquidity and debt management but suffers weak returns and efficiency. GLOBALFOUNDRIES faces greater financial strain and operational inefficiency. Investors prioritizing stability may lean toward Intel, while those accepting higher risk for potential turnaround might consider GLOBALFOUNDRIES.
Which one offers the Superior Shareholder Reward?
Intel Corporation (INTC) offers a more attractive shareholder reward than GLOBALFOUNDRIES Inc. (GFS) in 2026. INTC pays a modest dividend yield of 1.84% in 2025, though its free cash flow per share turned negative at -1.02, signaling pressure on coverage. Intel’s dividend payout ratio stands at zero in 2025, reflecting a pause or reset, but it has historically maintained dividends supported by cash flow. Buybacks, a critical return lever, are less clear but historically significant for INTC. Conversely, GFS does not pay dividends, reinvesting aggressively in growth and capex, evidenced by positive free cash flow of 1.98 per share in 2024 and a strong capital expenditure coverage ratio of 2.76. GFS’s lack of shareholder distributions limits immediate returns despite improving margins. I conclude that INTC’s combined dividend and buyback model, albeit challenged recently, still provides a more sustainable and superior total return profile for long-term investors compared to GFS’s growth-only approach.
Comparative Score Analysis: The Strategic Profile
The radar chart reveals the core DNA and trade-offs shaping Intel Corporation and GLOBALFOUNDRIES Inc.’s financial profiles:
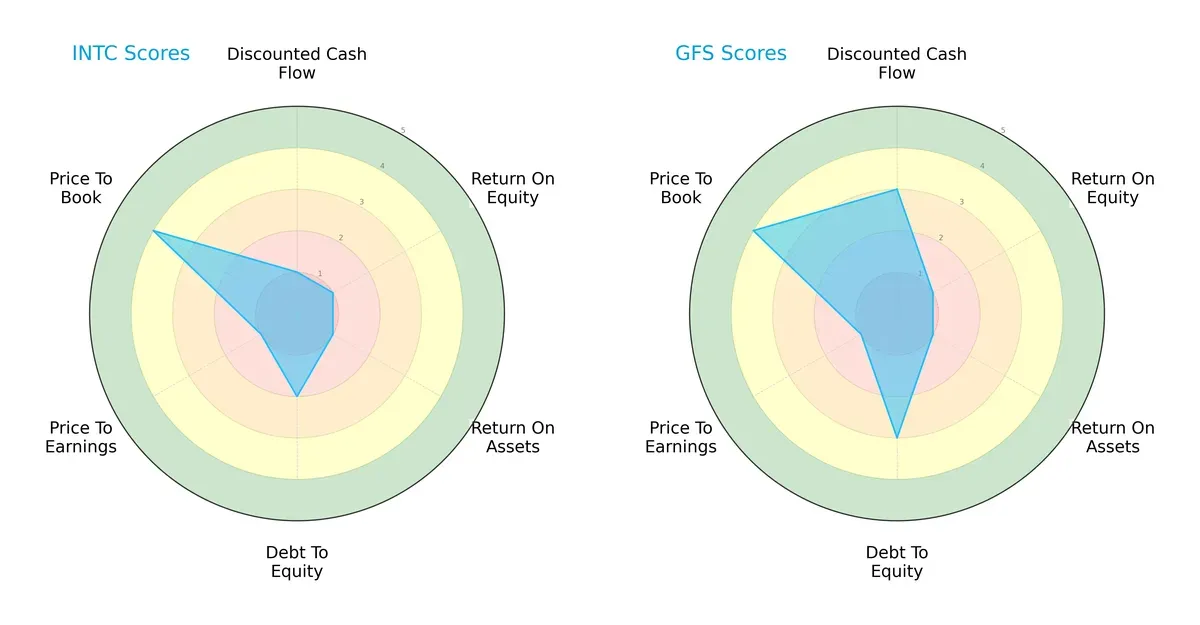
Intel and GLOBALFOUNDRIES share a moderate overall score of 2, but their strengths diverge sharply. GLOBALFOUNDRIES excels in discounted cash flow (DCF) and debt-to-equity metrics, signaling better valuation discipline and balance sheet strength. Intel, conversely, relies heavily on a favorable price-to-book ratio, despite weak returns on equity and assets. GLOBALFOUNDRIES presents a more balanced profile, while Intel depends on specific valuation metrics to offset operational weaknesses.
Bankruptcy Risk: Solvency Showdown
The Altman Z-Score difference highlights contrasting solvency prospects in this cycle:
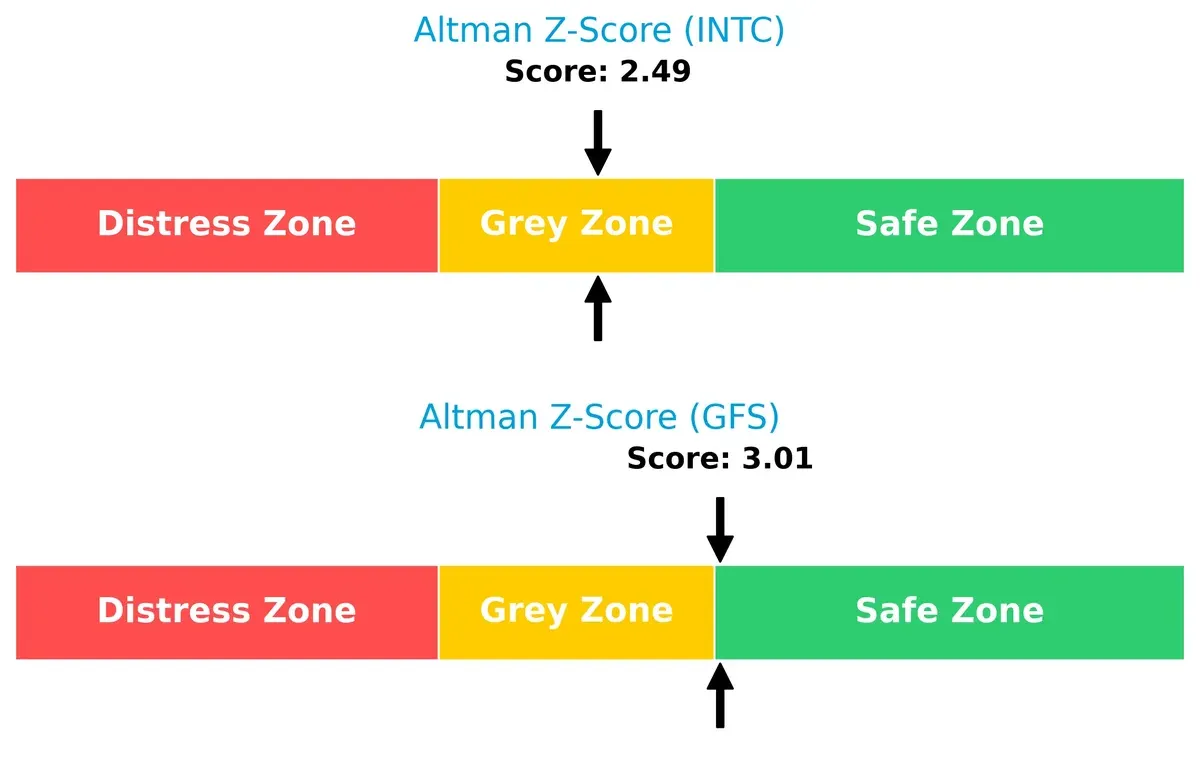
GLOBALFOUNDRIES stands in the safe zone with a score above 3, indicating solid financial stability and lower bankruptcy risk. Intel remains in the grey zone around 2.5, signaling moderate distress risk. I view GLOBALFOUNDRIES as the safer long-term survivor based on this metric.
Financial Health: Quality of Operations
Piotroski F-Scores illuminate internal financial quality differences:
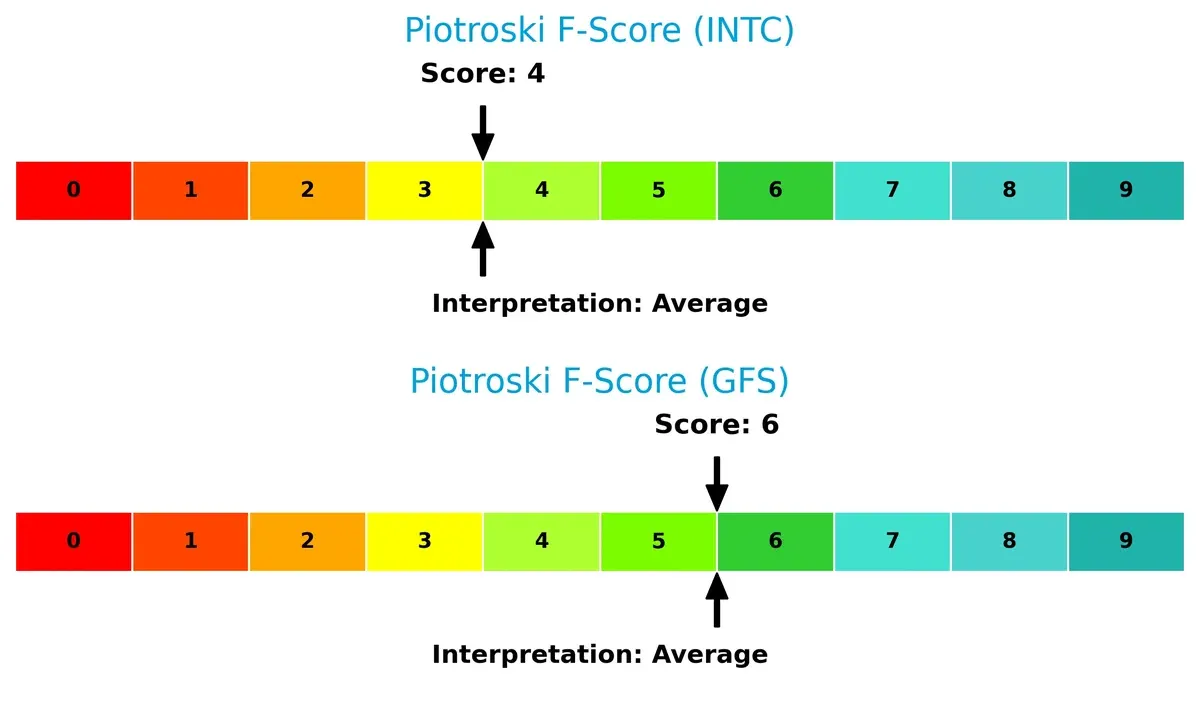
GLOBALFOUNDRIES scores a 6, indicating decent financial health, while Intel’s 4 flags potential red flags in profitability or efficiency metrics. Both firms show room for improvement, but Intel’s weaker internal metrics warrant caution.
How are the two companies positioned?
This section dissects the operational DNA of Intel and GLOBALFOUNDRIES by comparing their revenue distribution by segment alongside internal strengths and weaknesses. The objective is to confront their economic moats and identify which business model offers a more resilient, sustainable competitive advantage today.
Revenue Segmentation: The Strategic Mix
This visual comparison dissects how Intel Corporation and GLOBALFOUNDRIES diversify their income streams and where their primary sector bets lie:
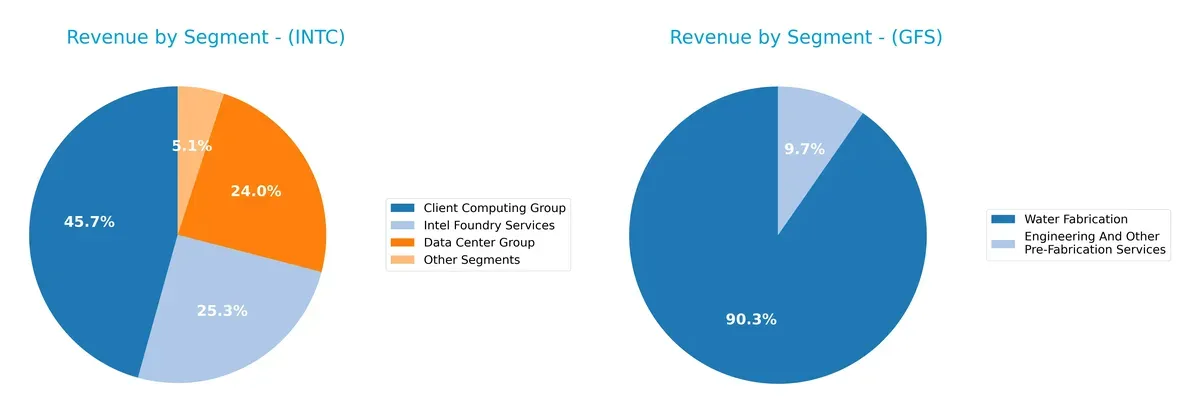
Intel’s revenue spreads across Client Computing Group ($32.2B), Intel Foundry Services ($17.8B), and Data Center Group ($16.9B). This mix signals a balanced ecosystem with less concentration risk. GLOBALFOUNDRIES relies heavily on Water Fabrication ($6.1B), dwarfing its Engineering Services ($652M). GFS’s narrow focus anchors its infrastructure dominance but exposes it to sector cyclicality. Intel’s diversified segmentation offers strategic resilience over GFS’s concentrated model.
Strengths and Weaknesses Comparison
This table compares the Strengths and Weaknesses of Intel Corporation and GLOBALFOUNDRIES Inc.:
Intel Corporation Strengths
- Diverse product segments including computing, data center, and foundry services
- Strong global presence with significant US and Asian markets
- Solid liquidity ratios (current and quick ratios above 1.5)
- Moderate leverage with favorable debt-to-assets ratio
GLOBALFOUNDRIES Inc. Strengths
- Focused product lines with specialization in water fabrication and engineering services
- Favorable liquidity ratios indicating short-term financial health
- Low debt-to-assets ratio suggesting conservative capital structure
- Presence in US, Europe, and other geographic markets
Intel Corporation Weaknesses
- Negative profitability metrics including net margin, ROE, and ROIC
- Asset turnover ratios below industry standards indicate operational inefficiencies
- No dividend yield, potentially reducing income appeal
- Slightly unfavorable overall financial ratios with some leverage concerns
GLOBALFOUNDRIES Inc. Weaknesses
- More pronounced negative profitability metrics than Intel
- Higher weighted average cost of capital (WACC) signals expensive capital
- Negative interest coverage ratio raises solvency concerns
- No dividend yield and unfavorable asset turnover ratios
Intel’s broad diversification and solid liquidity contrast with GLOBALFOUNDRIES’ narrower specialization but stronger capital conservatism. Both face profitability challenges, impacting strategic priorities in operational efficiency and financial management.
The Moat Duel: Analyzing Competitive Defensibility
A structural moat is the only safeguard for long-term profits against relentless competitive pressures. Let’s dissect the moats of Intel Corporation and GLOBALFOUNDRIES Inc.:
Intel Corporation: Intangible Assets Powerhouse
Intel’s moat stems from its vast intellectual property and manufacturing scale. This delivers margin stability despite revenue headwinds. In 2026, new AI-driven platforms could either reinforce or challenge this advantage.
GLOBALFOUNDRIES Inc.: Cost Advantage Challenger
GLOBALFOUNDRIES relies on cost-efficient wafer fabrication to compete. Unlike Intel’s intangible asset dominance, GFS’s growing ROIC signals improving operational leverage. Expansion into specialty nodes could disrupt market share dynamics.
Intangible Assets vs. Cost Efficiency: Who Holds the Deeper Moat?
Intel’s intangible assets build a broader moat, but declining ROIC warns of eroding defensibility. GLOBALFOUNDRIES shows improving profitability yet still sheds value overall. Intel remains better positioned to defend its market share, but vigilance on execution is crucial.
Which stock offers better returns?
The past year reveals divergent trajectories: Intel Corporation posted a steady price rise with accelerating momentum, while GLOBALFOUNDRIES Inc. faced a marked decline despite recent gains.
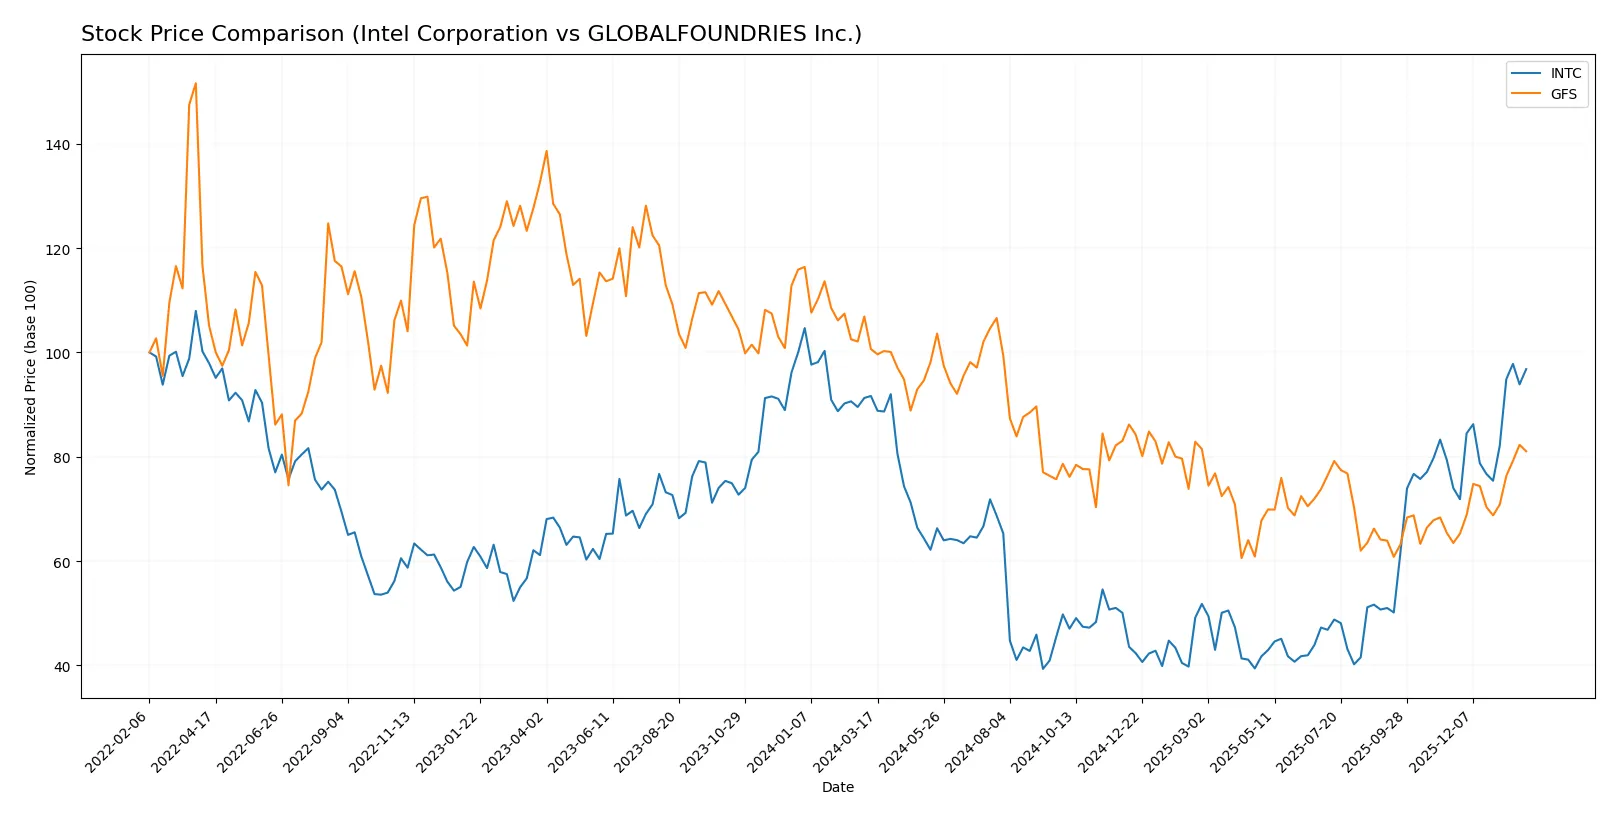
Trend Comparison
Intel’s stock rose 5.61% over the past 12 months, marking a bullish trend with accelerating gains and a high price of 46.96. Volatility, measured by an 8.11 standard deviation, suggests notable price fluctuations.
GLOBALFOUNDRIES’ stock declined 19.48% over the same period, indicating a bearish trend despite acceleration. Its highest price reached 55.5, with a 6.18 standard deviation reflecting moderate volatility.
Comparing both, Intel delivered the highest market performance with sustained positive returns, while GLOBALFOUNDRIES showed overall losses despite recent partial recovery.
Target Prices
Analysts present a mixed but generally positive outlook for Intel Corporation and GLOBALFOUNDRIES Inc.
| Company | Target Low | Target High | Consensus |
|---|---|---|---|
| Intel Corporation | 20 | 66 | 46.95 |
| GLOBALFOUNDRIES Inc. | 37 | 40 | 38.5 |
Intel’s consensus target price aligns closely with its current price of 46.47, suggesting limited upside. GLOBALFOUNDRIES trades above its consensus of 38.5, indicating potential downside risk.

Don’t Let Luck Decide Your Entry Point
Optimize your entry points with our advanced ProRealTime indicators. You’ll get efficient buy signals with precise price targets for maximum performance. Start outperforming now!
How do institutions grade them?
Intel Corporation Grades
Here are the latest grades from established financial institutions for Intel Corporation:
| Grading Company | Action | New Grade | Date |
|---|---|---|---|
| RBC Capital | Maintain | Sector Perform | 2026-01-23 |
| Keybanc | Maintain | Overweight | 2026-01-23 |
| Evercore ISI Group | Maintain | In Line | 2026-01-23 |
| Needham | Maintain | Hold | 2026-01-23 |
| Benchmark | Maintain | Buy | 2026-01-23 |
| Rosenblatt | Maintain | Sell | 2026-01-23 |
| UBS | Maintain | Neutral | 2026-01-23 |
| Citigroup | Maintain | Neutral | 2026-01-23 |
| Stifel | Maintain | Hold | 2026-01-23 |
| Wedbush | Maintain | Neutral | 2026-01-23 |
GLOBALFOUNDRIES Inc. Grades
Below are the recent grades from reputable institutions for GLOBALFOUNDRIES Inc.:
| Grading Company | Action | New Grade | Date |
|---|---|---|---|
| Citigroup | Maintain | Neutral | 2026-01-15 |
| Wedbush | Downgrade | Neutral | 2025-12-31 |
| B of A Securities | Maintain | Underperform | 2025-12-04 |
| Citigroup | Maintain | Neutral | 2025-11-13 |
| Evercore ISI Group | Maintain | Outperform | 2025-11-13 |
| JP Morgan | Maintain | Neutral | 2025-11-13 |
| Wedbush | Maintain | Outperform | 2025-11-13 |
| B of A Securities | Downgrade | Underperform | 2025-10-13 |
| Wedbush | Maintain | Outperform | 2025-08-06 |
| Morgan Stanley | Maintain | Equal Weight | 2025-08-06 |
Which company has the best grades?
Intel Corporation has a wider range of grades, including Buy and Overweight ratings, while GLOBALFOUNDRIES mainly receives Neutral and Underperform grades. Intel’s stronger consensus could indicate more favorable institutional sentiment, potentially influencing investor confidence.
Risks specific to each company
The following categories identify the critical pressure points and systemic threats facing both firms in the 2026 market environment:
1. Market & Competition
Intel Corporation
- Faces intense competition from diversified semiconductor players, impacting margins and innovation cycles.
GLOBALFOUNDRIES Inc.
- Competes primarily as a foundry, pressured by larger peers and customer concentration risk.
2. Capital Structure & Debt
Intel Corporation
- Moderate debt-to-equity ratio (0.41) supports flexibility; interest coverage is neutral at 2.63x.
GLOBALFOUNDRIES Inc.
- Lower leverage (0.22 D/E) but negative interest coverage (-0.44) signals financial stress.
3. Stock Volatility
Intel Corporation
- Beta at 1.35 indicates above-market volatility but more stable than peers historically.
GLOBALFOUNDRIES Inc.
- Higher beta (1.49) reflects greater price swings and investor uncertainty.
4. Regulatory & Legal
Intel Corporation
- Subject to stringent US and global tech regulations, with potential antitrust scrutiny.
GLOBALFOUNDRIES Inc.
- Faces regulatory risks tied to international trade and foundry-specific environmental compliance.
5. Supply Chain & Operations
Intel Corporation
- Large, complex supply chain exposed to global semiconductor shortages and geopolitical disruptions.
GLOBALFOUNDRIES Inc.
- More concentrated manufacturing footprint increases vulnerability to operational interruptions.
6. ESG & Climate Transition
Intel Corporation
- Under pressure to accelerate emissions cuts and responsible sourcing due to scale and visibility.
GLOBALFOUNDRIES Inc.
- ESG initiatives less mature; climate transition risks pose potential reputational and regulatory costs.
7. Geopolitical Exposure
Intel Corporation
- High exposure to US-China tensions affecting supply chains and market access.
GLOBALFOUNDRIES Inc.
- Also exposed to geopolitical risks, but smaller global footprint moderates impact.
Which company shows a better risk-adjusted profile?
Intel’s most impactful risk is its negative profitability combined with competitive pressure, evident from its slightly unfavorable financial ratios. GLOBALFOUNDRIES faces a more severe financial distress risk with negative interest coverage and weaker profitability. Despite higher volatility, Intel’s stronger capital structure and moderate Altman Z-Score place it in a better risk-adjusted position. GLOBALFOUNDRIES’s safe zone Altman Z-Score is positive but offset by operational and earnings weaknesses. The contrasting debt-service capacity and profitability trends justify my vigilance on GLOBALFOUNDRIES’s financial health.
Final Verdict: Which stock to choose?
Intel Corporation’s superpower lies in its robust operational scale and strong liquidity, which provide a solid foundation amid challenging profitability trends. Its main point of vigilance is the persistent value destruction reflected in its declining ROIC. Intel fits portfolios seeking turnaround potential with a tolerance for volatility.
GLOBALFOUNDRIES Inc. benefits from a strategic moat in its focused foundry services and a cleaner balance sheet with notably lower leverage. While its profitability metrics remain under pressure, it offers better financial stability than Intel. This profile suits investors favoring disciplined growth with moderate risk exposure.
If you prioritize scale and liquidity in a cyclical recovery, Intel is the compelling choice due to its market presence and recent EBIT growth acceleration. However, if you seek financial stability and improving profitability trends, GLOBALFOUNDRIES offers better consistency and a safer balance sheet. Both present analytical scenarios for investors balancing growth and risk differently.
Disclaimer: Investment carries a risk of loss of initial capital. The past performance is not a reliable indicator of future results. Be sure to understand risks before making an investment decision.
Go Further
I encourage you to read the complete analyses of Intel Corporation and GLOBALFOUNDRIES Inc. to enhance your investment decisions: