Home > Comparison > Technology > INTC vs CEVA
The strategic rivalry between Intel Corporation and CEVA, Inc. shapes the semiconductor industry’s evolution. Intel operates as a capital-intensive semiconductor manufacturer with a broad product portfolio, while CEVA focuses on licensing high-margin wireless connectivity and AI processors. This analysis contrasts their operational models and growth trajectories, determining which offers superior risk-adjusted returns. Investors will gain clarity on the optimal choice for a diversified portfolio navigating the dynamic technology sector.
Table of contents
Companies Overview
Intel Corporation and CEVA, Inc. hold pivotal roles in the semiconductor market, shaping technology across diverse industries.
Intel Corporation: Semiconductor Pioneer and Platform Innovator
Intel dominates as a semiconductor giant, designing and manufacturing CPUs, chipsets, and system-on-chip products. Its revenue stems from selling platform products and adjacent technologies like accelerators and connectivity solutions. In 2026, Intel focuses strategically on high-performance computing and embedded applications, targeting cloud providers, enterprise, and autonomous driving sectors.
CEVA, Inc.: Wireless Connectivity and AI IP Licensor
CEVA specializes as a licensor of digital signal processors and AI platforms for wireless connectivity and smart sensing. Its core revenue comes from licensing DSP cores and AI processors to semiconductor and OEM companies. In 2026, CEVA emphasizes expanding AI-driven sensor fusion, imaging, and low-power IoT technologies across mobile, automotive, and industrial markets.
Strategic Collision: Similarities & Divergences
Intel pursues a vertically integrated model, controlling design and manufacturing, while CEVA operates on an open IP licensing model. They primarily compete in AI and connectivity solutions embedded in devices and infrastructure. Intel offers broader platform control and scale, whereas CEVA provides specialized, flexible IP—each appealing to distinct investment profiles based on scale versus innovation focus.
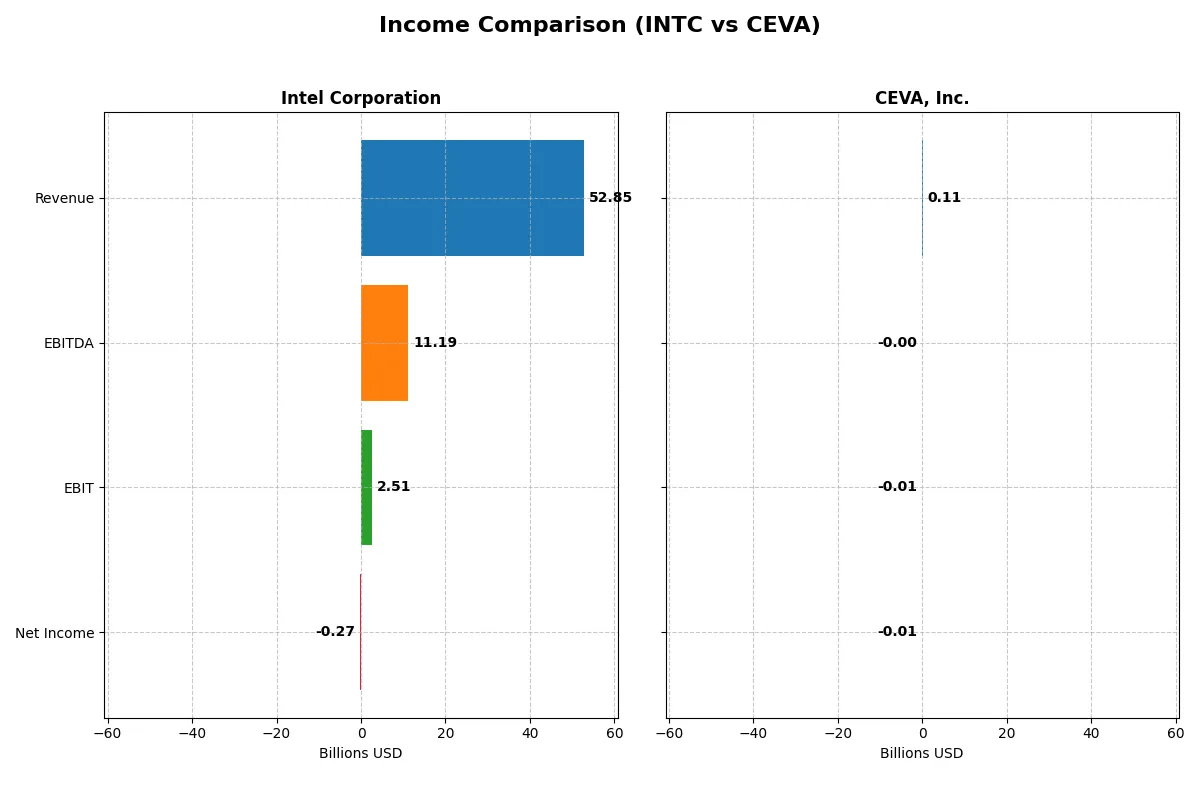
Income Statement Comparison
This data dissects the core profitability and scalability of both corporate engines to reveal who dominates the bottom line:
| Metric | Intel Corporation (INTC) | CEVA, Inc. (CEVA) |
|---|---|---|
| Revenue | 52.9B | 107M |
| Cost of Revenue | 34.4B | 13M |
| Operating Expenses | 20.6B | 102M |
| Gross Profit | 18.5B | 94M |
| EBITDA | 11.2B | -3.4M |
| EBIT | 2.5B | -7.5M |
| Interest Expense | 953M | 0 |
| Net Income | -267M | -8.8M |
| EPS | -0.08 | -0.37 |
| Fiscal Year | 2025 | 2024 |
Income Statement Analysis: The Bottom-Line Duel
This income statement comparison reveals which company operates with superior profitability and operational efficiency in their respective markets.
Intel Corporation Analysis
Intel’s revenue declined slightly from 79B in 2021 to 53B in 2025, reflecting a long-term downward trend. Gross margin remains strong near 35%, showing resilient core production efficiency. However, net income swung from a 20B profit in 2021 to a slight 267M loss in 2025, highlighting profitability pressures. The latest year shows improving EBIT margin and narrowing net losses, signaling tentative operational momentum.
CEVA, Inc. Analysis
CEVA’s revenue increased steadily from 100M in 2020 to 107M in 2024, a modest growth path. It boasts a high gross margin above 88%, demonstrating excellent cost control on direct expenses. Yet, persistent operating losses and a negative EBIT margin around -7% reflect ongoing challenges in scaling profitably. The 2024 year shows improving EBIT and net margin, suggesting early signs of operational leverage.
Margin Strength vs. Scale Challenges
Intel commands scale with revenues 500x larger than CEVA but faces pressure on net profitability despite solid gross margins. CEVA excels in gross margin and growing revenue but struggles with consistent net profitability. Intel’s profile suits investors prioritizing scale with improving earnings momentum, while CEVA appeals to those focused on margin efficiency amid growth hurdles.
Financial Ratios Comparison
These vital ratios act as a diagnostic tool to expose the underlying fiscal health, valuation premiums, and capital efficiency of these companies:
| Ratios | Intel Corporation (INTC) | CEVA, Inc. (CEVA) |
|---|---|---|
| ROE | -0.23% | -3.30% |
| ROIC | -0.02% | -2.68% |
| P/E | -658.4 | -84.8 |
| P/B | 1.54 | 2.79 |
| Current Ratio | 2.02 | 7.09 |
| Quick Ratio | 1.65 | 7.09 |
| D/E (Debt-to-Equity) | 0.41 | 0.02 |
| Debt-to-Assets | 22.0% | 1.8% |
| Interest Coverage | -2.23 | 0 (no coverage) |
| Asset Turnover | 0.25 | 0.35 |
| Fixed Asset Turnover | 0.50 | 8.43 |
| Payout Ratio | 0 | 0 |
| Dividend Yield | 0 | 0 |
| Fiscal Year | 2025 | 2024 |
Efficiency & Valuation Duel: The Vital Signs
Financial ratios act as the company’s DNA, revealing hidden risks and operational strengths beyond headline numbers.
Intel Corporation
Intel shows negative returns on equity and invested capital, signaling weak profitability. Its P/E ratio is negative but considered favorable due to accounting losses. The company maintains a solid current ratio of 2.02, indicating liquidity strength. Intel pays no dividends, focusing capital on heavy R&D investment, which accounts for over 26% of revenue, aiming for future growth.
CEVA, Inc.
CEVA suffers from deep losses with ROE at -3.3% and a high WACC of 10.47%, reflecting expensive capital. The P/E ratio is negative but flagged as favorable, likely due to valuation mechanics. CEVA’s current ratio is exceptionally high at 7.09, which may indicate excess liquidity or inefficient capital use. It pays no dividends, reinvesting heavily in R&D at nearly 67% of revenue.
Valuation Discipline vs. Operational Struggles
Both companies face profitability challenges, but Intel’s slightly better liquidity and capital structure contrast with CEVA’s stretched operational metrics and higher cost of capital. Intel fits investors valuing stable liquidity and reinvestment in innovation, while CEVA suits those betting on turnaround potential despite higher risks.
Which one offers the Superior Shareholder Reward?
Intel Corporation (INTC) and CEVA, Inc. (CEVA) offer contrasting shareholder returns. Intel pays a modest dividend yield around 1.8% in 2025 with no recent buybacks and negative free cash flow, raising sustainability concerns. CEVA pays no dividends but reinvests aggressively in R&D, reflected by near-zero free cash flow and no buybacks. Intel’s dividend is modest but backed by a stronger balance sheet, while CEVA’s growth focus lacks immediate shareholder payouts. I conclude Intel offers a more attractive total return profile in 2026 due to its dividend, financial leverage, and capital allocation discipline, despite short-term profit setbacks.
Comparative Score Analysis: The Strategic Profile
The radar chart reveals the fundamental DNA and trade-offs of Intel Corporation and CEVA, Inc., highlighting their financial strengths and vulnerabilities:
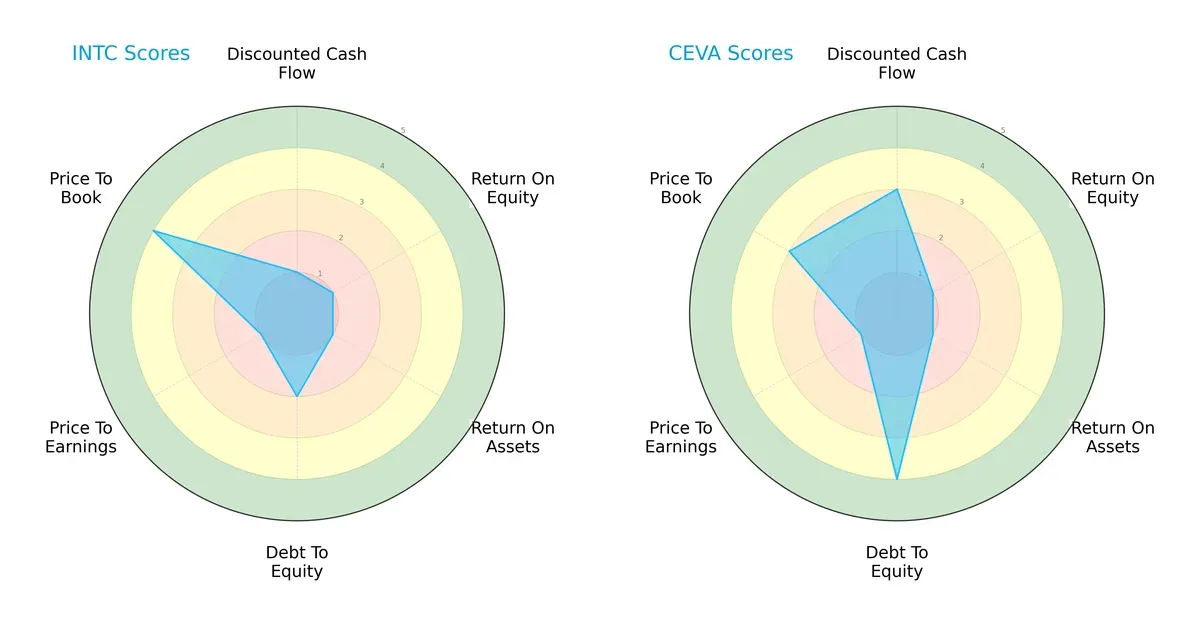
Intel shows a more conservative debt profile but struggles with cash flow and profitability metrics, scoring very low on DCF, ROE, and ROA. CEVA leverages a stronger discounted cash flow score and superior debt-to-equity management but shares Intel’s weak profitability scores. CEVA’s profile is more balanced due to its favorable leverage, whereas Intel relies heavily on its price-to-book valuation as a relative strength.
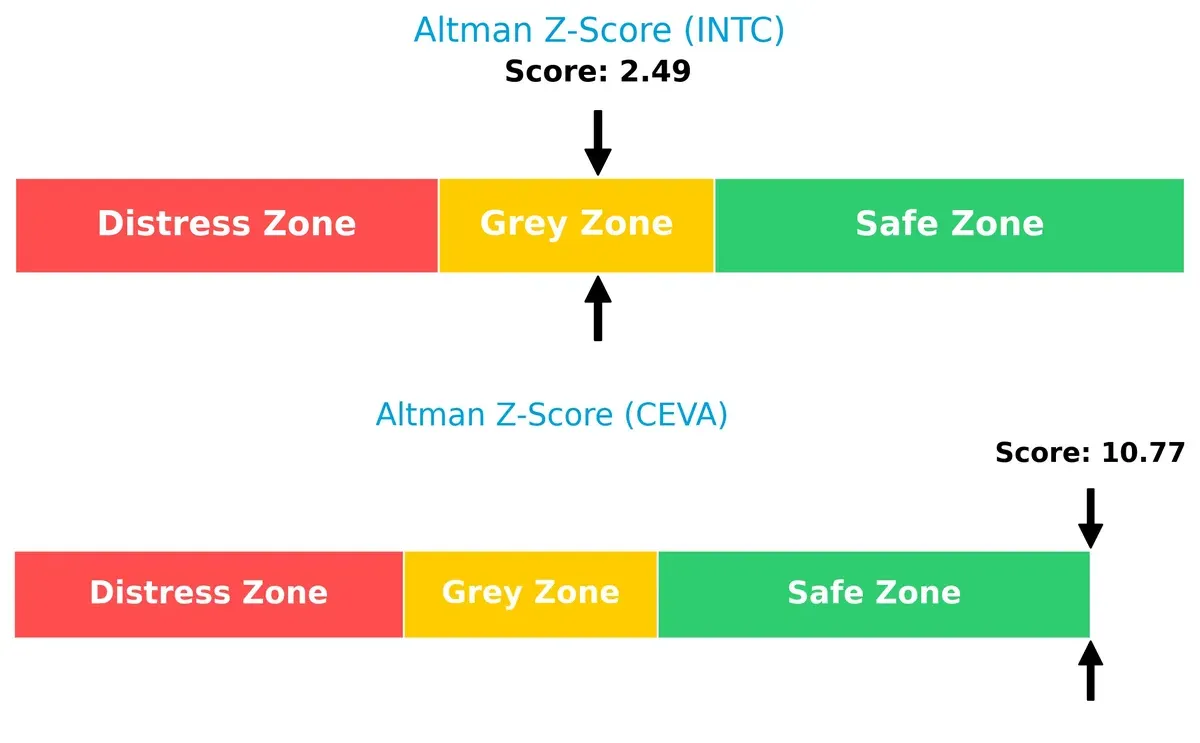
Bankruptcy Risk: Solvency Showdown
Intel’s Altman Z-Score sits in the grey zone at 2.49, signaling moderate bankruptcy risk. CEVA’s score of 10.77 places it firmly in the safe zone, implying stronger long-term solvency and resilience in this market cycle:
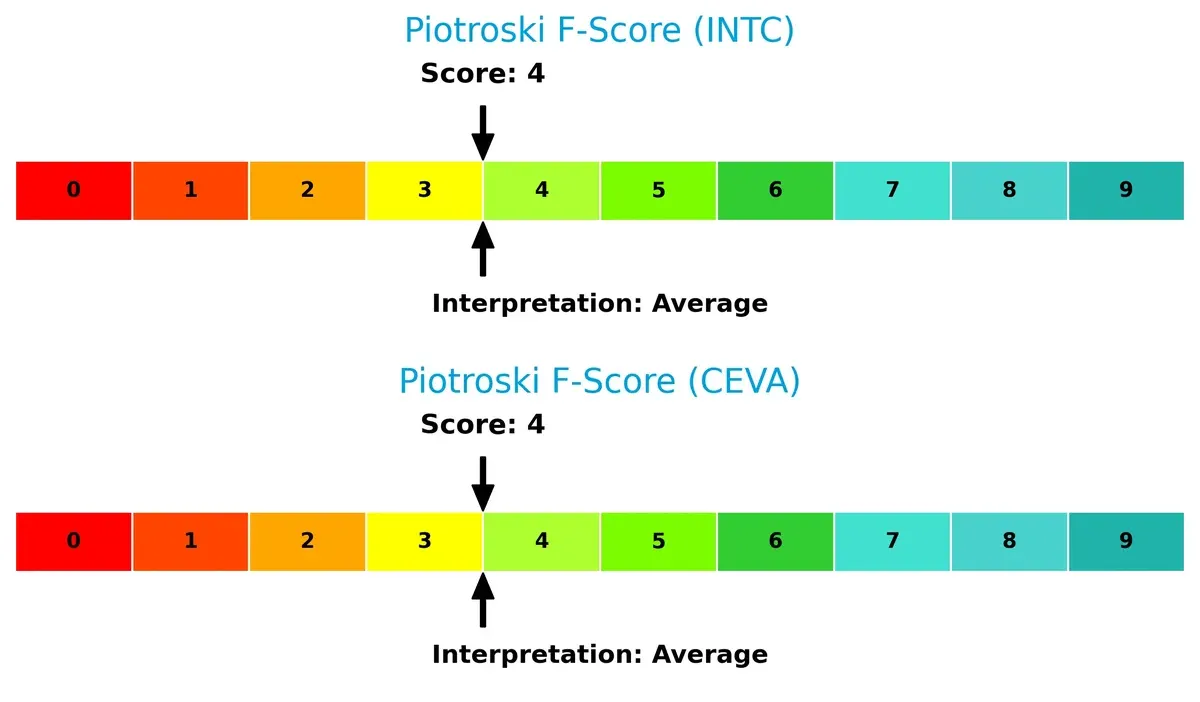
Financial Health: Quality of Operations
Both Intel and CEVA have average Piotroski F-Scores of 4, indicating moderate financial health. Neither company shows peak operational strength, and investors should watch for potential internal weaknesses reflected in these middling scores:
How are the two companies positioned?
This section dissects the operational DNA of Intel and CEVA by comparing their revenue distribution by segment and internal dynamics. The goal is to confront their economic moats and identify which model offers the most resilient, sustainable competitive advantage today.
Revenue Segmentation: The Strategic Mix
This visual comparison dissects how Intel Corporation and CEVA, Inc. diversify their income streams and where their primary sector bets lie:
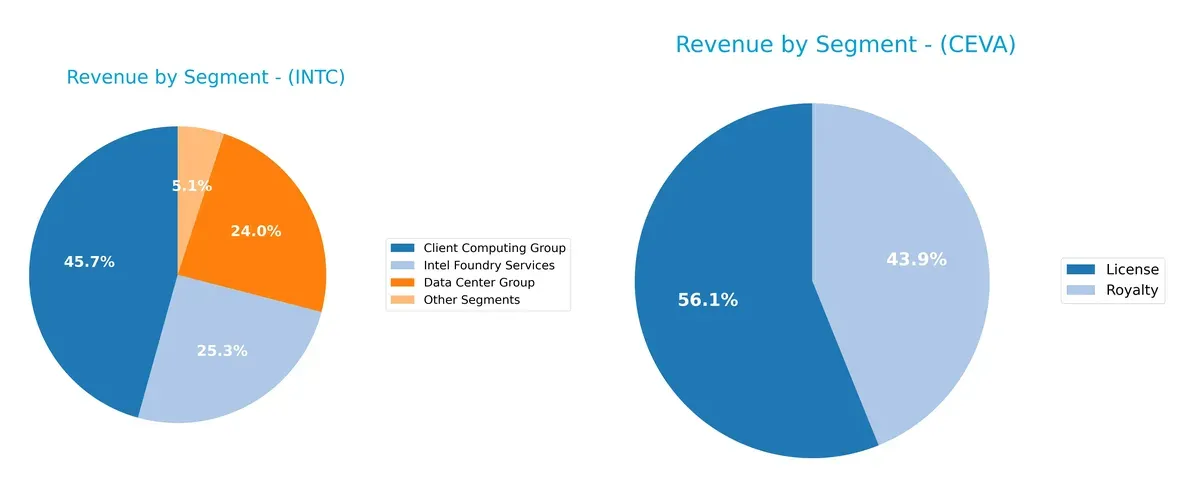
Intel dominates with a broad portfolio: in 2025, Client Computing Group anchors $32.2B, Intel Foundry Services holds $17.8B, and Data Center Group delivers $16.9B. CEVA leans heavily on two segments—License ($60M) and Royalty ($47M) in 2024—showing far less diversification. Intel’s mix reduces concentration risk, supporting ecosystem lock-in and infrastructure dominance. CEVA’s reliance on licensing exposes it to market cyclicality and competitive pressure.
Strengths and Weaknesses Comparison
This table compares the strengths and weaknesses of Intel Corporation and CEVA, Inc.:
Intel Corporation Strengths
- Diversified product segments including Client Computing, Data Center, and Foundry Services
- Strong global presence with significant revenue from the U.S., Singapore, and Taiwan
- Favorable liquidity ratios with current ratio at 2.02 and quick ratio at 1.65
- Moderate leverage with debt-to-assets at 22.03%
CEVA, Inc. Strengths
- Focused product lines in Connectivity and Smart Sensing Products
- Favorable fixed asset turnover at 8.43 indicating efficient asset use
- Low debt-to-assets ratio at 1.8% signaling low financial risk
- Favorable quick ratio at 7.09 reflecting strong short-term liquidity
Intel Corporation Weaknesses
- Negative profitability metrics: net margin -0.51%, ROE -0.23%, ROIC -0.02%
- Unfavorable asset turnover ratios indicating lower efficiency
- Neutral interest coverage ratio at 2.63 may limit debt servicing ability
- No dividend yield, reducing income appeal
CEVA, Inc. Weaknesses
- More negative profitability with net margin -8.22%, ROE -3.3%, ROIC -2.68%
- Unfavorable weighted average cost of capital (WACC) at 10.47%
- Current ratio at 7.09 flagged as unfavorable, possibly indicating inefficient working capital management
- Interest coverage at 0 suggests difficulty covering interest expenses
- Negative asset turnover despite strong fixed asset turnover
Intel’s broad diversification and global footprint support resilience but face profitability and efficiency challenges. CEVA’s strengths lie in focused innovation and low leverage, yet profitability and working capital management remain significant concerns. These factors shape each company’s strategic priorities going forward.
The Moat Duel: Analyzing Competitive Defensibility
A structural moat protects long-term profits from relentless competitive pressure and market disruption. Here’s how Intel and CEVA stack up:
Intel Corporation: Scale and Platform Moat
Intel’s competitive edge stems from its massive scale and integrated platform products. Despite a declining ROIC below WACC, its dominant market position supports gross margin stability near 35%. Expansion into AI and autonomous driving in 2026 could deepen this moat if execution improves.
CEVA, Inc.: IP Licensing and Innovation Moat
CEVA relies on unique wireless connectivity and DSP intellectual property, licensing to diverse OEMs. Unlike Intel’s scale, CEVA’s moat is narrower but innovation-driven. Its high gross margin (88%) reflects pricing power, though negative EBIT signals profitability challenges. Growth in AI and 5G could widen its moat if profitability stabilizes.
Verdict: Scale Dominance vs. Specialized IP Licensing
Intel’s scale platform moat is wider but currently eroding due to declining ROIC and profitability. CEVA’s moat is narrower and innovation-dependent, with stronger margin potential but weaker earnings. Intel remains better positioned to defend market share if it reverses value destruction trends.
Which stock offers better returns?
The past year reveals Intel’s sustained price gains and accelerating momentum, contrasting sharply with CEVA’s declining trend and increased selling pressure.
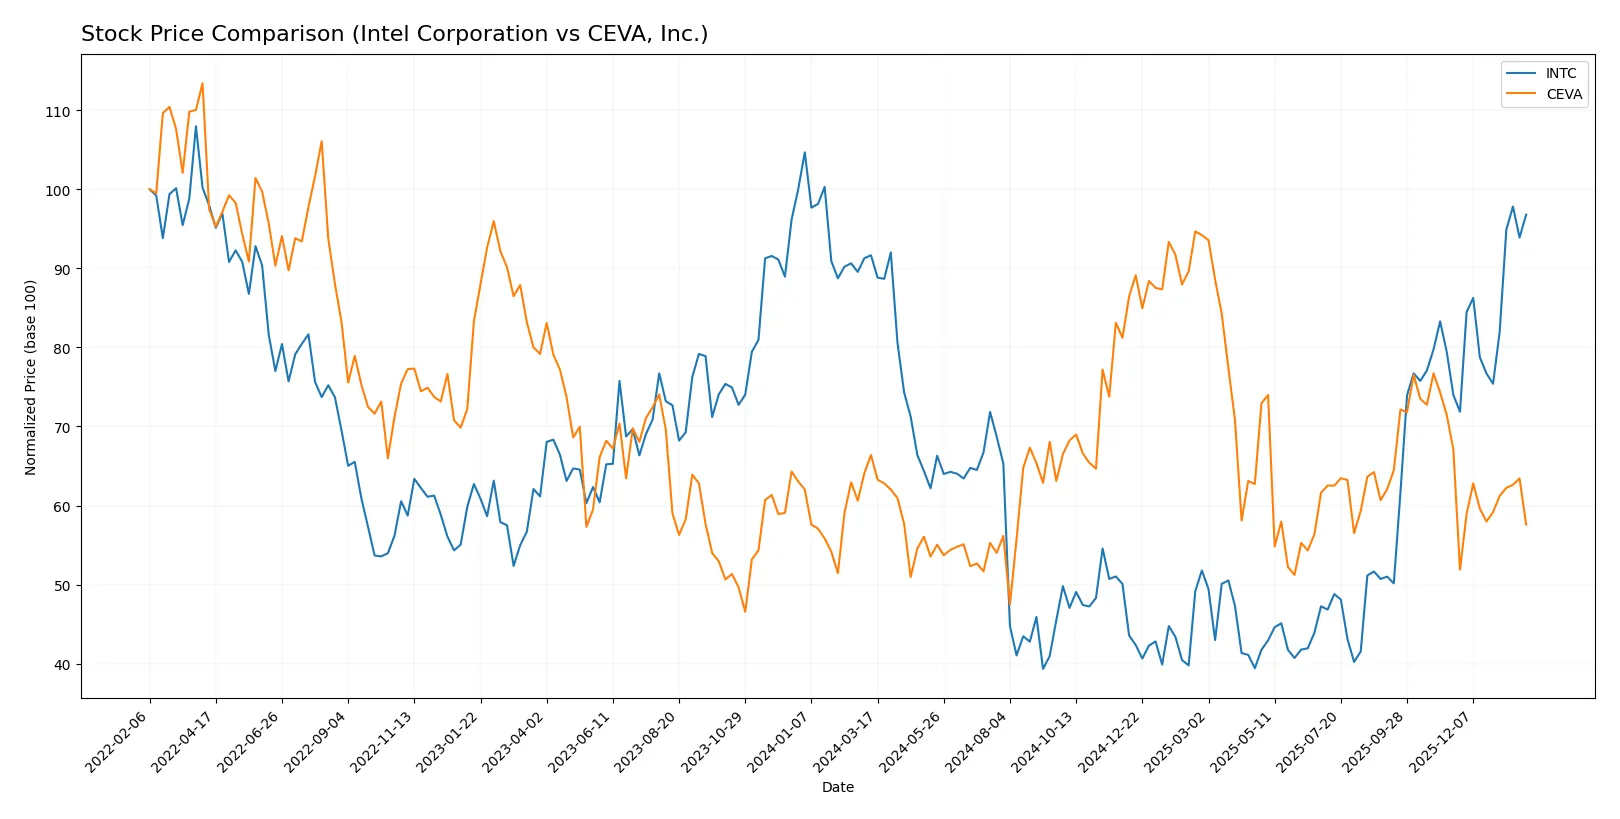
Trend Comparison
Intel’s stock shows a bullish trend over the past 12 months, with a 5.61% price increase and accelerating momentum despite a high 8.11 volatility. The price peaked at 46.96 and bottomed at 18.89.
CEVA’s stock records a bearish trend over the same period, dropping 13.25% with accelerating downside volatility of 4.4. The share price ranged between 34.67 and 17.39, reflecting clear weakness.
Intel outperformed CEVA decisively, delivering positive gains while CEVA declined. Intel’s trend strength and acceleration mark it as the stronger performer.
Target Prices
Analysts present a mixed but generally optimistic target consensus for Intel Corporation and CEVA, Inc.
| Company | Target Low | Target High | Consensus |
|---|---|---|---|
| Intel Corporation | 20 | 66 | 46.95 |
| CEVA, Inc. | 28 | 28 | 28 |
Intel’s consensus target of 46.95 slightly exceeds its current price of 46.47, suggesting modest upside. CEVA’s single target at 28 implies a roughly 33% potential gain from its 21.09 price.

Don’t Let Luck Decide Your Entry Point
Optimize your entry points with our advanced ProRealTime indicators. You’ll get efficient buy signals with precise price targets for maximum performance. Start outperforming now!
How do institutions grade them?
The institutional grades for Intel Corporation and CEVA, Inc. are as follows:
Intel Corporation Grades
Here are the recent grades issued by major institutional analysts for Intel Corporation:
| Grading Company | Action | New Grade | Date |
|---|---|---|---|
| RBC Capital | Maintain | Sector Perform | 2026-01-23 |
| Keybanc | Maintain | Overweight | 2026-01-23 |
| Evercore ISI Group | Maintain | In Line | 2026-01-23 |
| Needham | Maintain | Hold | 2026-01-23 |
| Benchmark | Maintain | Buy | 2026-01-23 |
| Rosenblatt | Maintain | Sell | 2026-01-23 |
| UBS | Maintain | Neutral | 2026-01-23 |
| Citigroup | Maintain | Neutral | 2026-01-23 |
| Stifel | Maintain | Hold | 2026-01-23 |
| Wedbush | Maintain | Neutral | 2026-01-23 |
CEVA, Inc. Grades
Below are the recent institutional grades for CEVA, Inc. from recognized analysts:
| Grading Company | Action | New Grade | Date |
|---|---|---|---|
| Barclays | Maintain | Overweight | 2025-11-12 |
| Rosenblatt | Maintain | Buy | 2025-11-11 |
| Rosenblatt | Maintain | Buy | 2025-08-14 |
| Oppenheimer | Maintain | Outperform | 2025-05-09 |
| Rosenblatt | Maintain | Buy | 2025-05-08 |
| Barclays | Maintain | Overweight | 2025-05-08 |
| Rosenblatt | Maintain | Buy | 2025-04-23 |
| Barclays | Maintain | Overweight | 2025-02-14 |
| Rosenblatt | Maintain | Buy | 2025-02-14 |
| Rosenblatt | Maintain | Buy | 2025-02-11 |
Which company has the best grades?
CEVA, Inc. consistently receives positive grades like Buy, Overweight, and Outperform. Intel’s grades range widely, including Buy and Sell opinions. CEVA’s stronger consensus may indicate higher analyst confidence.
Risks specific to each company
The following categories identify the critical pressure points and systemic threats facing both firms in the 2026 market environment:
1. Market & Competition
Intel Corporation
- Faces intense competition from global semiconductor giants, pressuring margins and innovation cycles.
CEVA, Inc.
- Operates in a niche licensing market but faces competition in AI and connectivity IP from larger players.
2. Capital Structure & Debt
Intel Corporation
- Maintains moderate leverage with a debt-to-assets ratio of 22%, manageable but interest coverage is only neutral.
CEVA, Inc.
- Very low debt levels and minimal financial risk, but interest coverage ratio at zero signals potential liquidity concerns.
3. Stock Volatility
Intel Corporation
- Beta of 1.35 indicates higher volatility than the market, reflecting sensitivity to tech sector cycles.
CEVA, Inc.
- Beta of 1.44 shows even greater stock price swings, typical for small-cap tech firms with lower liquidity.
4. Regulatory & Legal
Intel Corporation
- Subject to global antitrust scrutiny and export controls, especially in AI and chip manufacturing sectors.
CEVA, Inc.
- Faces fewer regulatory hurdles, but licensing agreements could be impacted by IP laws and international trade policies.
5. Supply Chain & Operations
Intel Corporation
- Large-scale manufacturing dependent on complex supply chains vulnerable to geopolitical tensions and component shortages.
CEVA, Inc.
- Relies on licensees’ manufacturing; less operational risk but dependent on partners’ supply chain stability.
6. ESG & Climate Transition
Intel Corporation
- Increasing pressure to reduce carbon footprint in manufacturing; heavy investments required for sustainable operations.
CEVA, Inc.
- Smaller footprint; ESG risks lower but must align IP development with evolving eco-friendly standards.
7. Geopolitical Exposure
Intel Corporation
- High exposure due to global manufacturing and sales, especially China-US trade tensions.
CEVA, Inc.
- Limited direct exposure but vulnerable through licensees operating in geopolitically sensitive regions.
Which company shows a better risk-adjusted profile?
Intel’s most pressing risk is its competitive pressure combined with operational complexity and geopolitical exposure. CEVA’s greatest risk lies in its fragile financials and zero interest coverage, despite low debt. Intel’s large scale and moderate leverage offer a more balanced risk profile. CEVA’s high volatility and financial fragility heighten investment risk. Intel’s Altman Z-Score in the grey zone contrasts with CEVA’s safe zone, but Intel’s operational and competitive risks justify cautious optimism.
Final Verdict: Which stock to choose?
Intel Corporation’s superpower lies in its scale and robust cash position, enabling strategic investments in R&D and manufacturing capacity. However, its declining profitability and value destruction remain points of vigilance. Intel suits portfolios aiming for established tech exposure with a tolerance for cyclical recovery risk.
CEVA, Inc. offers a strategic moat through its specialized semiconductor IP and low financial leverage, providing a nimble platform for innovation. Relative to Intel, CEVA appears riskier but offers a leaner balance sheet. It fits growth-at-a-reasonable-price (GARP) portfolios seeking niche tech plays with higher volatility.
If you prioritize scale with potential for a turnaround, Intel outshines due to its resource depth and market presence. However, if you seek exposure to focused semiconductor innovation with a tighter balance sheet, CEVA offers better stability in a smaller package. Both demand caution given persistent value erosion.
Disclaimer: Investment carries a risk of loss of initial capital. The past performance is not a reliable indicator of future results. Be sure to understand risks before making an investment decision.
Go Further
I encourage you to read the complete analyses of Intel Corporation and CEVA, Inc. to enhance your investment decisions: