In the fast-evolving semiconductor industry, two leading companies, Intel Corporation (INTC) and Arm Holdings plc (ARM), stand at the forefront of innovation. Both are pivotal in shaping technology, yet they adopt distinct strategies to capture market share. Intel focuses on manufacturing and selling a broad range of computer products, while Arm specializes in designing semiconductor technology for licensing. As an investor, understanding their differences and potential can guide your investment decisions. Let’s explore which company may be the more compelling choice for your portfolio.
Table of contents
Company Overview
Intel Corporation Overview
Intel Corporation, a stalwart in the semiconductor industry, operates on a mission to design and manufacture innovative computer technologies worldwide. With a robust market capitalization of approximately $178.4B, Intel has established itself as a leader in computing solutions. The company’s diverse portfolio includes central processing units (CPUs), chipsets, and memory products, navigating through various segments such as Data Center Group and Internet of Things Group. Intel’s strategic partnerships, such as its collaboration with MILA in artificial intelligence, underscore its commitment to advancing technology across multiple verticals, including healthcare and autonomous driving. Founded in 1968 and headquartered in Santa Clara, California, Intel employs around 108.9K individuals and remains a key player in both consumer and enterprise markets.
Arm Holdings plc Overview
Arm Holdings plc specializes in the architecture, development, and licensing of central processing unit products and related technologies. With a market capitalization of about $142.7B, Arm’s influence extends across various sectors, including automotive, consumer technologies, and the Internet of Things (IoT). The company primarily licenses its advanced microprocessor designs to semiconductor manufacturers and original equipment manufacturers, facilitating the creation of innovative products globally. Established in 1990 and based in Cambridge, UK, Arm employs approximately 8.3K people and recently went public in September 2023. Its focus on system intellectual property and software tools positions Arm as a critical enabler of next-generation technology.
Key similarities and differences
Both Intel and Arm operate within the semiconductor industry, focusing on the design and development of processing technologies. While Intel primarily manufactures and sells its products directly, Arm’s business model centers on licensing its technology to partners, allowing for greater scalability in diverse markets. Intel’s extensive product line contrasts with Arm’s emphasis on architectural solutions, showcasing differing approaches to capturing market share in a rapidly evolving technological landscape.
Income Statement Comparison
Below is a comparison of the most recent income statements for Intel Corporation (INTC) and Arm Holdings plc (ARM), showcasing key financial metrics.
| Metric | Intel Corporation (INTC) | Arm Holdings plc (ARM) |
|---|---|---|
| Market Cap | 178.38B | 142.68B |
| Revenue | 53.10B | 4.01B |
| EBITDA | 1.20B | 902.90M |
| EBIT | -10.18B | 720.00M |
| Net Income | -18.76B | 792.00M |
| EPS | -4.38 | 0.75 |
| Fiscal Year | 2024 | 2025 |
Interpretation of Income Statement
The income statements reveal stark contrasts between Intel and Arm. Intel’s revenue has seen a decline from previous years, resulting in a significant net loss of 18.76B in 2024, indicative of ongoing operational challenges. In contrast, Arm has shown growth, with revenue increasing to 4.01B in 2025 and a net income of 792M. The gross margins for Arm are stable, while Intel faces declining margins, raising concerns about its long-term profitability. Overall, Arm’s performance reflects a healthier financial position, while Intel’s struggles underscore the importance of robust risk management and strategic adjustments.
Financial Ratios Comparison
The following table summarizes the most recent revenue and key financial ratios for Intel Corporation (INTC) and Arm Holdings plc (ARM). This comparative analysis will assist investors in evaluating the financial health and performance of these companies.
| Metric | Intel Corporation (INTC) | Arm Holdings plc (ARM) |
|---|---|---|
| ROE | -18.89% | 11.58% |
| ROIC | -12.18% | 11.31% |
| P/E | 124.66 | 141.58 |
| P/B | 1.99 | 16.40 |
| Current Ratio | 1.54 | 5.20 |
| Quick Ratio | 1.15 | 5.20 |
| D/E | 0.47 | 0.05 |
| Debt-to-Assets | 0.26 | 0.04 |
| Interest Coverage | 0.11 | 0 |
| Asset Turnover | 0.28 | 0.45 |
| Fixed Asset Turnover | 0.56 | 5.61 |
| Payout ratio | 1.83 | 0 |
| Dividend yield | 1.47% | 0% |
Interpretation of Financial Ratios
Intel’s negative return ratios (ROE and ROIC) raise concerns about its profitability and capital efficiency. In contrast, Arm’s strong ROE and low debt levels indicate financial stability and effective management. However, both companies exhibit high P/E ratios, suggesting potential overvaluation. Investors should weigh these factors carefully and consider the inherent risks, particularly in the tech sector.
Dividend and Shareholder Returns
Intel Corporation (INTC) pays dividends with a recent yield of 1.84% and a payout ratio of approximately 18%. However, the company’s financial struggles, reflected in negative net margins, raise concerns about sustainability. Meanwhile, Arm Holdings (ARM) does not distribute dividends, focusing instead on reinvesting profits for growth. This aligns with its high growth phase and strategic R&D investments. Both companies engage in share buybacks, which could bolster shareholder value. Overall, Intel’s dividends may be at risk, while Arm’s approach emphasizes long-term value creation through reinvestment.
Strategic Positioning
Intel Corporation (INTC) holds a significant market share in the semiconductor industry, leveraging its diverse product lines, including CPUs and high-performance compute solutions. However, it faces intense competitive pressure from Arm Holdings (ARM), which specializes in CPU architecture and licensing, essential for various technology sectors. Arm’s innovative approach and strong foothold in mobile and IoT markets present a technological disruption challenge for Intel. As both companies navigate this dynamic landscape, careful evaluation of their strategic positions will be crucial for investors.
Stock Comparison
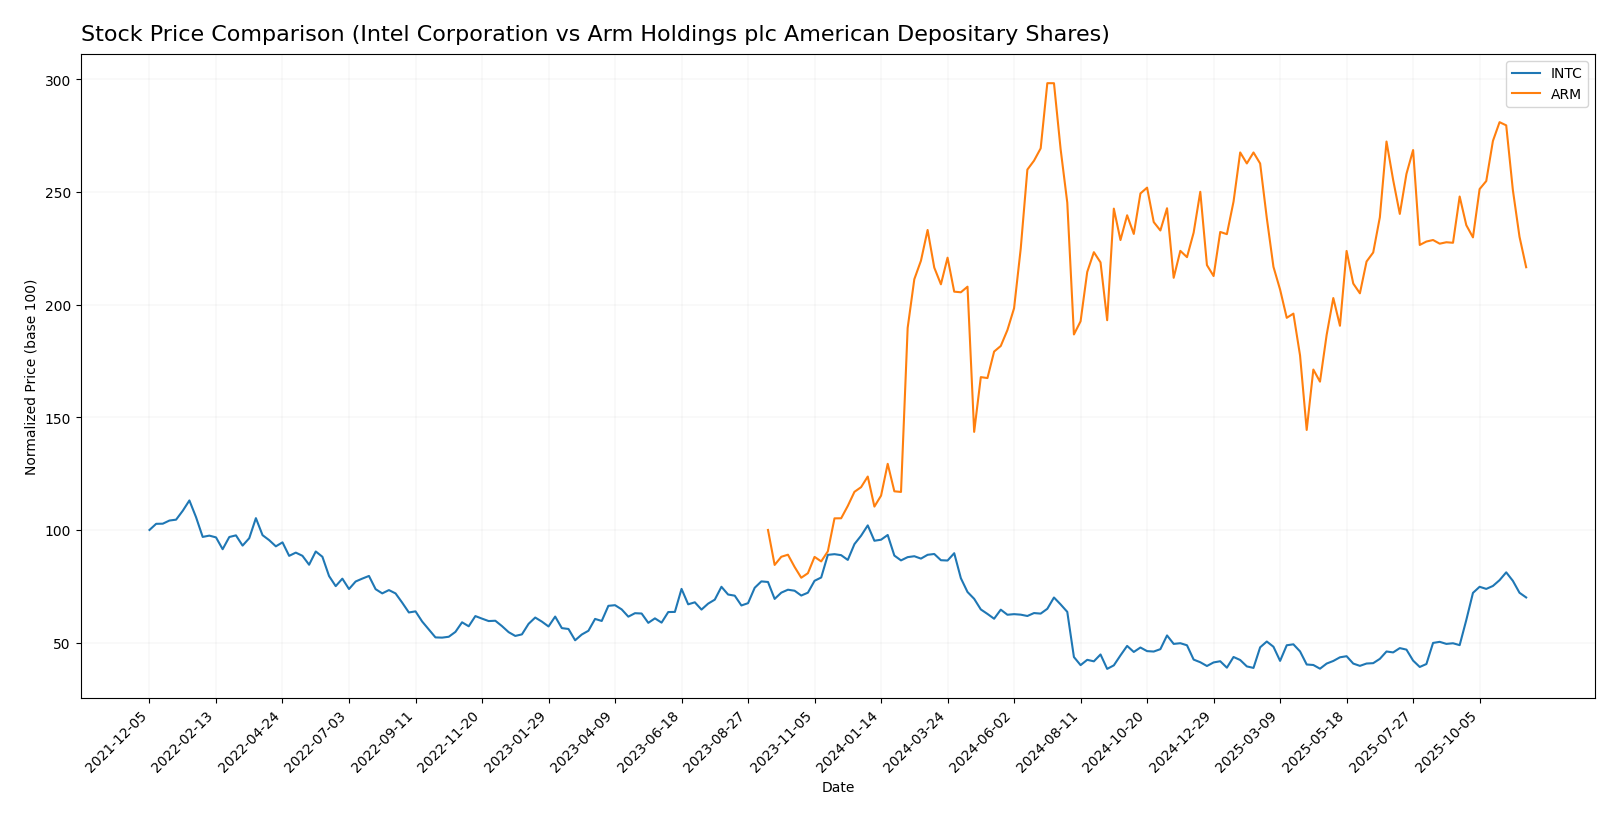
Over the past year, Intel Corporation (INTC) and Arm Holdings plc (ARM) have exhibited notable price movements and trading dynamics, reflecting their respective market positions and investor sentiment.
Trend Analysis
Intel Corporation (INTC) Over the past year, INTC has experienced a price change of -13.5%, indicating a bearish trend. The stock has shown acceleration in this downward movement, with notable highs of 48.15 and lows of 18.89. The standard deviation of 8.53 suggests a moderate level of volatility in its price movements.
In the recent analysis period from September 14, 2025, to November 30, 2025, INTC’s price surged by 68.44%, reflecting a strong short-term recovery despite the overall bearish trend. The trend slope of 0.85 indicates a positive upward movement during this phase, though it is essential to approach this with caution due to the broader negative performance.
Arm Holdings plc (ARM) ARM’s stock has seen a substantial price change of +102.18% over the past year, marking a bullish trend. However, the trend is currently experiencing deceleration. The highest price reached was 181.19, while the lowest was 67.05, with a standard deviation of 23.44, indicating significant volatility.
In contrast, during the recent period from September 14, 2025, to November 30, 2025, ARM’s price declined by 10.01%. This recent downturn suggests a shift in momentum, as indicated by the negative trend slope of -0.76. The current market behavior requires careful monitoring given the recent volatility and changing investor sentiment.
Analyst Opinions
Recent analyst recommendations for Intel Corporation (INTC) suggest a cautious stance, with a rating of C+. Analysts cite concerns about the company’s return on equity and price-to-earnings ratios as key issues. In contrast, Arm Holdings plc (ARM) has garnered a more favorable B- rating, with analysts highlighting its strong return on assets and overall financial stability. The consensus for INTC remains a hold, while ARM appears more favorable, suggesting a buy for investors looking for growth in the tech sector.
Stock Grades
As we assess the latest stock ratings from reputable grading companies, we find a mix of perspectives on two prominent companies: Intel Corporation (INTC) and Arm Holdings plc (ARM).
Intel Corporation Grades
| Grading Company | Action | New Grade | Date |
|---|---|---|---|
| Tigress Financial | maintain | Buy | 2025-11-04 |
| Barclays | maintain | Equal Weight | 2025-10-27 |
| Morgan Stanley | maintain | Equal Weight | 2025-10-24 |
| Rosenblatt | maintain | Sell | 2025-10-24 |
| Truist Securities | maintain | Hold | 2025-10-24 |
| Wells Fargo | maintain | Equal Weight | 2025-10-24 |
| Wedbush | maintain | Neutral | 2025-10-24 |
| JP Morgan | maintain | Underweight | 2025-10-24 |
| TD Cowen | maintain | Hold | 2025-10-24 |
| Needham | maintain | Hold | 2025-10-24 |
Arm Holdings plc Grades
| Grading Company | Action | New Grade | Date |
|---|---|---|---|
| Loop Capital | maintain | Buy | 2025-11-12 |
| Benchmark | maintain | Hold | 2025-11-06 |
| Keybanc | maintain | Overweight | 2025-11-06 |
| Needham | maintain | Hold | 2025-11-06 |
| Mizuho | maintain | Outperform | 2025-11-06 |
| Barclays | maintain | Overweight | 2025-11-06 |
| UBS | maintain | Buy | 2025-11-06 |
| TD Cowen | maintain | Buy | 2025-11-06 |
| Rosenblatt | maintain | Buy | 2025-11-06 |
| JP Morgan | maintain | Overweight | 2025-11-06 |
Overall, Intel’s grades show a cautious but stable sentiment with a mix of “Buy,” “Hold,” and “Sell” recommendations. In contrast, Arm Holdings enjoys a more favorable outlook, predominantly rated as “Buy” or “Overweight,” indicating strong investor confidence in its performance.
Target Prices
The consensus target prices for Intel Corporation and Arm Holdings indicate optimistic outlooks from analysts.
| Company | Target High | Target Low | Consensus |
|---|---|---|---|
| Intel Corporation (INTC) | 52 | 20 | 35.22 |
| Arm Holdings plc (ARM) | 210 | 190 | 200 |
For Intel, the target consensus of 35.22 suggests room for growth compared to its current price of 40.56. In contrast, Arm’s target consensus of 200 presents significant upside potential against its current price of 135.11, reflecting strong analyst confidence.
Strengths and Weaknesses
The following table outlines the strengths and weaknesses of Intel Corporation (INTC) and Arm Holdings plc (ARM), based on the most recent financial data.
| Criterion | Intel Corporation (INTC) | Arm Holdings plc (ARM) |
|---|---|---|
| Diversification | Moderate (semiconductors) | High (various sectors) |
| Profitability | Low (-35.3% net margin) | High (19.8% net margin) |
| Innovation | Moderate (steady R&D) | High (leading in CPU tech) |
| Global presence | Strong (U.S. and global) | Strong (international) |
| Market Share | Moderate (semiconductor) | Growing (CPU market) |
| Debt level | Moderate (25.5% debt to assets) | Low (3.9% debt to assets) |
Key takeaways show that while Arm Holdings exhibits stronger profitability and lower debt levels, Intel maintains a significant global presence and diversified product lines. Investors should weigh these factors when considering their options.
Risk Analysis
The following table outlines key risks associated with each company, helping investors assess potential challenges.
| Metric | Intel Corporation (INTC) | Arm Holdings plc (ARM) |
|---|---|---|
| Market Risk | Medium | High |
| Regulatory Risk | High | Medium |
| Operational Risk | High | Medium |
| Environmental Risk | Medium | Low |
| Geopolitical Risk | Medium | High |
In summary, Intel faces significant operational and regulatory risks as it navigates a competitive semiconductor landscape. Arm, while showing strong profitability metrics, is susceptible to high market volatility and geopolitical tensions.
Which one to choose?
In comparing Intel Corporation (INTC) and Arm Holdings plc (ARM), both companies present unique investment opportunities. Intel has faced challenges, reflected in its recent bearish stock trend, with a price change of -13.5% year-on-year. Its C+ rating suggests moderate risk, highlighted by negative net profit margins and significant debt-to-equity ratio of 0.50. Conversely, Arm exhibits a bullish trend with a remarkable price increase of 102.18%. Its B- rating indicates better fundamentals, including a robust gross profit margin of 94.8% and lower debt-to-equity ratio of 0.05.
For growth-focused investors, Arm could be the preferable choice. Meanwhile, those seeking stability might lean toward Intel, despite its current struggles. However, investors should remain cautious of competition and market dependence risks inherent to both companies.
Disclaimer: This article is not financial advice. Each investor is responsible for their own investment decisions.
Go further
I encourage you to read the complete analyses of Intel Corporation and Arm Holdings plc American Depositary Shares to enhance your investment decisions:

