Home > Comparison > Technology > INTC vs ARM
The strategic rivalry between Intel Corporation and Arm Holdings plc shapes the future of the semiconductor industry. Intel operates as a capital-intensive technology giant, manufacturing a broad range of computing products. Arm, by contrast, excels as a high-margin intellectual property licensor specializing in CPU architecture. This analysis pits Intel’s manufacturing scale against Arm’s design innovation to identify which model offers superior risk-adjusted returns for a diversified portfolio.
Table of contents
Companies Overview
Intel Corporation and Arm Holdings plc stand as pivotal players shaping the semiconductor landscape globally.
Intel Corporation: Semiconductor Manufacturing Giant
Intel dominates as a semiconductor manufacturer with a vast portfolio including CPUs, chipsets, memory, and accelerators. Its core revenue derives from supplying platform and non-platform products to OEMs, cloud providers, and specialized markets like autonomous driving. In 2026, Intel sharpens its focus on high-performance compute solutions and AI partnerships, reinforcing its competitive edge in diverse verticals.
Arm Holdings plc: Chip Design Powerhouse
Arm leads as a semiconductor IP designer licensing microprocessors, GPUs, and software to manufacturers worldwide. Its revenue engine centers on providing architecture and system IPs that underpin consumer electronics, automotive, and IoT devices. In 2026, Arm prioritizes broadening its ecosystem reach and innovating system IP offerings to capitalize on expanding technology markets.
Strategic Collision: Similarities & Divergences
Intel follows a vertically integrated model, controlling both design and fabrication, while Arm thrives on an open licensing ecosystem. Their primary battle unfolds in CPU architecture dominance and AI-ready chip innovation. Intel’s capital-intensive manufacturing contrasts sharply with Arm’s scalable IP licensing, defining their distinct risk and growth profiles in semiconductor investing.
Income Statement Comparison
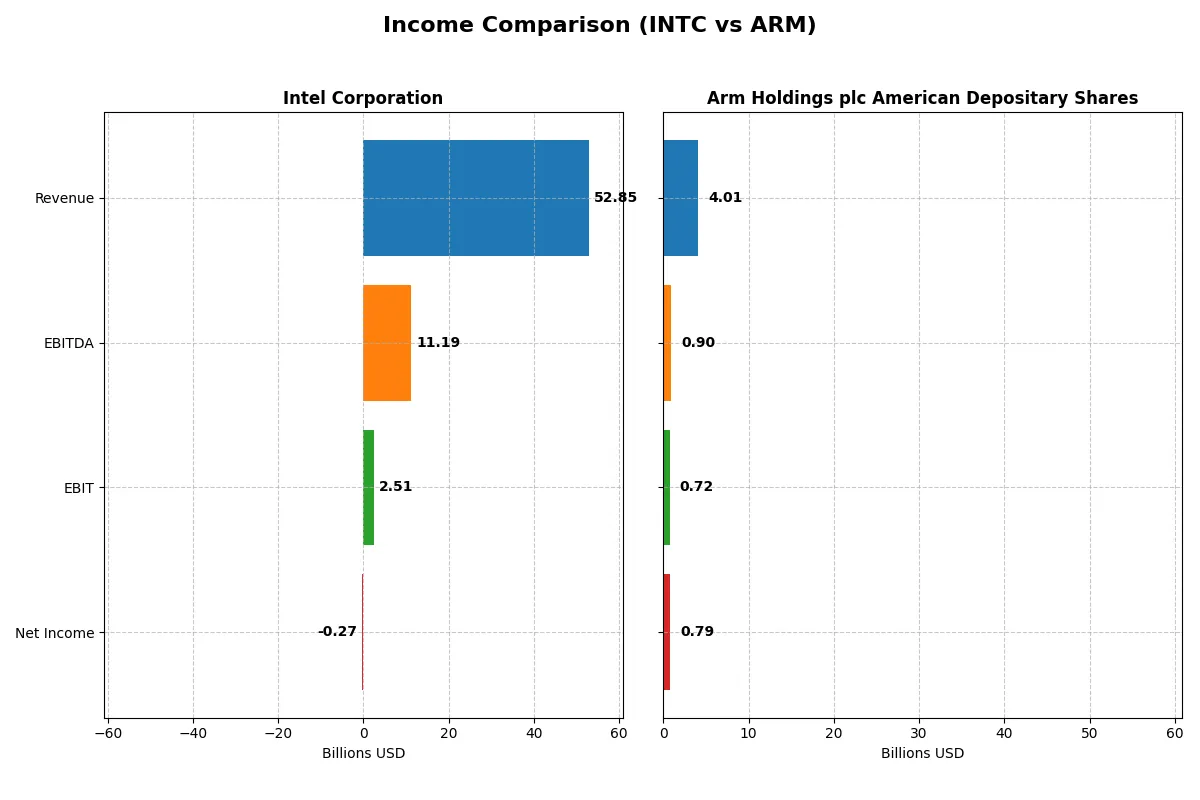
The following data dissects the core profitability and scalability of both corporate engines to reveal who dominates the bottom line:
| Metric | Intel Corporation (INTC) | Arm Holdings plc American Depositary Shares (ARM) |
|---|---|---|
| Revenue | 52.9B | 4.0B |
| Cost of Revenue | 34.4B | 206M |
| Operating Expenses | 20.6B | 2.97B |
| Gross Profit | 18.5B | 3.8B |
| EBITDA | 11.2B | 903M |
| EBIT | 2.51B | 720M |
| Interest Expense | 953M | 0 |
| Net Income | -267M | 792M |
| EPS | -0.08 | 0.75 |
| Fiscal Year | 2025 | 2025 |
Income Statement Analysis: The Bottom-Line Duel
The upcoming comparison reveals how each company’s revenue and profit margins translate into operational efficiency and financial resilience.
Intel Corporation Analysis
Intel’s revenue has declined from 79B in 2021 to 53B in 2025, showing a 33% drop over five years. Gross profit margins remain stable near 35%, but net income turned negative in 2024 and 2025, reflecting margin pressures and operational challenges. The 2025 net loss of 267M signals a fragile bottom line despite a modest EBIT rebound.
Arm Holdings plc American Depositary Shares Analysis
Arm’s revenue surged nearly 98% from 2B in 2021 to 4B in 2025, with gross margins exceeding 94%, demonstrating exceptional cost control. Net income more than doubled over the period, reaching 792M in 2025, supported by a strong EBIT margin near 18%. The company shows robust momentum and expanding profitability.
Margin Mastery vs. Scale Struggles
Arm dominates with superior margin expansion and consistent profit growth, while Intel struggles with shrinking revenue and negative net margins. Arm’s high efficiency and scalable model clearly outperform Intel’s eroding fundamentals. For investors, Arm’s profile offers stronger growth and margin sustainability amid competitive tech pressures.
Financial Ratios Comparison
These vital ratios act as a diagnostic tool to expose the underlying fiscal health, valuation premiums, and capital efficiency of these companies:
| Ratios | Intel Corporation (INTC) | Arm Holdings plc (ARM) |
|---|---|---|
| ROE | -0.23% | 11.58% |
| ROIC | -0.02% | 10.28% |
| P/E | -658.38 | 141.58 |
| P/B | 1.54 | 16.40 |
| Current Ratio | 2.02 | 5.20 |
| Quick Ratio | 1.65 | 5.20 |
| D/E | 0.41 | 0.05 |
| Debt-to-Assets | 22.03% | 3.99% |
| Interest Coverage | -2.23 | 0 |
| Asset Turnover | 0.25 | 0.45 |
| Fixed Asset Turnover | 0.50 | 5.61 |
| Payout ratio | 0 | 0 |
| Dividend yield | 0 | 0 |
| Fiscal Year | 2025 | 2025 |
Efficiency & Valuation Duel: The Vital Signs
Ratios act like a company’s DNA, revealing hidden risks and operational excellence crucial for investment decisions.
Intel Corporation
Intel shows negative returns on equity (-0.23%) and margins (-0.51%), signaling profitability struggles. Its P/E ratio is negative, reflecting losses but also implying potential undervaluation. The firm maintains a solid current ratio (2.02), indicating liquidity strength. Intel pays no dividends, focusing instead on significant R&D reinvestment (26% of revenue) for future growth.
Arm Holdings plc American Depositary Shares
Arm posts a strong net margin (19.77%) and moderate ROE (11.58%), demonstrating solid profitability. However, the stock trades at a stretched P/E of 141.58 and a high P/B of 16.4, suggesting premium valuation. Arm reports no dividends, reinvesting heavily in R&D (50% of revenue), emphasizing innovation over shareholder payouts.
Premium Valuation vs. Operational Safety
Arm commands a premium valuation with robust profitability but bears valuation risk. Intel faces profitability headwinds but offers operational liquidity and reinvestment discipline. Investors seeking growth and innovation may prefer Arm’s profile, while those prioritizing balance sheet safety might find Intel more fitting.
Which one offers the Superior Shareholder Reward?
Intel Corporation (INTC) currently pays a modest 1.84% dividend yield with a dividend payout ratio near zero, reflecting a recent suspension and uneven free cash flow (-1B FCF in 2025). Its buybacks appear minimal amid operational struggles and negative net margins. Conversely, Arm Holdings plc (ARM) pays no dividends but aggressively reinvests free cash flow (170M in 2025) into growth and R&D, supported by a robust 20% net margin and negligible debt. ARM’s buyback program is absent, but its capital allocation prioritizes sustainable long-term value creation. I find ARM’s reinvestment strategy more attractive for total shareholder return in 2026 given Intel’s cash flow weakness and dividend uncertainty.
Comparative Score Analysis: The Strategic Profile
The radar chart reveals the fundamental DNA and trade-offs of Intel Corporation and Arm Holdings plc American Depositary Shares:
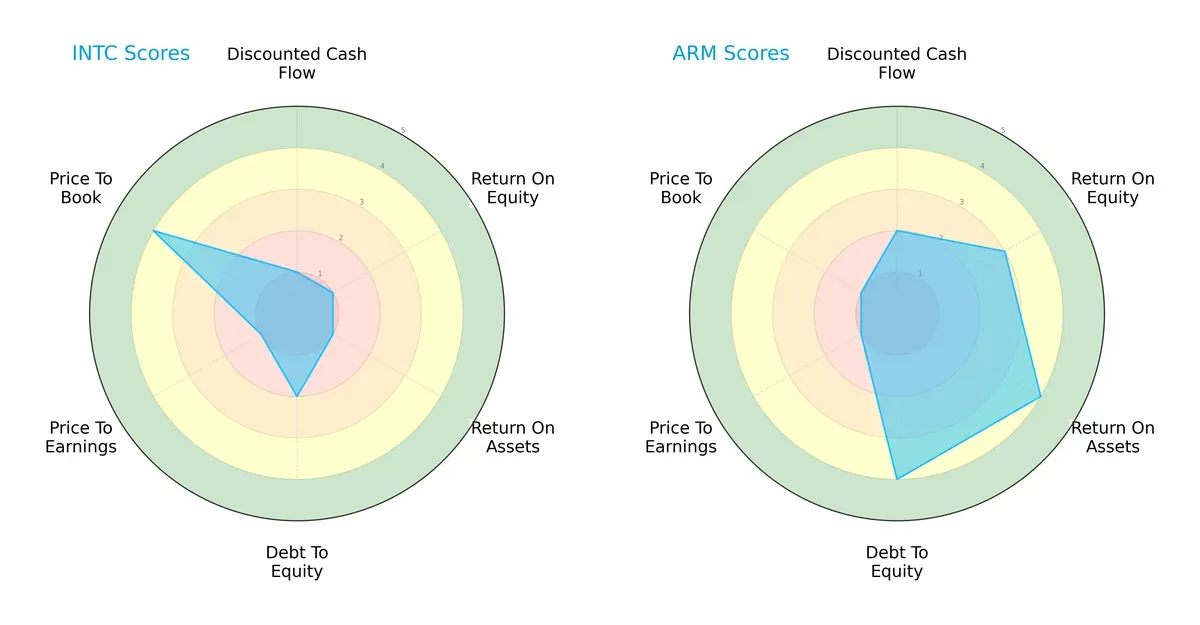
Arm displays a more balanced profile with moderate-to-favorable scores in DCF (2), ROE (3), ROA (4), and Debt/Equity (4). Intel leans heavily on a favorable Price-to-Book score (4) but suffers from weak profitability and valuation metrics. Arm’s diversified strengths suggest operational efficiency, while Intel depends on asset valuation advantage.
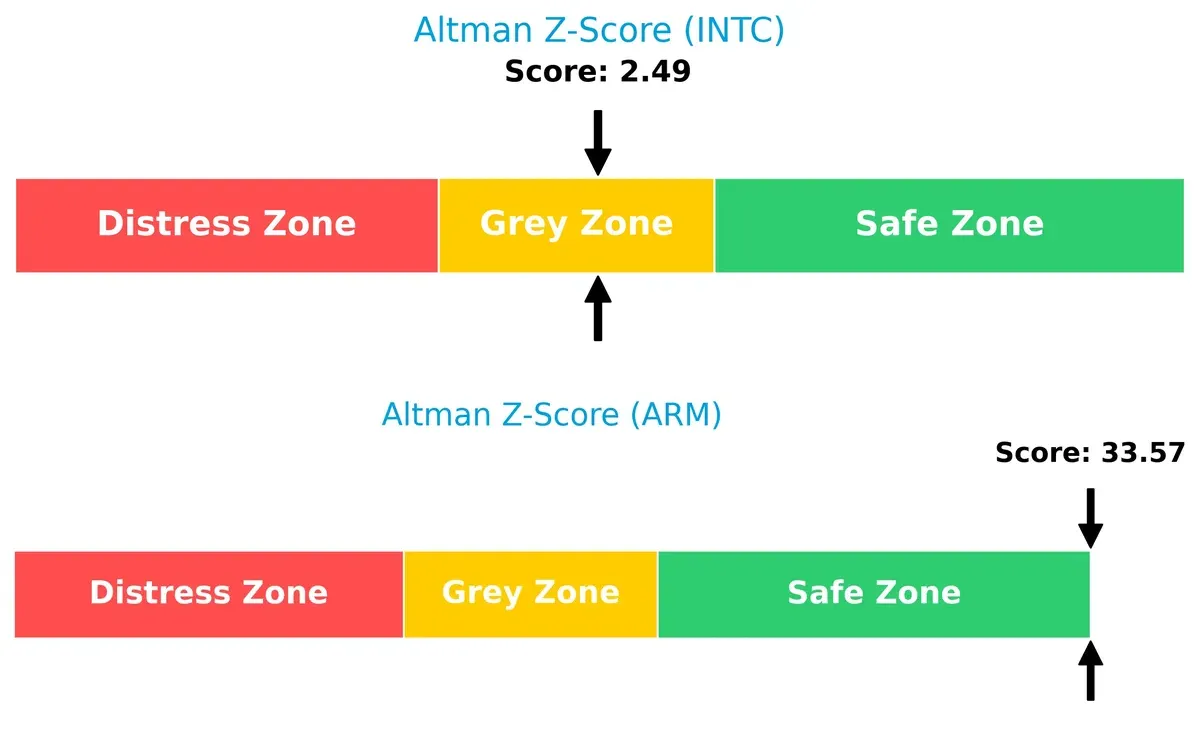
Bankruptcy Risk: Solvency Showdown
Intel’s Altman Z-Score of 2.49 places it in the grey zone, indicating moderate bankruptcy risk. Arm’s score of 33.57 signals a robust solvency position and very low default risk in this market cycle:
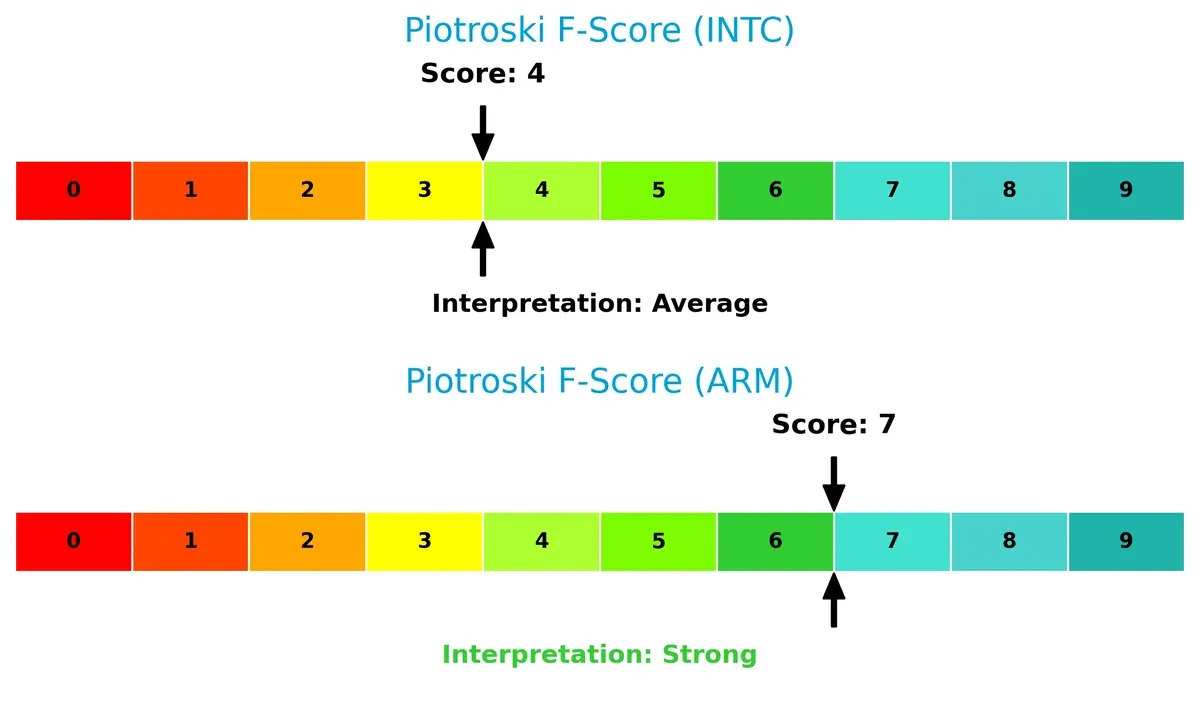
Financial Health: Quality of Operations
Arm outperforms Intel with a Piotroski F-Score of 7 versus 4. This signals Arm’s stronger internal financial health and operational quality, while Intel shows red flags worth monitoring for investors:
How are the two companies positioned?
This section dissects the operational DNA of Intel and Arm by comparing their revenue distribution by segment and internal dynamics—strengths and weaknesses. The goal is to confront their economic moats and identify which model offers the most resilient competitive advantage today.
Revenue Segmentation: The Strategic Mix
This visual comparison dissects how Intel Corporation and Arm Holdings diversify income streams and reveals their primary sector bets:
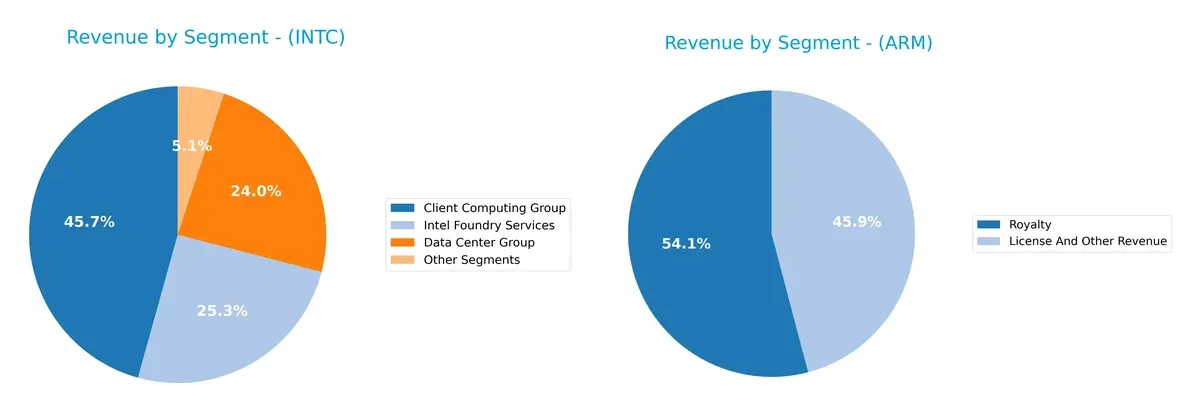
Intel’s 2025 revenue splits across Client Computing Group at $32.2B, Intel Foundry Services at $17.8B, and Data Center Group at $16.9B. Arm leans on two segments: Royalty at $2.2B and License and Other Revenue at $1.8B. Intel’s broader portfolio anchors its ecosystem lock-in and infrastructure dominance. Arm’s concentrated model pivots on intellectual property monetization but carries higher segment concentration risk.
Strengths and Weaknesses Comparison
This table compares the strengths and weaknesses of Intel Corporation and Arm Holdings plc American Depositary Shares:
Intel Corporation Strengths
- Diversified revenue streams across computing, data center, foundry, and IoT segments
- Strong global presence with significant US and Asia-Pacific sales
- Favorable liquidity ratios (current and quick)
- Moderate leverage with conservative debt-to-assets ratio
Arm Holdings Strengths
- High net margin indicating strong profitability
- Favorable interest coverage and low debt levels
- Efficient fixed asset turnover suggesting asset utilization
- Clear focus on licensing and royalty revenue supports stable cash flows
Intel Corporation Weaknesses
- Negative profitability metrics including net margin, ROE, and ROIC
- Low asset turnover ratios signal operational inefficiency
- Lack of dividend yield impacts income investors
- High intersegment eliminations complicate revenue clarity
Arm Holdings Weaknesses
- High weighted average cost of capital (WACC) raises capital costs
- Unfavorable price-to-earnings and price-to-book ratios suggest valuation concerns
- Weak current ratio signals potential liquidity risk
- ROIC below WACC questions capital allocation efficiency
Intel’s broad diversification and strong liquidity stand out, yet profitability challenges persist. Arm shows robust profitability and low leverage but faces valuation and capital cost headwinds. Both companies must address their weaknesses to sustain competitive positioning.
The Moat Duel: Analyzing Competitive Defensibility
A structural moat is the only barrier shielding long-term profits from relentless competitive erosion in the semiconductor industry:
Intel Corporation: Legacy Scale and Manufacturing Prowess
Intel’s moat stems from its massive manufacturing scale and integrated chip design. This advantage shows in its margin stability despite revenue pressures. However, declining ROIC signals erosion risks as new technologies and competitors emerge in 2026.
Arm Holdings plc American Depositary Shares: IP Licensing and Ecosystem Lock
Arm’s moat arises from its dominant intellectual property licensing model, enabling high gross and net margins. Its stable ROIC and rapid revenue growth suggest a widening moat, with expansion into AI and IoT markets fueling further gains.
Verdict: Manufacturing Scale vs. Licensing Ecosystem
Arm’s licensing moat is deeper and more scalable than Intel’s fading manufacturing advantage. Arm’s superior profitability and growth better position it to defend market share in a rapidly evolving semiconductor landscape.
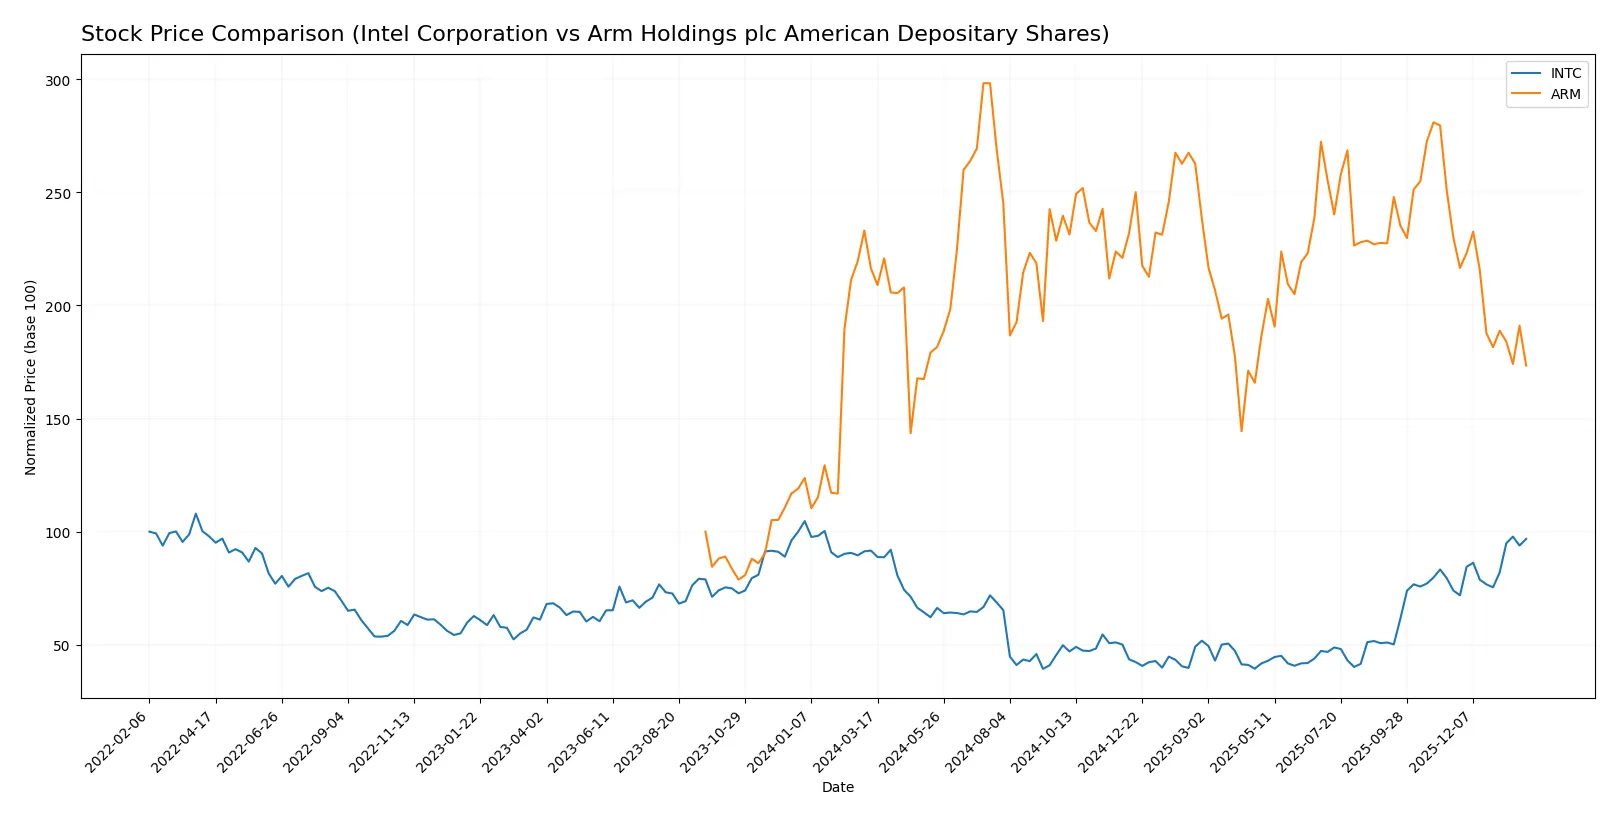
Which stock offers better returns?
The past year reveals divergent price movements: Intel Corporation posts steady gains with accelerating momentum, while Arm Holdings exhibits a marked decline and decelerating trend.
Trend Comparison
Intel’s stock advanced 5.61% over the past 12 months, signaling a bullish trend with accelerating momentum. The price ranged between 18.89 and 46.96, showing moderate volatility at 8.11%.
Arm Holdings’ stock declined 19.87% in the same period, reflecting a bearish trend with deceleration. The price fluctuated widely from 87.19 to 181.19, with high volatility measured at 19.62%.
Intel’s stock delivered the highest market performance, outperforming Arm with a positive return and accelerating trend versus Arm’s sustained losses and deceleration.
Target Prices
Analysts present a mixed but optimistic target consensus for Intel Corporation and Arm Holdings plc.
| Company | Target Low | Target High | Consensus |
|---|---|---|---|
| Intel Corporation | 20 | 66 | 46.95 |
| Arm Holdings plc American Depositary Shares | 120 | 170 | 145 |
Intel’s target consensus of $46.95 aligns closely with its current price of $46.47, indicating moderate upside potential. Arm’s $145 consensus substantially exceeds its $105.36 market price, signaling strong analyst confidence.

Don’t Let Luck Decide Your Entry Point
Optimize your entry points with our advanced ProRealTime indicators. You’ll get efficient buy signals with precise price targets for maximum performance. Start outperforming now!
How do institutions grade them?
This section compares the latest institutional grades for Intel Corporation and Arm Holdings plc American Depositary Shares:
Intel Corporation Grades
The following table shows recent grades assigned to Intel Corporation by major grading firms.
| Grading Company | Action | New Grade | Date |
|---|---|---|---|
| RBC Capital | Maintain | Sector Perform | 2026-01-23 |
| Wedbush | Maintain | Neutral | 2026-01-23 |
| Stifel | Maintain | Hold | 2026-01-23 |
| UBS | Maintain | Neutral | 2026-01-23 |
| Keybanc | Maintain | Overweight | 2026-01-23 |
| Roth Capital | Maintain | Neutral | 2026-01-23 |
| Needham | Maintain | Hold | 2026-01-23 |
| Morgan Stanley | Maintain | Equal Weight | 2026-01-23 |
| Benchmark | Maintain | Buy | 2026-01-23 |
| Evercore ISI Group | Maintain | In Line | 2026-01-23 |
Arm Holdings plc American Depositary Shares Grades
Below are the recent institutional grades for Arm Holdings plc American Depositary Shares.
| Grading Company | Action | New Grade | Date |
|---|---|---|---|
| UBS | Maintain | Buy | 2026-01-26 |
| Wells Fargo | Maintain | Overweight | 2026-01-26 |
| Morgan Stanley | Maintain | Overweight | 2026-01-23 |
| Susquehanna | Upgrade | Positive | 2026-01-21 |
| B of A Securities | Downgrade | Neutral | 2026-01-13 |
| B of A Securities | Maintain | Buy | 2025-12-16 |
| Goldman Sachs | Downgrade | Sell | 2025-12-15 |
| Loop Capital | Maintain | Buy | 2025-11-12 |
| Benchmark | Maintain | Hold | 2025-11-06 |
| Needham | Maintain | Hold | 2025-11-06 |
Which company has the best grades?
Arm Holdings generally receives more Buy and Overweight ratings than Intel, which mostly holds Neutral or Hold grades. This difference may influence investors seeking stronger bullish sentiment.
Risks specific to each company
The following categories identify the critical pressure points and systemic threats facing both firms in the 2026 market environment:
1. Market & Competition
Intel Corporation
- Faces intense rivalry from established chipmakers and emerging AI accelerators.
Arm Holdings plc American Depositary Shares
- Competes by licensing IP but faces risk from rapid innovation cycles and large incumbents.
2. Capital Structure & Debt
Intel Corporation
- Moderate leverage with debt/equity at 0.41; interest coverage at 2.63, signaling manageable but cautious debt risk.
Arm Holdings plc American Depositary Shares
- Very low debt ratio (0.05) and infinite interest coverage indicate a conservative balance sheet.
3. Stock Volatility
Intel Corporation
- Beta at 1.35 implies moderate volatility near industry norms.
Arm Holdings plc American Depositary Shares
- High beta of 4.36 signals substantial share price swings and elevated risk.
4. Regulatory & Legal
Intel Corporation
- Subject to U.S. technology export controls and antitrust scrutiny.
Arm Holdings plc American Depositary Shares
- Faces complex cross-border regulation due to global licensing and UK base.
5. Supply Chain & Operations
Intel Corporation
- Large, vertically integrated manufacturing exposed to semiconductor cycle swings.
Arm Holdings plc American Depositary Shares
- Relies on licensing model, reducing direct supply chain risks but dependent on foundry partners.
6. ESG & Climate Transition
Intel Corporation
- Significant energy usage challenges but established sustainability programs.
Arm Holdings plc American Depositary Shares
- Smaller footprint but pressured to align IP licensing with global ESG standards.
7. Geopolitical Exposure
Intel Corporation
- Heavily exposed to US-China tensions impacting semiconductor sales and operations.
Arm Holdings plc American Depositary Shares
- Global IP licensing model sensitive to geopolitical trade policies and sanctions.
Which company shows a better risk-adjusted profile?
Intel’s most impactful risk is its negative profitability amid high capital intensity and geopolitical pressure. Arm’s greatest risk lies in its extreme stock volatility and high valuation multiples. Despite challenges, Arm’s pristine balance sheet and strong Altman Z-Score position it with a better risk-adjusted profile. Intel’s financial distress signals caution, especially with negative returns on invested capital and moderate interest coverage. Arm’s 2026 Altman Z-Score in the safe zone and Piotroski score of 7 underscore superior financial health despite market jitters.
Final Verdict: Which stock to choose?
Intel Corporation’s superpower lies in its solid liquidity and capital structure, providing a resilient cash buffer amid cyclical tech headwinds. However, its declining profitability and sluggish asset turnover remain points of vigilance. Intel fits portfolios seeking turnaround potential within established tech giants.
Arm Holdings commands a strategic moat through its dominant licensing model and high-margin software ecosystem, underpinning steady revenue visibility. Its balance sheet shows exceptional financial strength, offering better stability than Intel. Arm suits investors favoring GARP—growth at a reasonable price—with an appetite for innovation leadership.
If you prioritize resilient cash flow and value recovery, Intel is the compelling choice due to its strong liquidity and capital discipline. However, if you seek growth backed by a scalable moat and cleaner financials, Arm offers superior stability and strategic positioning despite its premium valuation. Both carry risks; assessing your tolerance for cyclical volatility versus growth premium is key.
Disclaimer: Investment carries a risk of loss of initial capital. The past performance is not a reliable indicator of future results. Be sure to understand risks before making an investment decision.
Go Further
I encourage you to read the complete analyses of Intel Corporation and Arm Holdings plc American Depositary Shares to enhance your investment decisions: