Home > Comparison > Technology > INTC vs ADI
The strategic rivalry between Intel Corporation and Analog Devices, Inc. defines the current trajectory of the semiconductor industry. Intel operates as a capital-intensive semiconductor giant focused on computing platforms, while Analog Devices specializes in high-margin, precision analog and mixed-signal components. This head-to-head pits scale and integration against niche innovation. This analysis will determine which corporate path offers the superior risk-adjusted outlook for a diversified portfolio in technology.
Table of contents
Companies Overview
Intel Corporation and Analog Devices, Inc. stand as pivotal players shaping the semiconductor industry’s future.
Intel Corporation: Semiconductor Giant Innovating Compute Platforms
Intel dominates the semiconductor sector with a broad portfolio of CPUs, chipsets, and accelerators. Its core revenue comes from selling platform products and high-performance compute solutions to OEMs, cloud providers, and governments. In 2026, Intel sharpens its focus on AI-driven computing and autonomous driving platforms, reinforcing its role in next-gen technology ecosystems.
Analog Devices, Inc.: Precision Signal Processing Leader
Analog Devices excels in analog and mixed-signal ICs that convert and condition real-world data for diverse markets. Its revenue largely derives from power management, amplifiers, and RF ICs serving automotive, industrial, and communications sectors. The company prioritizes innovation in integrated systems and sensor technologies to capitalize on growing demand in aerospace and instrumentation.
Strategic Collision: Similarities & Divergences
Both companies operate in semiconductors but diverge in business philosophy: Intel emphasizes integrated compute ecosystems, while Analog Devices focuses on specialized signal processing components. Their primary battleground is the expanding AI and autonomous systems market. Intel offers scale and platform breadth; Analog Devices delivers precision and niche expertise, creating distinct investment profiles rooted in differing competitive moats.
Income Statement Comparison
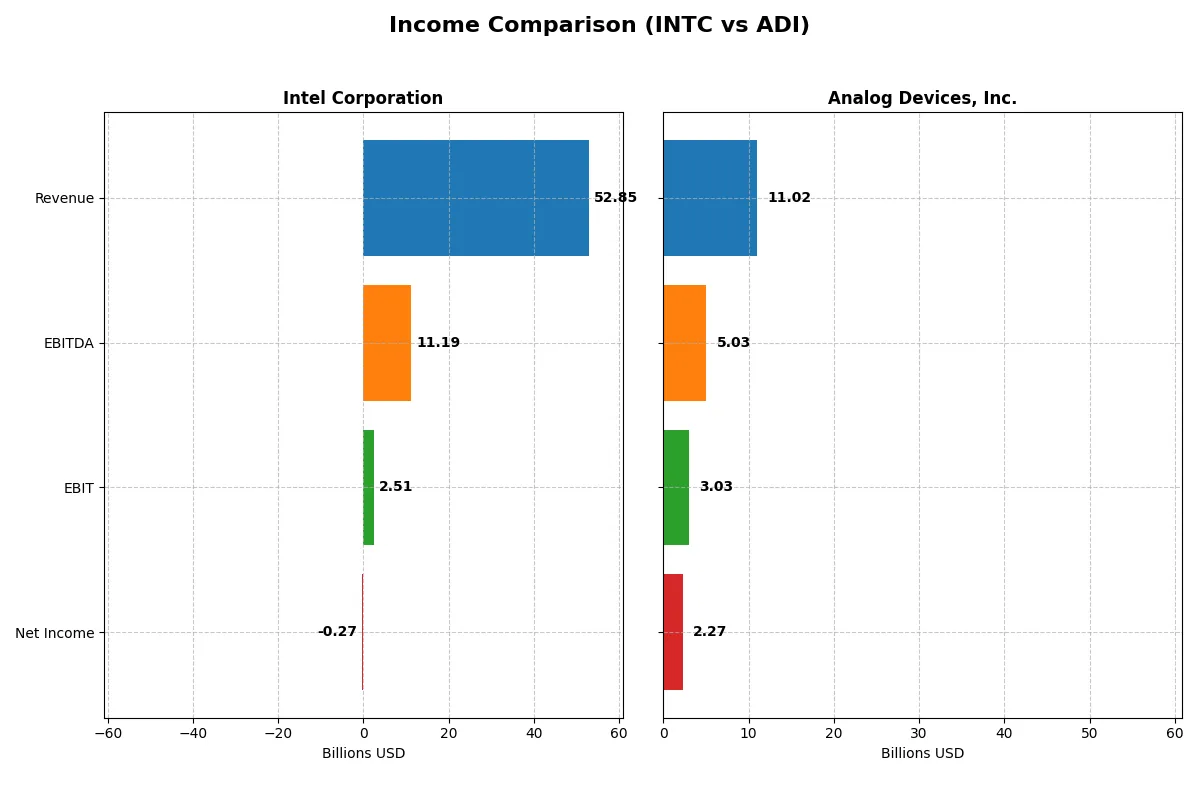
This data dissects the core profitability and scalability of both corporate engines to reveal who dominates the bottom line:
| Metric | Intel Corporation (INTC) | Analog Devices, Inc. (ADI) |
|---|---|---|
| Revenue | 52.9B | 11.0B |
| Cost of Revenue | 34.4B | 5.0B |
| Operating Expenses | 20.6B | 3.0B |
| Gross Profit | 18.5B | 6.0B |
| EBITDA | 11.2B | 5.0B |
| EBIT | 2.5B | 3.0B |
| Interest Expense | 953M | 318M |
| Net Income | -267M | 2.3B |
| EPS | -0.08 | 4.59 |
| Fiscal Year | 2025 | 2025 |
Income Statement Analysis: The Bottom-Line Duel
This income statement comparison reveals which company converts revenue into profit most efficiently and sustains financial momentum through market cycles.
Intel Corporation Analysis
Intel’s revenue declined by 0.5% in 2025 to $52.9B, continuing a downtrend since 2021. Gross margin improved to 35%, signaling some cost control, but net income turned negative at -$267M, reflecting weak bottom-line health. Despite a rebound in EBIT, the negative net margin of -0.5% raises concerns about overall profitability and operational efficiency.
Analog Devices, Inc. Analysis
Analog Devices posted robust revenue growth of 16.9% in 2025, hitting $11B, with gross margin expanding to 54.7%. Net income reached $2.27B, driving a strong net margin of 20.6%. This confirms excellent operational leverage and capital allocation. Steady EBIT margin growth (27.5%) highlights sustained momentum and superior profitability compared to peers.
Margin Excellence vs. Revenue Scale
Analog Devices clearly outperforms Intel in profitability and margin expansion, boasting consistent revenue and net income growth. Intel’s shrinking top line and negative net margin contrast sharply with Analog’s efficiency and earnings quality. For investors, Analog’s high-margin, growth-oriented profile offers a more attractive risk-reward balance.
Financial Ratios Comparison
These vital ratios act as a diagnostic tool to expose the underlying fiscal health, valuation premiums, and capital efficiency of the companies compared below:
| Ratios | Intel Corporation (INTC) | Analog Devices, Inc. (ADI) |
|---|---|---|
| ROE | -0.23% | 6.70% |
| ROIC | -0.02% | 5.55% |
| P/E | -658.4 | 51.1 |
| P/B | 1.54 | 3.42 |
| Current Ratio | 2.02 | 2.19 |
| Quick Ratio | 1.65 | 1.68 |
| D/E (Debt-to-Equity) | 0.41 | 0.26 |
| Debt-to-Assets | 22.0% | 18.1% |
| Interest Coverage | -2.23 | 9.45 |
| Asset Turnover | 0.25 | 0.23 |
| Fixed Asset Turnover | 0.50 | 3.32 |
| Payout Ratio | 0% | 85% |
| Dividend yield | 0% | 1.66% |
| Fiscal Year | 2025 | 2025 |
Efficiency & Valuation Duel: The Vital Signs
Ratios act as a company’s DNA, exposing hidden risks and operational excellence beneath headline figures.
Intel Corporation
Intel’s profitability struggles with negative ROE (-0.23%) and net margin (-0.51%), signaling operational challenges. Valuation appears cheap with a strongly negative P/E, but asset turnover remains weak. The company pays no dividend, focusing on heavy reinvestment in R&D (26% of revenue), aiming for growth recovery despite current financial strain.
Analog Devices, Inc.
Analog Devices posts a solid 20.58% net margin, though its 6.7% ROE is modest. The stock trades at a stretched P/E of 51.05 and a high P/B of 3.42, reflecting premium valuation. ADI balances growth and shareholder returns with a 1.66% dividend yield, supported by efficient capital allocation and strong interest coverage.
Premium Valuation vs. Operational Struggles
ADI offers stronger profitability and healthier financial ratios but at a premium price. Intel’s valuation looks attractive amid ongoing profitability issues and heavy reinvestment. Investors favoring operational safety may lean toward ADI, while those seeking value amid turnaround potential might consider Intel.
Which one offers the Superior Shareholder Reward?
Intel Corporation (INTC) currently pays no dividends and reports negative free cash flow (-1B per share), signaling distribution challenges. Analog Devices, Inc. (ADI) yields ~1.6%–1.7% with a payout ratio near 85%, supported by robust free cash flow (8.6B per share) and steady buybacks. ADI’s capital allocation favors sustainable dividends plus buybacks, while INTC’s lack of yield and negative free cash flow raise red flags. I conclude ADI offers the superior total shareholder reward in 2026 due to its consistent, well-covered distributions and efficient capital deployment.
Comparative Score Analysis: The Strategic Profile
The radar chart reveals the fundamental DNA and trade-offs of Intel Corporation and Analog Devices, Inc., highlighting their financial strengths and weaknesses:
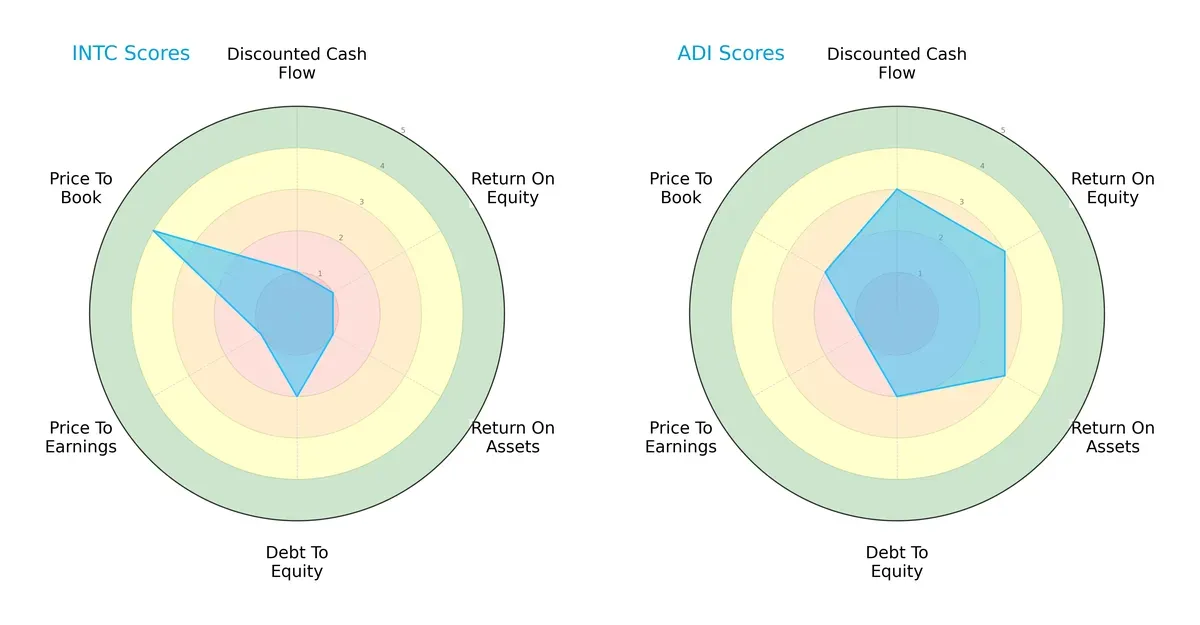
Analog Devices shows a balanced profile with moderate scores in discounted cash flow (3), ROE (3), and ROA (3), indicating efficient profit generation and asset use. Intel relies heavily on valuation strength in price-to-book (4) but scores poorly in profitability metrics (all 1s). Both have moderate debt-to-equity (2), but Intel’s valuation and cash flow scores lag, reflecting higher risk.
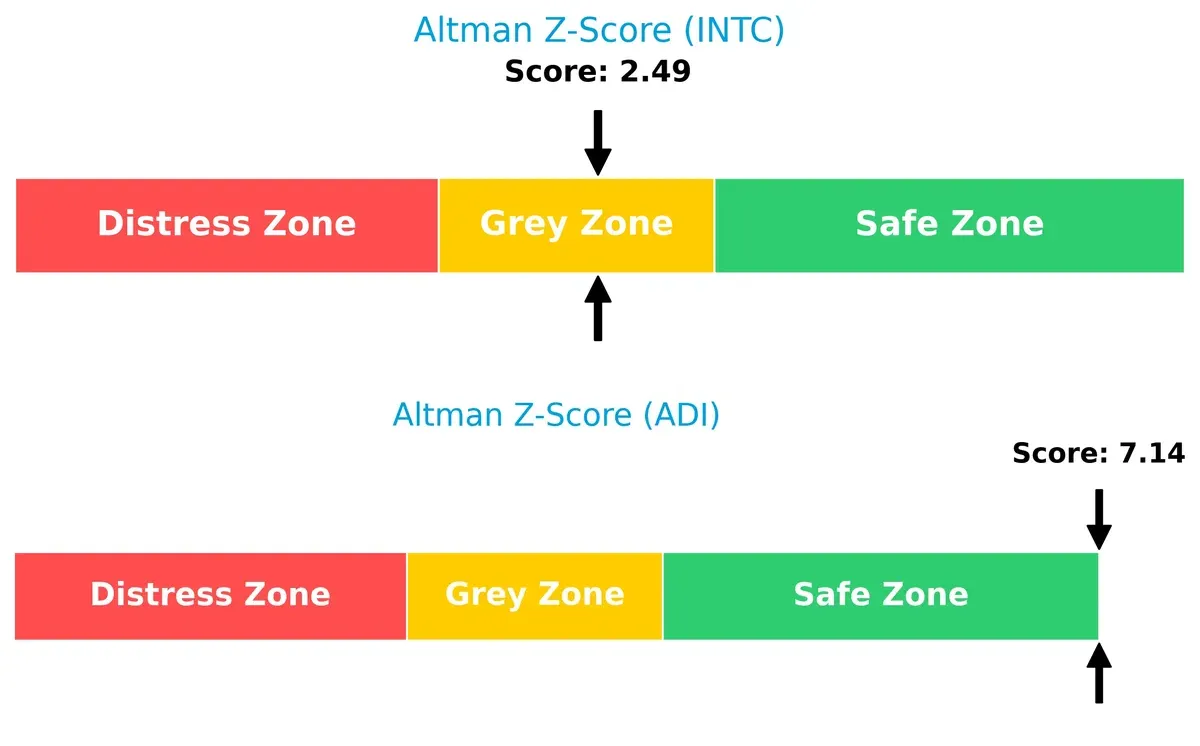
Bankruptcy Risk: Solvency Showdown
Analog Devices’ Altman Z-Score of 7.14 places it firmly in the safe zone, signaling robust solvency and low bankruptcy risk. Intel’s score of 2.49 in the grey zone suggests moderate financial distress risk amid current market volatility:
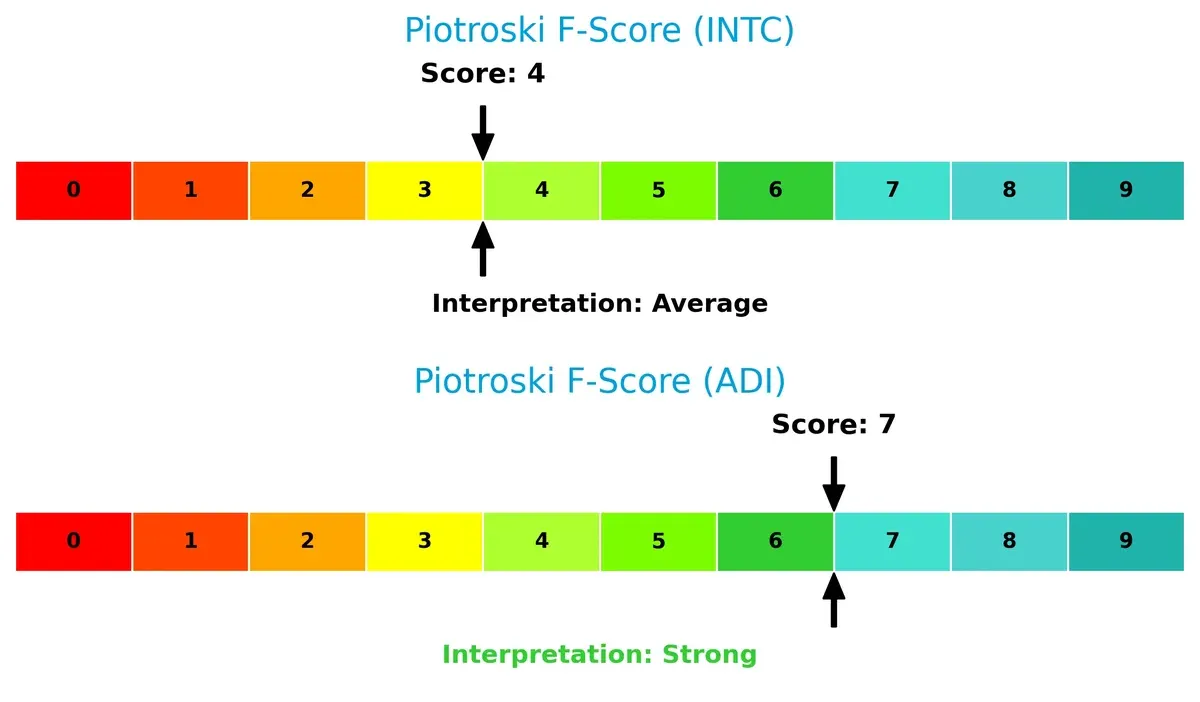
Financial Health: Quality of Operations
Analog Devices leads with a strong Piotroski F-Score of 7, indicating solid internal financial health. Intel’s average score of 4 raises red flags about operational efficiency and profitability underperformance:
How are the two companies positioned?
This section dissects the operational DNA of Intel and Analog Devices by comparing their revenue distribution and internal strengths and weaknesses. The goal is to confront their economic moats and identify which model offers the most resilient, sustainable competitive advantage today.
Revenue Segmentation: The Strategic Mix
This visual comparison dissects how Intel Corporation and Analog Devices, Inc. diversify their income streams and where their primary sector bets lie:
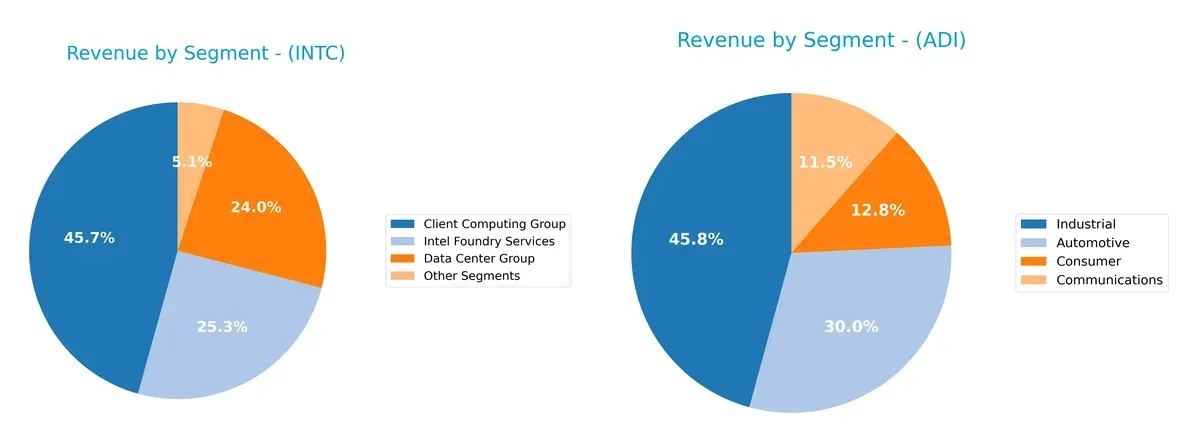
Intel leans heavily on the Client Computing Group at $32.2B, anchored by Data Center and Foundry Services segments. Analog Devices shows a more balanced portfolio, with Industrial leading at $4.3B and Automotive close behind at $2.8B. Intel’s concentration signals infrastructure dominance but exposes it to single-segment risk. ADI’s spread across Industrial, Automotive, Communications, and Consumer reduces dependency, enhancing resilience.
Strengths and Weaknesses Comparison
This table compares the Strengths and Weaknesses of Intel Corporation and Analog Devices, Inc.:
Intel Corporation Strengths
- Broad revenue base across computing, data center, foundry, and other segments
- Strong global presence with sizable US and Asia-Pacific sales
- Solid liquidity ratios and moderate debt levels
Analog Devices Strengths
- Diverse end markets including automotive, industrial, communications, and consumer
- Favorable net margin and strong interest coverage ratio
- Healthy liquidity and low debt-to-assets
Intel Corporation Weaknesses
- Negative profitability metrics including net margin, ROE, and ROIC
- Unfavorable asset efficiency ratios
- Lack of dividend yield
Analog Devices Weaknesses
- Elevated price-to-earnings and price-to-book ratios
- Moderate ROE and neutral ROIC
- Asset turnover slightly below ideal
Intel’s diversified business and global scale contrast with its profitability challenges in 2025. Analog Devices shows stronger profitability but faces valuation concerns. Both must balance operational efficiency with market expectations.
The Moat Duel: Analyzing Competitive Defensibility
A structural moat is the only reliable shield protecting long-term profits from relentless competition erosion:
Intel Corporation: Scale and Integrated Manufacturing Moat
Intel’s primary advantage stems from its massive scale and proprietary manufacturing capabilities. This moat yields robust gross margins near 35%, but recent declining ROIC signals eroding profitability. In 2026, new products and advanced nodes could either restore or further strain this edge.
Analog Devices, Inc.: High-Value Analog Specialization Moat
Analog Devices leverages specialized analog and mixed-signal expertise, unlike Intel’s scale focus. Its superior margins above 54% and rising ROIC demonstrate strengthening value creation. Expansion into automotive and industrial markets in 2026 should deepen this moat.
Scale and Manufacturing vs. Specialized Analog Expertise
Intel’s vast scale faces margin pressure and declining capital returns, while Analog Devices shows improving profitability and growth. I see Analog Devices’ moat as deeper and more sustainable, better equipping it to defend market share.
Which stock offers better returns?
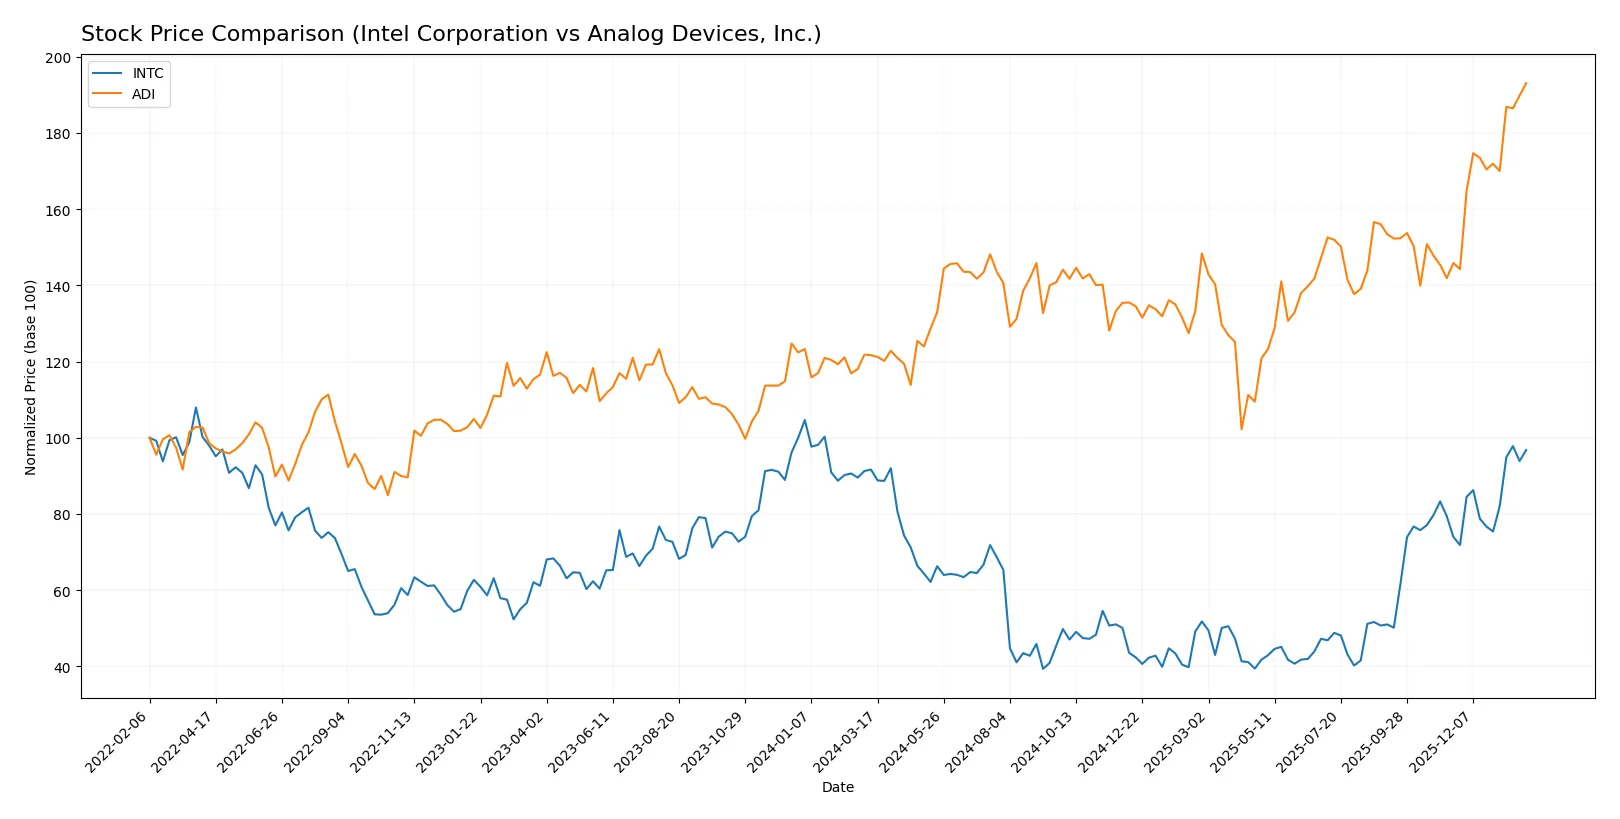
The past year saw Intel Corporation’s shares rise steadily with accelerating momentum, while Analog Devices, Inc. exhibited a stronger price surge and higher volatility over the same period.
Trend Comparison
Intel’s stock gained 5.61% over 12 months, marking a bullish trend with acceleration. Its price ranged from $18.89 to $46.96, supported by moderate volatility (8.11% std deviation).
Analog Devices’ shares soared 58.66% in the past year, showing a bullish trend with acceleration. Price volatility was high at 26.38%, with a range from $164.60 to $310.88.
Analog Devices delivered the highest market performance, outperforming Intel by a wide margin despite greater volatility.
Target Prices
Analysts set a broad but optimistic consensus on target prices for Intel Corporation and Analog Devices, Inc.
| Company | Target Low | Target High | Consensus |
|---|---|---|---|
| Intel Corporation | 20 | 66 | 46.95 |
| Analog Devices, Inc. | 270 | 375 | 316 |
The consensus target for Intel slightly exceeds its current price of 46.47, indicating moderate upside potential. Analog Devices’ target consensus at 316 suggests a modest gain above its current 310.88 price, reflecting steady confidence from analysts.

Don’t Let Luck Decide Your Entry Point
Optimize your entry points with our advanced ProRealTime indicators. You’ll get efficient buy signals with precise price targets for maximum performance. Start outperforming now!
How do institutions grade them?
Intel Corporation Grades
This table summarizes recent grade actions from leading financial institutions for Intel Corporation.
| Grading Company | Action | New Grade | Date |
|---|---|---|---|
| RBC Capital | Maintain | Sector Perform | 2026-01-23 |
| Wedbush | Maintain | Neutral | 2026-01-23 |
| Stifel | Maintain | Hold | 2026-01-23 |
| UBS | Maintain | Neutral | 2026-01-23 |
| Keybanc | Maintain | Overweight | 2026-01-23 |
| Roth Capital | Maintain | Neutral | 2026-01-23 |
| Needham | Maintain | Hold | 2026-01-23 |
| Morgan Stanley | Maintain | Equal Weight | 2026-01-23 |
| Benchmark | Maintain | Buy | 2026-01-23 |
| Evercore ISI Group | Maintain | In Line | 2026-01-23 |
Analog Devices, Inc. Grades
Here is a summary of recent institutional grade updates for Analog Devices, Inc.
| Grading Company | Action | New Grade | Date |
|---|---|---|---|
| Susquehanna | Maintain | Positive | 2026-01-22 |
| B of A Securities | Maintain | Buy | 2026-01-21 |
| Stifel | Maintain | Buy | 2026-01-16 |
| Oppenheimer | Maintain | Outperform | 2026-01-16 |
| Wells Fargo | Upgrade | Overweight | 2026-01-15 |
| Citigroup | Maintain | Buy | 2026-01-15 |
| Keybanc | Maintain | Overweight | 2026-01-13 |
| Truist Securities | Maintain | Hold | 2025-12-19 |
| UBS | Maintain | Buy | 2025-12-08 |
| Truist Securities | Maintain | Hold | 2025-11-26 |
Which company has the best grades?
Analog Devices, Inc. consistently earns Buy and Outperform ratings, showing stronger institutional confidence than Intel Corporation. This could attract investors seeking higher conviction from analysts.
Risks specific to each company
The following categories identify the critical pressure points and systemic threats facing both firms in the 2026 market environment:
1. Market & Competition
Intel Corporation
- Faces intense competition in CPUs and adjacent markets; struggles with profitability and asset efficiency.
Analog Devices, Inc.
- Competes in analog and mixed-signal ICs; enjoys better margin and product specialization but faces premium valuation risks.
2. Capital Structure & Debt
Intel Corporation
- Maintains moderate debt-to-equity (0.41) with favorable leverage metrics but only neutral interest coverage.
Analog Devices, Inc.
- Lower debt-to-equity ratio (0.26) and strong interest coverage (9.54) indicate a more conservative capital structure.
3. Stock Volatility
Intel Corporation
- Higher beta (1.354) suggests greater stock price volatility and market sensitivity.
Analog Devices, Inc.
- Beta near market average (1.032) denotes relatively stable price movements.
4. Regulatory & Legal
Intel Corporation
- Subject to global antitrust scrutiny and semiconductor export restrictions.
Analog Devices, Inc.
- Faces regulatory headwinds in automotive and industrial sectors but with less public antitrust pressure.
5. Supply Chain & Operations
Intel Corporation
- Large, complex supply chain with exposure to manufacturing delays and geopolitical disruptions.
Analog Devices, Inc.
- More diversified supply chain with less capital-intensive manufacturing, reducing operational risk.
6. ESG & Climate Transition
Intel Corporation
- Increasing ESG pressure to reduce carbon footprint in energy-intensive chip fabrication.
Analog Devices, Inc.
- ESG initiatives focus on sustainable product design and energy-efficient ICs, mitigating transition risks.
7. Geopolitical Exposure
Intel Corporation
- Significant exposure to US-China tensions affecting supply and demand dynamics.
Analog Devices, Inc.
- Also exposed to global trade tensions but with broader customer base in diverse sectors.
Which company shows a better risk-adjusted profile?
Intel’s most impactful risk is its operational and market inefficiency, reflected in negative profitability and weak asset turnover. Analog Devices faces valuation risk amid premium multiples but benefits from superior financial health and stable operations. ADI’s safer capital structure and strong Altman Z-Score (7.14 vs. INTC’s 2.49) signal a better risk-adjusted profile. Intel’s ongoing margin pressure and stock volatility justify caution despite its scale.
Final Verdict: Which stock to choose?
Intel Corporation’s superpower lies in its strong liquidity and disciplined capital structure, providing a solid financial foundation amid a turbulent sector. However, its persistent value destruction and declining profitability serve as a point of vigilance. Intel might fit portfolios seeking deep value turnaround plays with higher risk tolerance.
Analog Devices, Inc. boasts a strategic moat through its robust profitability and steadily growing return on invested capital. Its superior cash flow quality and financial health offer a safer profile relative to Intel. Analog Devices could suit investors targeting GARP strategies with a preference for stability and moderate growth.
If you prioritize deep value with potential for a turnaround, Intel presents an analytical scenario due to its strong balance sheet but weakening profitability. However, if you seek stability combined with improving profitability, Analog Devices outshines as the safer, more consistent choice, though it commands a premium valuation.
Disclaimer: Investment carries a risk of loss of initial capital. The past performance is not a reliable indicator of future results. Be sure to understand risks before making an investment decision.
Go Further
I encourage you to read the complete analyses of Intel Corporation and Analog Devices, Inc. to enhance your investment decisions: