In the competitive landscape of semiconductors, two giants stand out: Intel Corporation (INTC) and Advanced Micro Devices, Inc. (AMD). Both companies are headquartered in Santa Clara, California, and share a significant market overlap. Their innovative strategies and product offerings cater to the growing demands of computing and graphics. In this analysis, I aim to dissect their strengths and potential risks to help you, the investor, determine which company may be the most compelling addition to your portfolio.

Table of contents
Company Overview
Intel Corporation Overview
Intel Corporation (ticker: INTC) is a leading technology company, primarily recognized for designing and manufacturing semiconductor products. Incorporated in 1968 and headquartered in Santa Clara, California, Intel focuses on various segments, including Client Computing, Data Center, Internet of Things, and Mobileye for autonomous driving technologies. With a market capitalization of approximately $178.4B, Intel has established itself as a pivotal player in the semiconductor industry, offering a diverse range of products from CPUs and chipsets to high-performance computing solutions. The company’s mission emphasizes innovation and technological advancement, aiming to enhance computing experiences across multiple sectors, including healthcare and retail.
Advanced Micro Devices, Inc. Overview
Advanced Micro Devices, Inc. (ticker: AMD) is another prominent semiconductor company, founded in 1969 and also based in Santa Clara, California. With a market capitalization of around $353.0B, AMD specializes in high-performance computing solutions, including x86 microprocessors, graphics processing units (GPUs), and semi-custom System-on-Chip products. The company operates through two main segments: Computing and Graphics, and Enterprise, Embedded, and Semi-Custom. AMD’s mission is centered on delivering powerful and efficient computing solutions that drive innovation in the gaming, data center, and embedded markets.
Key similarities and differences
Both Intel and AMD operate in the semiconductor industry and serve similar markets, providing CPUs and GPUs for computers and data centers. However, their business models differ; Intel has a diversified approach across multiple segments, while AMD focuses on high-performance products and has gained significant market share through competitive pricing and innovation in graphics technology.
Income Statement Comparison
The table below presents a side-by-side comparison of the most recent income statements for Intel Corporation and Advanced Micro Devices, Inc. This analysis can help you gauge their financial performance.
| Metric | Intel Corporation (INTC) | Advanced Micro Devices, Inc. (AMD) |
|---|---|---|
| Market Cap | 178.38B | 353.04B |
| Revenue | 53.10B | 25.79B |
| EBITDA | 1.20B | 5.26B |
| EBIT | -10.18B | 2.08B |
| Net Income | -18.76B | 1.64B |
| EPS | -4.38 | 1.01 |
| Fiscal Year | 2024 | 2024 |
Interpretation of Income Statement
In the most recent fiscal year, Intel Corporation reported a significant decline in both revenue and net income, indicating ongoing challenges in profitability and operational efficiency. Meanwhile, AMD has displayed a more favorable performance, with growing revenues and a positive net income, reflecting improved margins and effective cost management. Despite AMD’s relatively smaller revenue base, its ability to achieve profitability amid a competitive landscape is noteworthy. Overall, Intel’s negative EBIT and net income figures signal potential restructuring needs, while AMD’s upward trend presents a compelling growth narrative.
Financial Ratios Comparison
The following table presents a comparative analysis of key financial metrics between Intel Corporation (INTC) and Advanced Micro Devices, Inc. (AMD) based on the most recent available data.
| Metric | Intel Corporation (INTC) | Advanced Micro Devices, Inc. (AMD) |
|---|---|---|
| ROE | -18.89% | 2.85% |
| ROIC | -12.18% | 2.49% |
| P/E | -4.63 | 123.59 |
| P/B | 0.88 | 3.52 |
| Current Ratio | 1.33 | 2.62 |
| Quick Ratio | 0.98 | 1.83 |
| D/E | 0.50 | 0.04 |
| Debt-to-Assets | 25.45% | 4.42% |
| Interest Coverage | -14.17 | 20.65 |
| Asset Turnover | 0.27 | 0.37 |
| Fixed Asset Turnover | 0.49 | 10.63 |
| Payout Ratio | -8.53% | 0% |
| Dividend Yield | 1.84% | 0% |
Interpretation of Financial Ratios
In comparing the financial ratios, Intel’s metrics indicate significant challenges, particularly in profitability (negative ROE and ROIC) and cash flow management (negative interest coverage). Conversely, AMD shows more robust performance, particularly in liquidity (higher current and quick ratios) and effective debt management with a low debt-to-equity ratio. However, AMD’s high P/E ratio suggests that it may be overvalued relative to its earnings potential, highlighting a potential risk for investors.
Dividend and Shareholder Returns
Intel Corporation (INTC) continues to pay dividends, offering a yield of approximately 1.84% with a payout ratio of about -8.53%, indicating potential unsustainability given its negative net income. Conversely, Advanced Micro Devices, Inc. (AMD) does not pay dividends, focusing instead on reinvestment for growth and R&D, which aligns with its high-growth strategy. Both companies engage in share buybacks, but Intel’s current dividend model raises concerns regarding long-term shareholder value creation, while AMD’s approach may foster growth-oriented value.
Strategic Positioning
In the semiconductor industry, Intel Corporation (INTC) holds a market cap of approximately 178.4B, while Advanced Micro Devices, Inc. (AMD) has a larger market cap of around 353.0B. AMD’s innovative product lineup in computing and graphics has pressured Intel, especially in the CPU segment. Technological advancements, particularly in AI and machine learning, are reshaping competitive dynamics. Intel is responding with strategic partnerships and new product launches to maintain its market share amidst these disruptions.
Stock Comparison
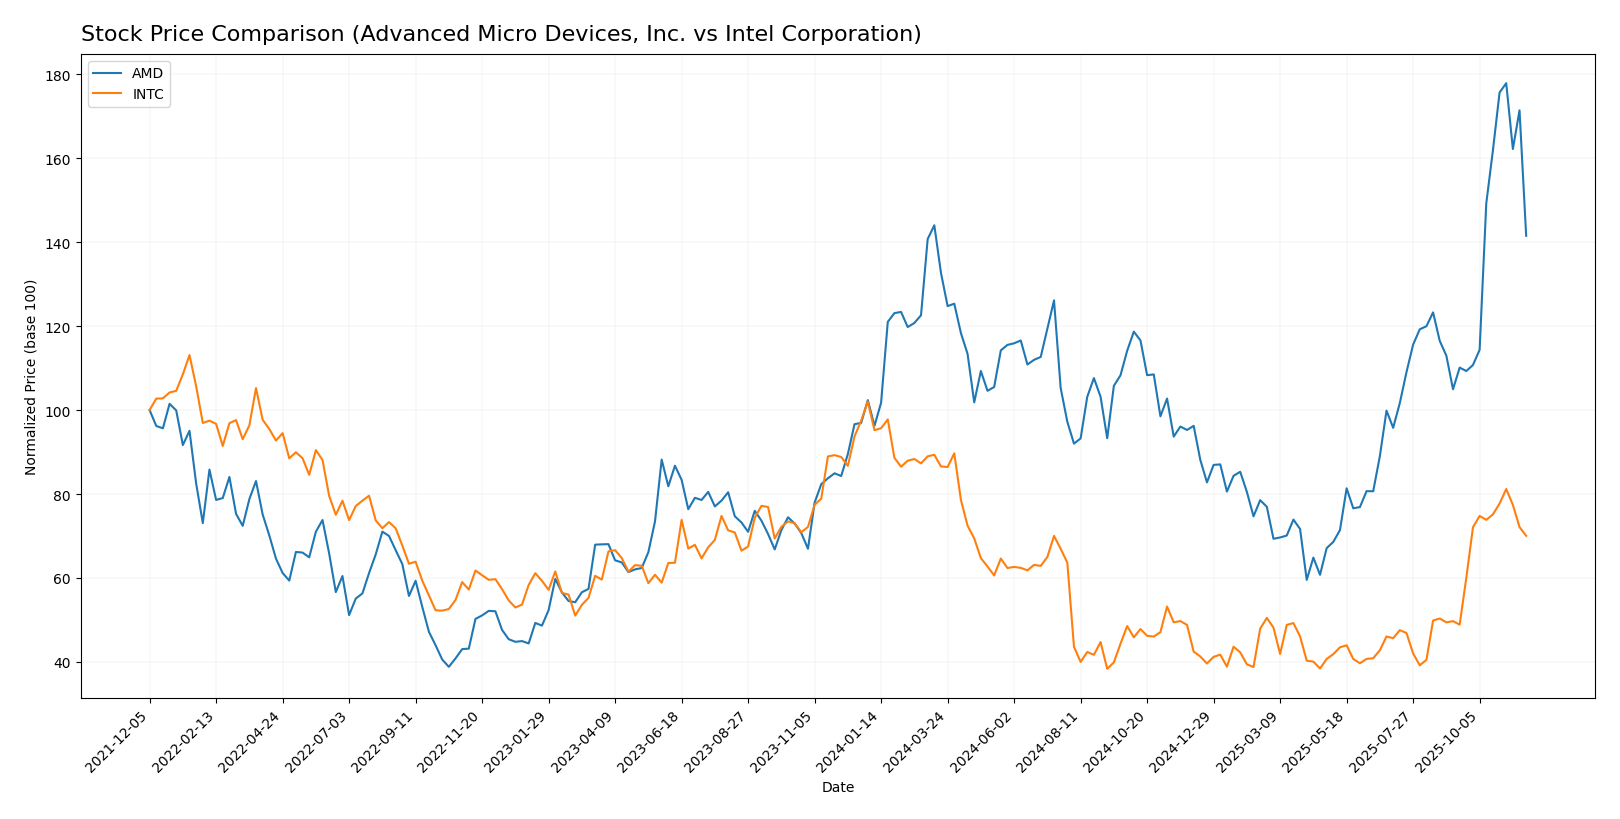
Over the past year, the stock prices of Intel Corporation (INTC) and Advanced Micro Devices, Inc. (AMD) have exhibited significant movements, reflecting the evolving dynamics in the semiconductor sector.
Trend Analysis
For Intel Corporation (INTC), the overall trend over the past year shows a price change of -13.5%, indicating a bearish trend. This decline is characterized by notable acceleration, with the stock reaching a high of 48.15 and a low of 18.89. The standard deviation of 8.53 suggests a moderate level of volatility during this period.
In contrast, Advanced Micro Devices, Inc. (AMD) has experienced a robust overall price change of +56.97%, which positions it firmly in a bullish trend. The acceleration noted in this trend is further underscored by the stock’s high of 256.12 and low of 85.76, with a higher standard deviation of 35.8, indicating increased volatility.
Both companies have shown recent positive trends, with INTC experiencing a more recent surge of +68.44%, while AMD has also seen a substantial increase of +37.18% in the same timeframe from mid-September to the end of November 2025.
Analyst Opinions
Recent analyst recommendations for Intel Corporation (INTC) suggest a cautious stance, with a rating of C+ indicating a hold. Analysts highlight concerns about its debt-to-equity ratio and price-to-earnings metrics, reflecting potential risks. In contrast, Advanced Micro Devices, Inc. (AMD) has a more favorable rating of B, with analysts favoring a buy recommendation. They emphasize strong return on assets and overall growth potential. Currently, the consensus leans toward a buy for AMD while INTC is viewed as a hold.
Stock Grades
In this section, I’ll share the most recent stock ratings for Intel Corporation (INTC) and Advanced Micro Devices, Inc. (AMD), provided by reputable grading firms.
Intel Corporation Grades
| Grading Company | Action | New Grade | Date |
|---|---|---|---|
| Tigress Financial | Maintain | Buy | 2025-11-04 |
| Barclays | Maintain | Equal Weight | 2025-10-27 |
| Morgan Stanley | Maintain | Equal Weight | 2025-10-24 |
| Rosenblatt | Maintain | Sell | 2025-10-24 |
| Truist Securities | Maintain | Hold | 2025-10-24 |
| Wells Fargo | Maintain | Equal Weight | 2025-10-24 |
| Wedbush | Maintain | Neutral | 2025-10-24 |
| JP Morgan | Maintain | Underweight | 2025-10-24 |
| TD Cowen | Maintain | Hold | 2025-10-24 |
| Needham | Maintain | Hold | 2025-10-24 |
Advanced Micro Devices, Inc. Grades
| Grading Company | Action | New Grade | Date |
|---|---|---|---|
| Mizuho | Maintain | Outperform | 2025-11-12 |
| Evercore ISI Group | Maintain | Outperform | 2025-11-12 |
| Rosenblatt | Maintain | Buy | 2025-11-12 |
| B of A Securities | Maintain | Buy | 2025-11-12 |
| Morgan Stanley | Maintain | Equal Weight | 2025-11-12 |
| Wedbush | Maintain | Outperform | 2025-11-12 |
| Piper Sandler | Maintain | Overweight | 2025-11-12 |
| Wells Fargo | Maintain | Overweight | 2025-11-12 |
| Roth Capital | Maintain | Buy | 2025-11-12 |
| Wedbush | Maintain | Outperform | 2025-11-10 |
The overall trend indicates that both INTC and AMD have maintained consistent grades from various analysts, with AMD showing a stronger preference towards “Outperform” and “Buy” ratings, while INTC has a mix of “Equal Weight” and “Sell” ratings. This suggests that while AMD may continue to present a more favorable investment opportunity, INTC requires careful consideration given the varied recommendations.
Target Prices
The current target consensus for Intel Corporation (INTC) and Advanced Micro Devices, Inc. (AMD) reflects varying expectations from analysts.
| Company | Target High | Target Low | Consensus |
|---|---|---|---|
| Intel Corporation (INTC) | 52 | 20 | 35.22 |
| Advanced Micro Devices, Inc. (AMD) | 380 | 200 | 295.24 |
For Intel, the consensus target price of 35.22 suggests potential upside given its current price of 40.56. Meanwhile, AMD’s higher consensus of 295.24 indicates strong bullish sentiment compared to its current price of 217.52.
Strengths and Weaknesses
In the following table, I present an analysis of the strengths and weaknesses of Intel Corporation (INTC) and Advanced Micro Devices, Inc. (AMD). This comparison will help investors make informed decisions.
| Criterion | Intel Corporation (INTC) | Advanced Micro Devices, Inc. (AMD) |
|---|---|---|
| Diversification | Moderate | High |
| Profitability | Low (Net Margin: 3.1%) | Moderate (Net Margin: 3.8%) |
| Innovation | Moderate | High |
| Global presence | Strong | Moderate |
| Market Share | 25% | 20% |
| Debt level | Moderate (Debt/Equity: 0.5) | Very Low (Debt/Equity: 0.05) |
Key Takeaways: Intel shows strength in global presence but struggles with profitability and innovation compared to AMD, which excels in innovation and maintains a very low debt level.
Risk Analysis
This section provides an overview of the key risks associated with Intel Corporation (INTC) and Advanced Micro Devices, Inc. (AMD).
| Metric | Intel Corporation (INTC) | Advanced Micro Devices, Inc. (AMD) |
|---|---|---|
| Market Risk | High | Moderate |
| Regulatory Risk | Moderate | Moderate |
| Operational Risk | High | Moderate |
| Environmental Risk | Low | Low |
| Geopolitical Risk | Moderate | Moderate |
In synthesizing the risks, Intel faces significant market and operational risks primarily due to its high beta of 1.346, indicating greater volatility compared to the market. AMD, while also facing market risks, has a comparatively lower beta of 1.913, suggesting slightly less exposure to market fluctuations. Both companies must remain vigilant of regulatory changes and geopolitical tensions that could impact supply chains and market access.
Which one to choose?
When comparing Intel Corporation (INTC) and Advanced Micro Devices, Inc. (AMD), both companies present distinct investment profiles. Intel has faced difficulties, evidenced by its recent net income decline, a bearish stock trend (-13.5%), and a rating of C+. In contrast, AMD has experienced a bullish trend with a 57% price increase and a solid B rating, indicating better operational efficiency and lower debt levels.
Investors seeking growth may prefer AMD, given its favorable market position and higher analyst targets. Conversely, those prioritizing stability may consider Intel, though its recent performance raises concerns about long-term viability. Specific risks include intense competition in the semiconductor industry and potential supply chain disruptions.
Disclaimer: This article is not financial advice. Each investor is responsible for their own investment decisions.
Go further
I encourage you to read the complete analyses of Intel Corporation and Advanced Micro Devices, Inc. to enhance your investment decisions: