Home > Comparison > Healthcare > SYK vs PODD
The strategic rivalry between Stryker Corporation and Insulet Corporation shapes the trajectory of the medical devices sector. Stryker, a capital-intensive giant with diverse surgical and implant offerings, contrasts sharply with Insulet’s specialized, high-margin insulin delivery systems. This head-to-head pits broad-based industrial scale against focused innovation. This analysis will determine which corporate strategy presents superior risk-adjusted returns for a diversified healthcare portfolio in 2026.
Table of contents
Companies Overview
Stryker Corporation and Insulet Corporation both shape the medical devices landscape with distinct strategic footprints.
Stryker Corporation: A Medical Technology Powerhouse
Stryker dominates the medical devices industry through diversified offerings in MedSurg, Neurotechnology, Orthopaedics, and Spine. It generates revenue primarily from implants, surgical equipment, and neurotechnology products sold worldwide. In 2026, the company sharpened its focus on advanced surgical systems and implant innovation to sustain its global leadership and fulfill complex healthcare needs.
Insulet Corporation: Innovator in Insulin Delivery
Insulet stands out as a specialist in insulin delivery systems for diabetes management. It earns most revenue from its Omnipod System, a tubeless, wearable device paired with a wireless diabetes manager. In 2026, Insulet concentrated on expanding its market reach through distributors and pharmacies across multiple regions, reinforcing its niche in diabetes care technology.
Strategic Collision: Similarities & Divergences
Both companies operate within the medical device sector but differ sharply in scale and product breadth. Stryker pursues a broad, diversified portfolio with a global footprint, while Insulet champions focused innovation in diabetes care. Their primary battleground lies in specialized medical technology adoption. Stryker offers a stable, diversified investment profile, whereas Insulet appeals to growth-oriented investors targeting diabetes device advancements.
Income Statement Comparison
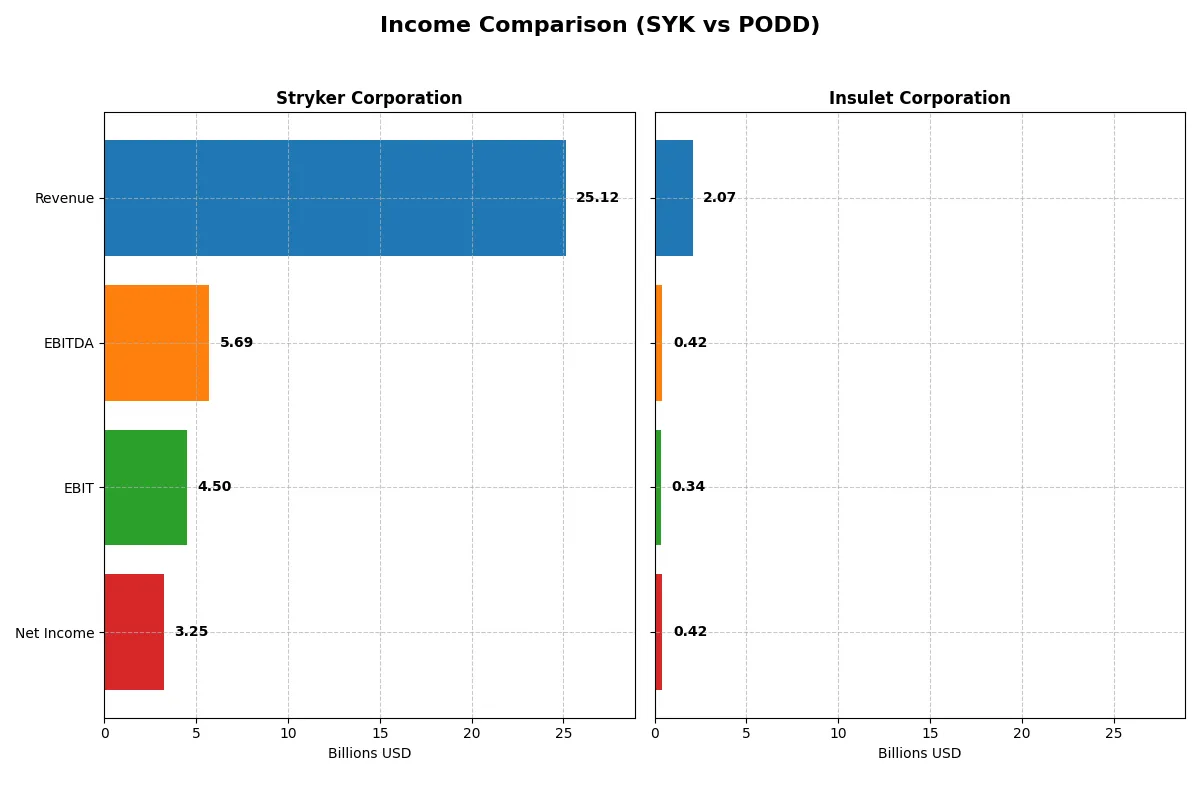
This data dissects the core profitability and scalability of both corporate engines to reveal who dominates the bottom line:
| Metric | Stryker Corporation (SYK) | Insulet Corporation (PODD) |
|---|---|---|
| Revenue | 25.1B | 2.07B |
| Cost of Revenue | 9.68B | 626M |
| Operating Expenses | 9.81B | 1.14B |
| Gross Profit | 15.4B | 1.45B |
| EBITDA | 5.69B | 424M |
| EBIT | 4.50B | 343M |
| Interest Expense | 0 | 43M |
| Net Income | 3.25B | 418M |
| EPS | 8.49 | 5.97 |
| Fiscal Year | 2025 | 2024 |
Income Statement Analysis: The Bottom-Line Duel
The following income statement comparison reveals how efficiently each company converts sales into profit and manages expenses over recent years.
Stryker Corporation Analysis
Stryker’s revenue climbed steadily from $17.1B in 2021 to $25.1B in 2025, reflecting robust top-line growth. Net income followed, rising from $2B to $3.2B, though net margin slightly declined recently. Gross margin remains strong at 61.4%, while operating efficiency improved with EBIT margin near 18%, signaling solid operational control and scale momentum.
Insulet Corporation Analysis
Insulet’s revenue surged dramatically from $904M in 2020 to $2.07B in 2024, showcasing impressive growth velocity. Net income exploded from $7M to $418M, lifting net margin to 20.2%. Gross margin stands out at nearly 70%, and EBIT margin at 16.6% reflects efficient cost management amid rapid expansion, highlighting exceptional profitability gains and margin expansion.
Growth Momentum vs. Scale and Stability
Insulet dominates in growth, with over 129% revenue increase and a 6050% rise in net income over five years. Stryker boasts larger absolute profits and scale, with steady margin health and consistent earnings. Investors favoring high growth and margin expansion may lean toward Insulet, while those prioritizing stability and established scale might prefer Stryker’s proven operational efficiency.
Financial Ratios Comparison
These vital ratios act as a diagnostic tool to expose the underlying fiscal health, valuation premiums, and capital efficiency of the companies compared below:
| Ratios | Stryker Corporation (SYK) | Insulet Corporation (PODD) |
|---|---|---|
| ROE | 14.5% | 34.5% |
| ROIC | 7.4% | 11.7% |
| P/E | 41.4 | 43.7 |
| P/B | 6.0 | 15.1 |
| Current Ratio | 1.89 | 3.54 |
| Quick Ratio | 1.21 | 2.73 |
| D/E (Debt-to-Equity) | 0.66 | 1.17 |
| Debt-to-Assets | 31.1% | 46.1% |
| Interest Coverage | 0 | 7.23 |
| Asset Turnover | 0.52 | 0.67 |
| Fixed Asset Turnover | 6.48 | 2.73 |
| Payout ratio | 39.6% | 0% |
| Dividend yield | 0.96% | 0% |
| Fiscal Year | 2025 | 2024 |
Efficiency & Valuation Duel: The Vital Signs
Ratios act as a company’s DNA, unveiling hidden operational strengths and risks that numbers alone cannot fully reveal.
Stryker Corporation
Stryker posts a solid 14.5% ROE and a favorable 12.9% net margin, showing consistent profitability. However, its P/E at 41.4 and P/B at 6.0 mark it as stretched in valuation. Dividend yield remains low at 0.96%, suggesting modest returns with reinvestment focused on R&D and growth.
Insulet Corporation
Insulet impresses with a high 34.5% ROE and 20.2% net margin, indicating operational efficiency. Yet, its P/E of 43.7 and P/B of 15.1 are expensive, reflecting growth expectations. It pays no dividends, channeling capital aggressively into R&D to fuel future expansion and innovation.
Valuation Stretch vs. Operational Efficiency
Stryker offers a more balanced risk-reward profile with stable profitability and moderate leverage despite a stretched valuation. Insulet’s superior returns come with higher valuation and leverage risks. Investors seeking growth may prefer Insulet’s aggressive profile, while those prioritizing stability might lean toward Stryker.
Which one offers the Superior Shareholder Reward?
I see Stryker Corporation (SYK) pays a steady dividend with a yield near 0.95% and a payout ratio around 40%, comfortably covered by its robust free cash flow (11.2/share). Its buyback program complements returns, sustaining shareholder value. Insulet Corporation (PODD) does not pay dividends, instead reinvesting aggressively in growth, reflected in high R&D and capital expenditures. PODD’s buybacks are minimal, focusing on expansion over distributions. SYK’s balanced distributions and strong cash flow make its shareholder rewards more sustainable and attractive in 2026. I conclude SYK offers a superior total return profile versus PODD’s growth-only strategy, given market volatility and capital allocation discipline.
Comparative Score Analysis: The Strategic Profile
The radar chart reveals the fundamental DNA and strategic trade-offs of Stryker Corporation and Insulet Corporation:
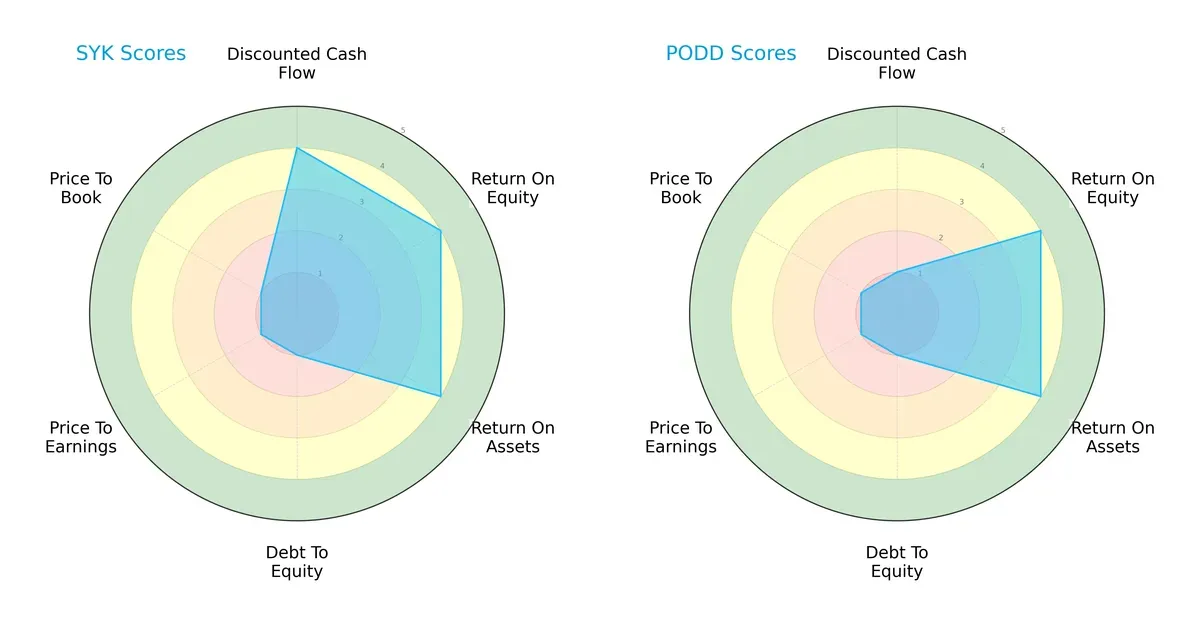
Stryker leads with a strong DCF score of 4, showcasing robust cash flow projections. Both firms share high ROE and ROA scores at 4, indicating efficient profit generation and asset use. Debt-to-equity and valuation metrics are weak (score 1) for both, signaling financial leverage and market pricing risks. Stryker’s profile is more balanced due to superior cash flow, while Insulet leans heavily on operational efficiency without valuation support.
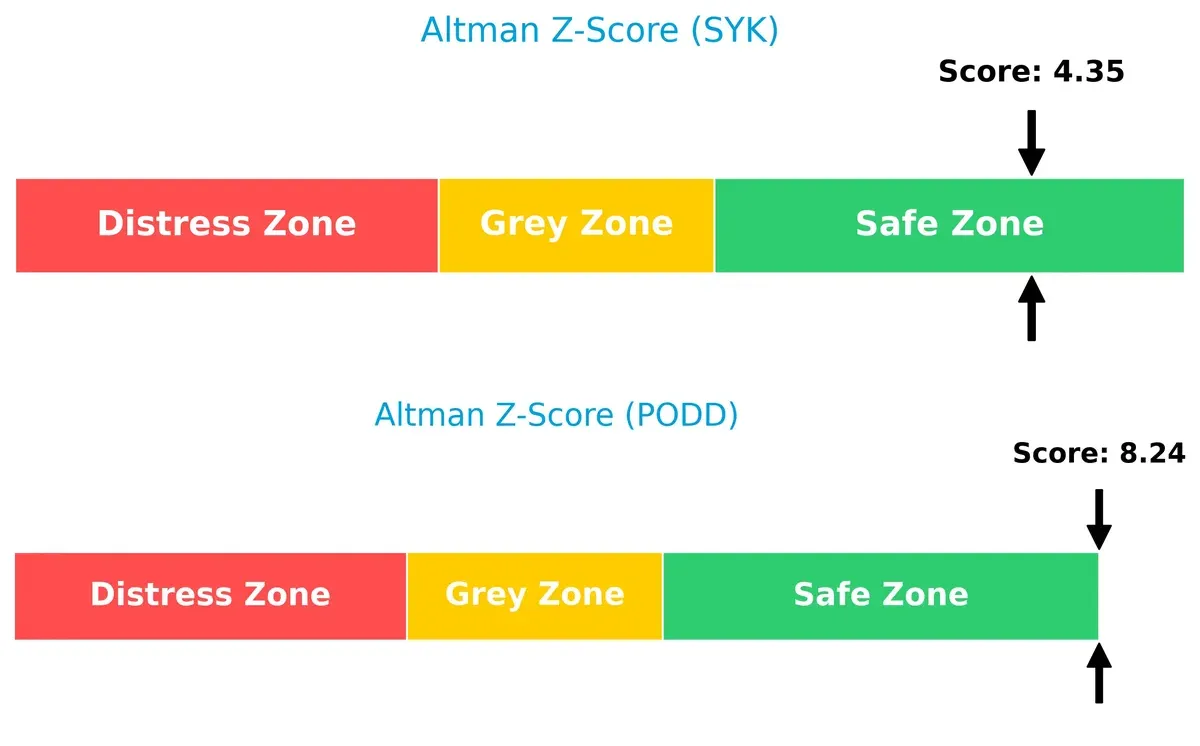
Bankruptcy Risk: Solvency Showdown
Insulet’s Altman Z-Score of 8.24 far exceeds Stryker’s 4.35, both safely in the safe zone, but Insulet enjoys a stronger buffer against bankruptcy risk in this cycle:
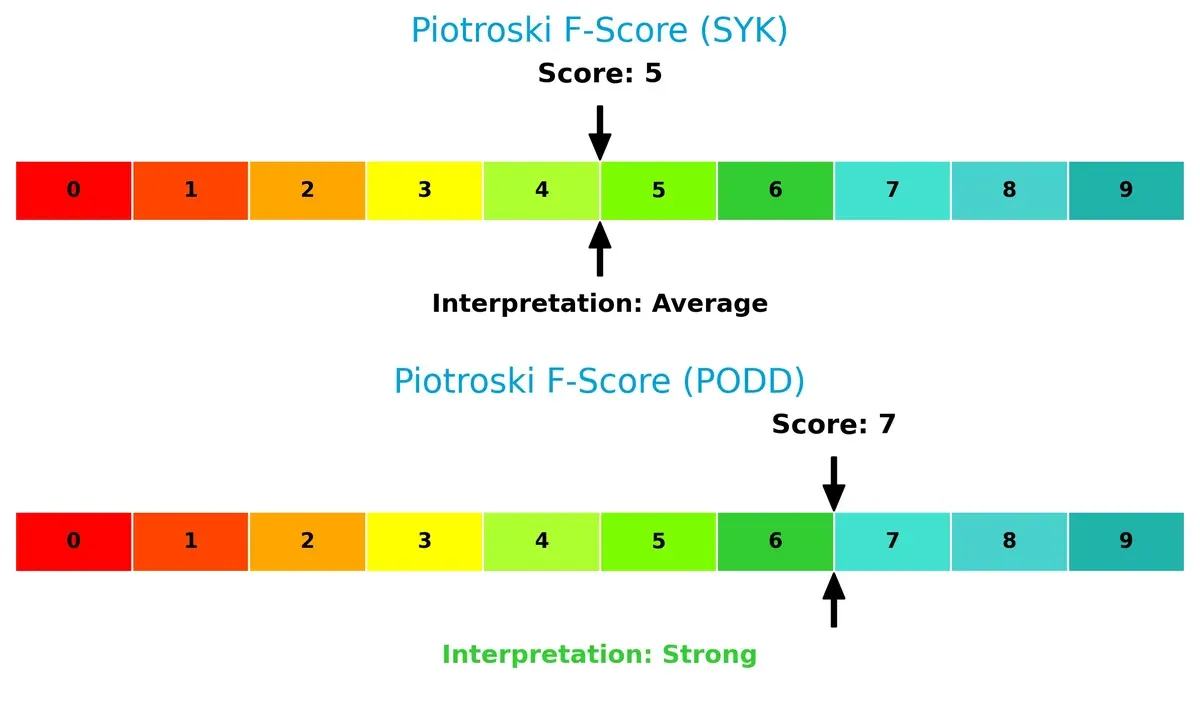
Financial Health: Quality of Operations
Insulet scores a robust 7 on the Piotroski F-Score, outperforming Stryker’s average 5, indicating healthier internal operations and fewer red flags:
How are the two companies positioned?
This section dissects the operational DNA of Stryker and Insulet by comparing their revenue distribution and internal dynamics. The goal is to confront their economic moats and identify the more resilient competitive advantage in today’s market.
Revenue Segmentation: The Strategic Mix
This visual comparison dissects how Stryker Corporation and Insulet Corporation diversify their income streams and where their primary sector bets lie:
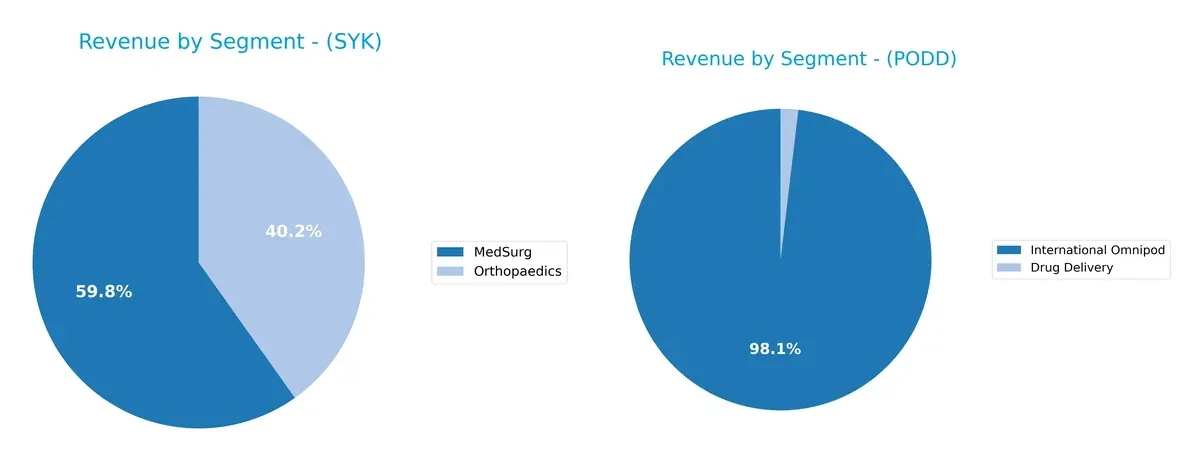
Stryker dominates with a balanced mix: MedSurg at $13.5B and Orthopaedics near $9.1B in 2024. Insulet pivots heavily on International Omnipod at $2.0B, with minimal Drug Delivery revenue of $39M. Stryker’s diversified segments reduce concentration risk and reinforce ecosystem lock-in. Insulet’s reliance on one segment increases exposure to market shifts but highlights deep infrastructure dominance in diabetic care.
Strengths and Weaknesses Comparison
This table compares the strengths and weaknesses of Stryker Corporation and Insulet Corporation:
Stryker Corporation Strengths
- Diverse product segments in MedSurg and Orthopaedics generating multi-billion revenues
- Strong global presence with significant US, EMEA, and Asia Pacific sales
- Favorable net margin and WACC indicating cost-efficient capital use
- Solid liquidity ratios support financial stability
- High fixed asset turnover reflects efficient asset use
Insulet Corporation Strengths
- High profitability metrics including net margin, ROE, and ROIC
- Strong quick ratio and interest coverage indicating good short-term liquidity and debt service
- Growing international revenue in Omnipod segment
- Favorable net margin supports operational efficiency
Stryker Corporation Weaknesses
- Elevated PE and PB ratios suggest possible overvaluation risk
- Dividend yield below 1% may deter income-focused investors
- Neutral leverage metrics require monitoring
- ROIC slightly below WACC signals cautious capital returns
- Moderate asset turnover could limit growth efficiency
Insulet Corporation Weaknesses
- Unfavorable high PE and PB ratios indicate valuation concerns
- Current ratio unusually high but marked unfavorable, possibly inefficient asset use
- Elevated debt-to-equity ratio raises financial risk
- Zero dividend yield limits shareholder income
- Neutral WACC may pressure cost of capital management
Stryker’s strengths lie in its diversified revenue streams and global footprint, supporting steady financial health. Insulet excels in profitability but faces valuation and leverage challenges. These contrasts shape each company’s strategic priorities and risk profiles.
The Moat Duel: Analyzing Competitive Defensibility
A structural moat is the only reliable shield protecting long-term profits from relentless competition erosion. Here’s how Stryker and Insulet stack up:
Stryker Corporation: Broad Product Portfolio with Scale Advantage
Stryker’s moat stems from its diverse medical device segments and global scale. Despite a strong 61% gross margin, its ROIC trails WACC and declines, signaling weakening competitive advantage in 2026.
Insulet Corporation: Innovation-Driven Niche Dominance
Insulet’s moat is its innovative Omnipod system creating high switching costs. Its ROIC outpaces WACC with rapid growth, reflecting strengthening profitability and expansion potential in insulin delivery.
Verdict: Scale Breadth vs. Innovation Depth
Insulet’s growing ROIC and focused innovation deliver a deeper moat than Stryker’s scale, which currently suffers value erosion. Insulet appears better poised to defend and extend market share.
Which stock offers better returns?
Stock prices over the past year reveal contrasting momentum: Stryker Corporation edges up modestly, while Insulet Corporation surges strongly but shows recent sharp pullback.
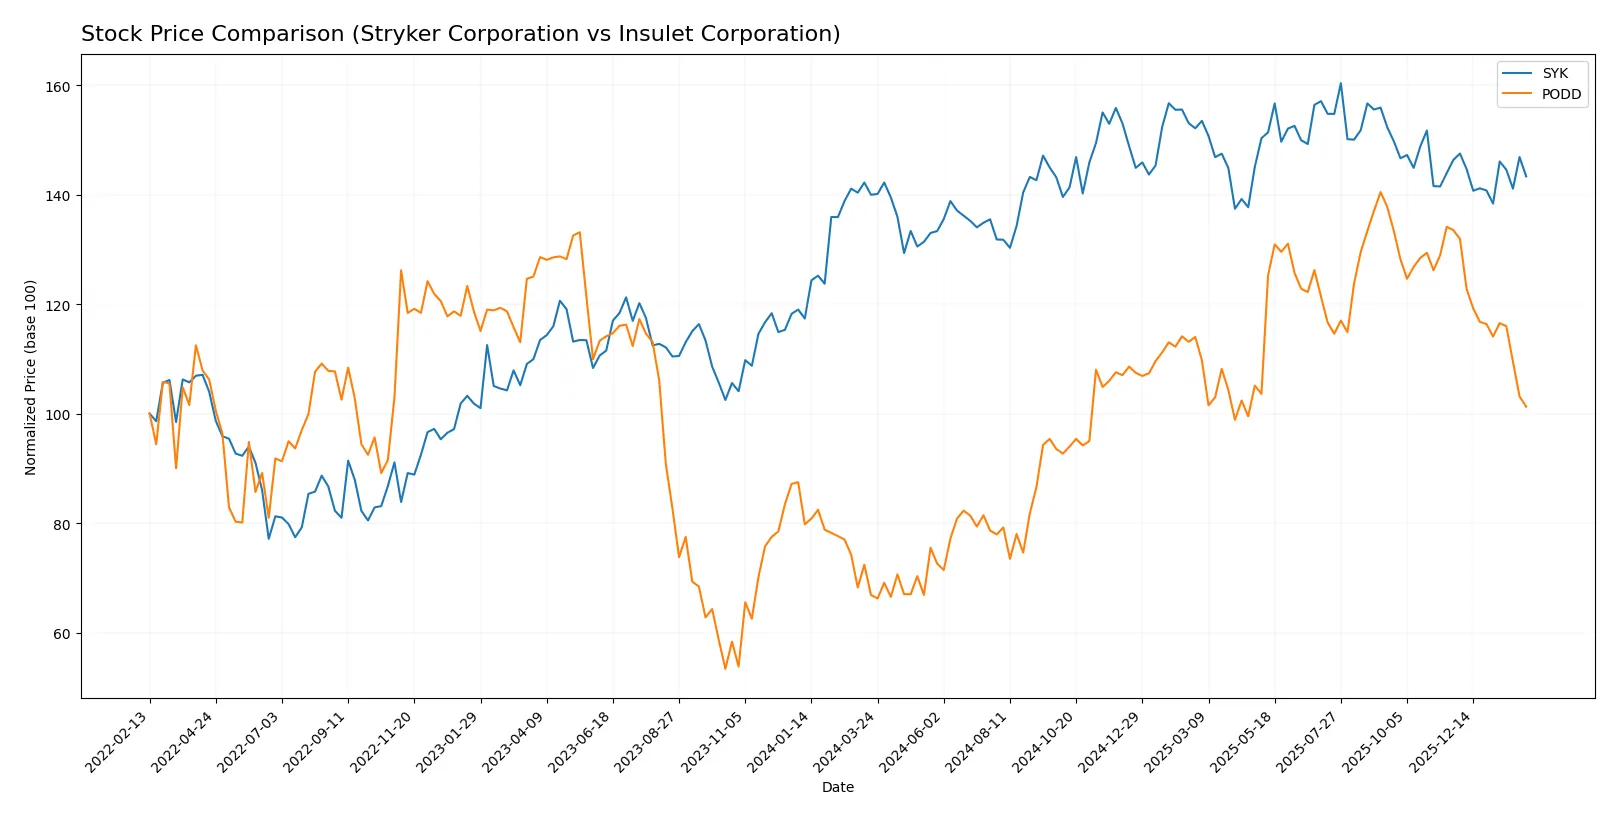
Trend Comparison
Stryker Corporation’s price rose 2.4% over the past 12 months, signaling a bullish trend with decelerating momentum and a high-low range between 325.43 and 403.53.
Insulet Corporation’s stock gained 51.48% over the same period, also bullish with deceleration, but recent months show a 24.14% decline, indicating heightened volatility and weakening trend slope.
Insulet’s overall performance outpaced Stryker’s by a wide margin despite recent weakness, delivering the highest market return among the two stocks.
Target Prices
Analysts present a bullish target consensus for Stryker Corporation and Insulet Corporation.
| Company | Target Low | Target High | Consensus |
|---|---|---|---|
| Stryker Corporation | 390 | 469 | 425.58 |
| Insulet Corporation | 274 | 450 | 376.27 |
Both stocks show significant upside potential relative to current prices. Stryker trades near 361, well below its 426 consensus target. Insulet’s price at 251 also lags its 376 consensus, suggesting room for appreciation.

Don’t Let Luck Decide Your Entry Point
Optimize your entry points with our advanced ProRealTime indicators. You’ll get efficient buy signals with precise price targets for maximum performance. Start outperforming now!
How do institutions grade them?
Stryker Corporation Grades
The following table summarizes recent institutional grades for Stryker Corporation.
| Grading Company | Action | New Grade | Date |
|---|---|---|---|
| BTIG | Maintain | Buy | 2026-01-30 |
| Needham | Maintain | Buy | 2026-01-30 |
| Bernstein | Maintain | Outperform | 2026-01-09 |
| Citizens | Upgrade | Market Outperform | 2025-12-19 |
| Truist Securities | Maintain | Hold | 2025-12-18 |
| Citigroup | Maintain | Buy | 2025-12-11 |
| Needham | Maintain | Buy | 2025-11-14 |
| Truist Securities | Maintain | Hold | 2025-11-14 |
| Wells Fargo | Maintain | Overweight | 2025-11-14 |
| BTIG | Maintain | Buy | 2025-11-14 |
Insulet Corporation Grades
The following table summarizes recent institutional grades for Insulet Corporation.
| Grading Company | Action | New Grade | Date |
|---|---|---|---|
| Barclays | Downgrade | Underweight | 2026-01-12 |
| Bernstein | Maintain | Outperform | 2026-01-09 |
| Truist Securities | Maintain | Buy | 2025-12-18 |
| Canaccord Genuity | Maintain | Buy | 2025-12-17 |
| Canaccord Genuity | Maintain | Buy | 2025-11-24 |
| BTIG | Maintain | Buy | 2025-11-21 |
| Truist Securities | Maintain | Buy | 2025-11-21 |
| RBC Capital | Maintain | Outperform | 2025-11-21 |
| UBS | Upgrade | Buy | 2025-11-19 |
| BTIG | Maintain | Buy | 2025-11-13 |
Which company has the best grades?
Stryker Corporation holds consistently positive grades, with multiple Buy and Outperform ratings and only a few Hold opinions. Insulet Corporation shows mostly Buy and Outperform ratings but includes a recent downgrade to Underweight by Barclays. Investors may view Stryker’s broader consensus as more stable, while Insulet’s mixed signals could imply higher risk.
Risks specific to each company
The following categories identify the critical pressure points and systemic threats facing both firms in the 2026 market environment:
1. Market & Competition
Stryker Corporation
- Operates in a mature med-tech sector with broad product portfolio and strong global presence, facing intense competition from established players.
Insulet Corporation
- Focused on insulin delivery devices, competing in a niche but rapidly evolving diabetes care market with significant innovation pressure.
2. Capital Structure & Debt
Stryker Corporation
- Moderate debt-to-equity ratio (0.66), signaling balanced leverage and solid interest coverage.
Insulet Corporation
- Higher leverage with debt-to-equity at 1.17, raising financial risk despite adequate interest coverage.
3. Stock Volatility
Stryker Corporation
- Beta of 0.87 suggests below-market volatility, appealing for risk-averse investors.
Insulet Corporation
- Beta of 1.42 implies higher stock price swings, increasing investor risk exposure.
4. Regulatory & Legal
Stryker Corporation
- Broad regulatory scrutiny across multiple device categories and global markets, requiring constant compliance vigilance.
Insulet Corporation
- Faces regulatory risks tied to medical device approvals and evolving diabetes treatment standards.
5. Supply Chain & Operations
Stryker Corporation
- Large-scale operations with diversified suppliers, mitigating supply chain risks though complexity remains high.
Insulet Corporation
- Smaller scale and concentration in specialized components increase vulnerability to supply disruptions.
6. ESG & Climate Transition
Stryker Corporation
- Established ESG initiatives with focus on sustainable manufacturing and product lifecycle management.
Insulet Corporation
- Emerging ESG programs, with growing investor attention on environmental impact and social responsibility.
7. Geopolitical Exposure
Stryker Corporation
- Global footprint across 75 countries exposes it to geopolitical risks but also diversifies revenue streams.
Insulet Corporation
- International sales concentrated in fewer regions, increasing sensitivity to regional geopolitical tensions.
Which company shows a better risk-adjusted profile?
Stryker’s most impactful risk lies in its complex regulatory and global operational challenges. Insulet’s greatest risk is its elevated financial leverage combined with stock volatility. Despite higher debt, Insulet’s strong Altman Z-Score and Piotroski Score indicate solid financial health. However, Stryker’s lower beta and balanced capital structure convey a more stable risk-adjusted profile in 2026. The disparity in leverage and volatility confirms Stryker’s advantage for risk-conscious investors.
Final Verdict: Which stock to choose?
Stryker Corporation’s superpower lies in its robust operational efficiency and consistent revenue growth, making it a reliable cash generator in the healthcare sector. Its point of vigilance is the declining return on invested capital, signaling caution for long-term value creation. Stryker fits well in portfolios seeking steady, moderate growth with resilience.
Insulet Corporation benefits from a strategic moat centered on innovation in diabetes management and strong recurring revenue streams. While it carries higher leverage and valuation multiples than Stryker, its growing profitability and solid balance sheet offer a safer profile for growth investors. Insulet suits portfolios focused on dynamic growth with an appetite for innovation risk.
If you prioritize operational stability and reliable cash flow, Stryker outshines as the compelling choice due to its proven efficiency. However, if you seek aggressive growth fueled by innovation and expanding profitability, Insulet offers better upside potential despite higher risk and valuation premiums. Each company aligns with distinct investor profiles balancing growth and prudence.
Disclaimer: Investment carries a risk of loss of initial capital. The past performance is not a reliable indicator of future results. Be sure to understand risks before making an investment decision.
Go Further
I encourage you to read the complete analyses of Stryker Corporation and Insulet Corporation to enhance your investment decisions: