Home > Comparison > Industrials > XYL vs IR
The strategic rivalry between Xylem Inc. and Ingersoll Rand Inc. shapes the industrial machinery sector’s future. Xylem focuses on engineered water solutions, blending hardware and smart technology. Ingersoll Rand delivers broad industrial and precision fluid management products with a strong aftermarket presence. This head-to-head reflects a contest between specialized innovation and diversified industrial strength. This analysis aims to identify which trajectory offers superior risk-adjusted returns for a well-rounded portfolio.
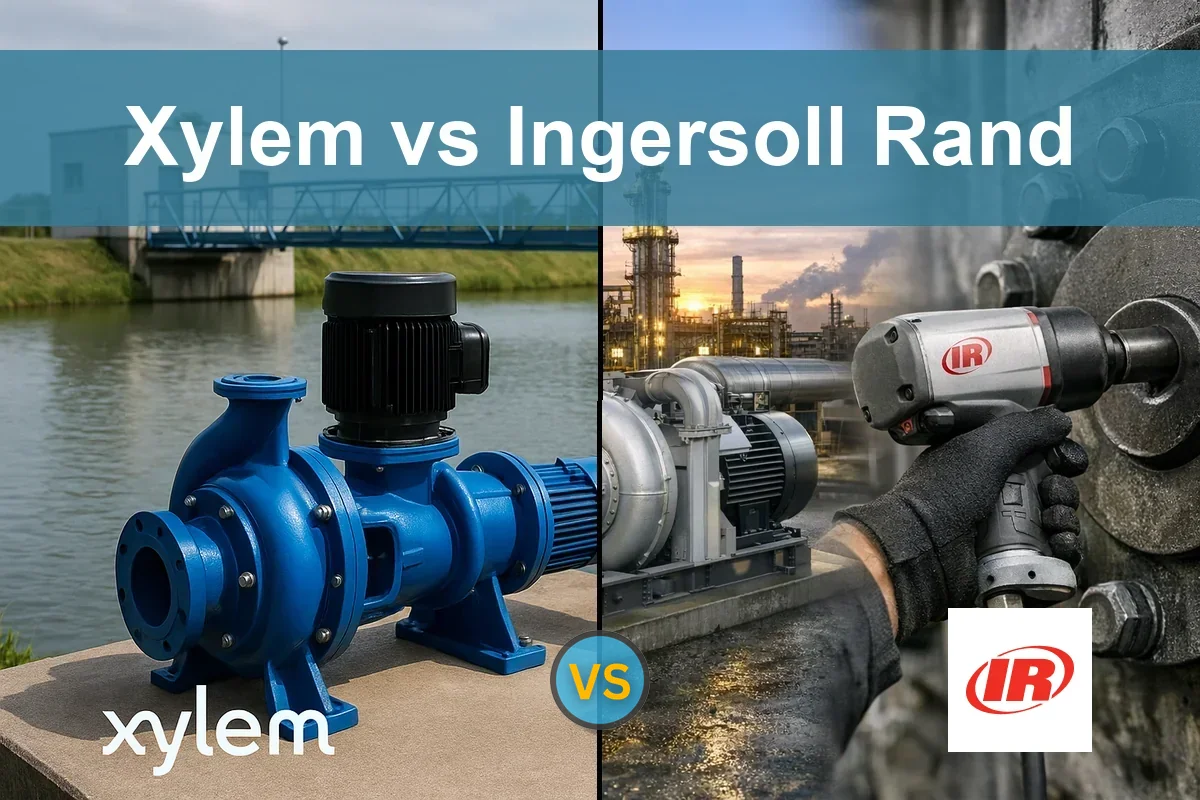
Table of contents
Companies Overview
Xylem Inc. and Ingersoll Rand Inc. dominate the industrial machinery sector with distinct market footprints.
Xylem Inc.: Water Solutions Innovator
Xylem Inc. leads in engineered water technology, generating revenue through water and wastewater pumps, controls, and smart metering solutions. Its 2026 strategy focuses on expanding its Water Infrastructure and Measurement & Control segments, emphasizing digital analytics and remote monitoring to enhance water management efficiency globally.
Ingersoll Rand Inc.: Industrial Powerhouse
Ingersoll Rand Inc. specializes in air, fluid, and energy technologies, earning revenue from compressors, pumps, power tools, and fluid management systems. In 2026, it prioritizes innovation across its Industrial Technologies and Precision and Science segments, targeting mission-critical applications in manufacturing, medical, and energy sectors worldwide.
Strategic Collision: Similarities & Divergences
Both companies operate in industrial machinery but differ in focus—Xylem champions water-centric solutions while Ingersoll Rand leans on diversified industrial technologies. Their primary battleground lies in fluid management systems and critical infrastructure markets. Xylem offers a specialized water technology profile, whereas Ingersoll Rand presents a broader industrial exposure, reflecting distinct investment risk and growth dynamics.
Income Statement Comparison
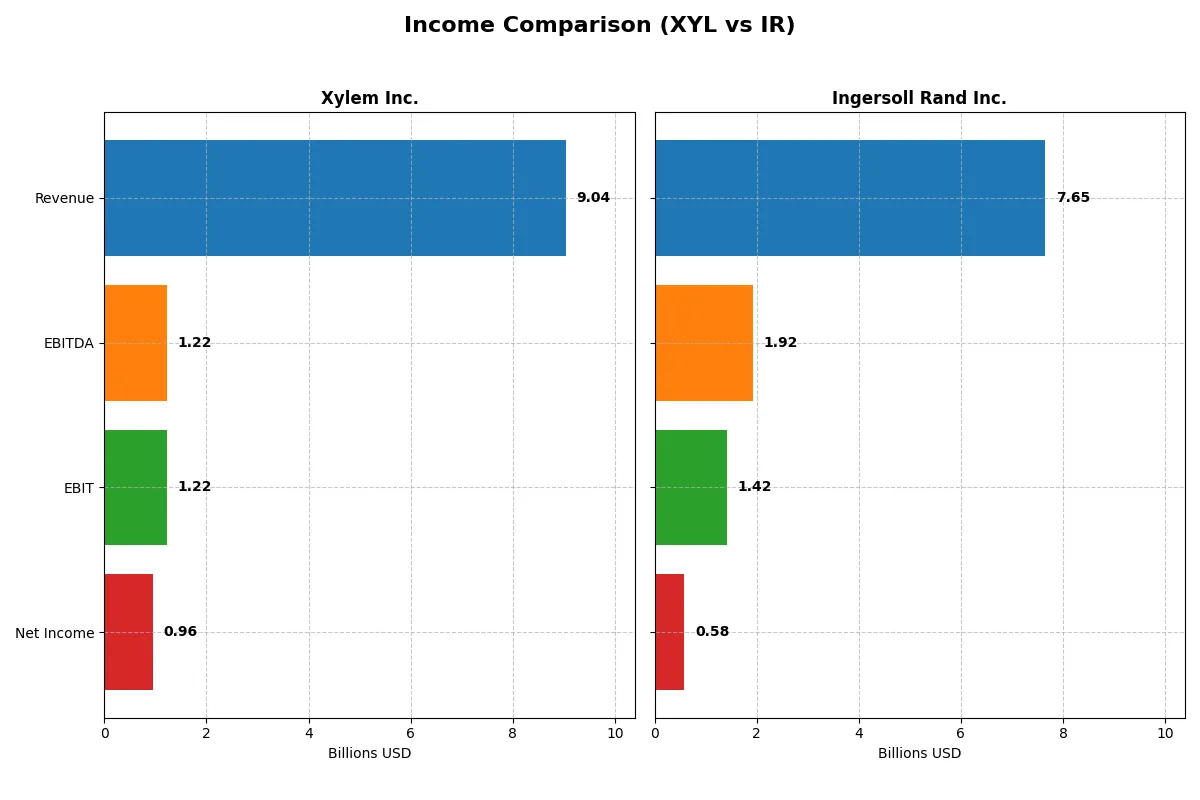
This data dissects the core profitability and scalability of both corporate engines to reveal who dominates the bottom line:
| Metric | Xylem Inc. (XYL) | Ingersoll Rand Inc. (IR) |
|---|---|---|
| Revenue | 9.0B | 7.7B |
| Cost of Revenue | 5.6B | 4.7B |
| Operating Expenses | 2.3B | 1.5B |
| Gross Profit | 3.5B | 2.9B |
| EBITDA | 1.2B | 1.9B |
| EBIT | 1.2B | 1.4B |
| Interest Expense | 29M | 254M |
| Net Income | 957M | 581M |
| EPS | 3.93 | 1.46 |
| Fiscal Year | 2025 | 2025 |
Income Statement Analysis: The Bottom-Line Duel
This income statement comparison reveals which company manages its revenues and costs most efficiently to maximize shareholder value.
Xylem Inc. Analysis
Xylem’s revenue climbed steadily from 5.2B in 2021 to 9.0B in 2025, with net income surging from 427M to 957M. Gross margins hold strong near 38.5%, while net margin improves to 10.6%, signaling disciplined cost control. The latest year shows solid momentum with EBIT and EPS up over 7%, confirming operational efficiency gains.
Ingersoll Rand Inc. Analysis
Ingersoll Rand’s revenue rose from 5.1B in 2021 to 7.7B in 2025, but net income growth stalled, reaching just 581M in 2025. Despite a robust 38.5% gross margin, net margin contracted to 7.6% amid rising interest and other expenses. The most recent year saw a decline in gross profit and net margin, flagging pressure on profitability.
Margin Power vs. Revenue Scale
Xylem outperforms Ingersoll Rand with higher net margin and stronger profit growth over five years. While both companies achieved similar revenue expansion, Xylem’s superior cost management and margin improvement mark it as the efficiency leader. For investors, Xylem’s profile offers a more compelling blend of growth and profitability.
Financial Ratios Comparison
These vital ratios act as a diagnostic tool to expose the underlying fiscal health, valuation premiums, and capital efficiency of the companies compared below:
| Ratios | Xylem Inc. (XYL) | Ingersoll Rand Inc. (IR) |
|---|---|---|
| ROE | 8.3% | 5.8% |
| ROIC | 6.4% | 6.4% |
| P/E | 34.6 | 54.2 |
| P/B | 2.9 | 3.1 |
| Current Ratio | 1.63 | 2.06 |
| Quick Ratio | 1.28 | 1.49 |
| D/E | 0.17 | 0.47 |
| Debt-to-Assets | 11.0% | 26.1% |
| Interest Coverage | 42.2 | 5.6 |
| Asset Turnover | 0.51 | 0.42 |
| Fixed Asset Turnover | 7.80 | 8.22 |
| Payout Ratio | 40.9% | 5.5% |
| Dividend Yield | 1.18% | 0.10% |
| Fiscal Year | 2025 | 2025 |
Efficiency & Valuation Duel: The Vital Signs
Financial ratios act as a company’s DNA, unveiling hidden risks and operational strengths crucial for investment insight.
Xylem Inc.
Xylem shows a mixed profitability profile with an 8.34% ROE flagged as unfavorable despite a solid 10.59% net margin. The valuation appears stretched, trading at a P/E of 34.64, above average benchmarks. Shareholder returns come through a modest 1.18% dividend yield, signaling balanced capital allocation between income and growth investments.
Ingersoll Rand Inc.
Ingersoll Rand presents weaker profitability with a 5.76% ROE and a neutral 7.6% net margin. Its valuation is more stretched, with a P/E of 54.24 and a higher price-to-book ratio of 3.13. The company offers minimal dividend yield at 0.1%, indicating a focus on reinvestment or other capital uses rather than direct shareholder payouts.
Valuation Discipline vs. Profitability Efficiency
Xylem offers a better balance between profitability and valuation, combining decent margins with a more reasonable P/E. Ingersoll Rand’s higher valuation and lower returns raise risk concerns. Investors prioritizing operational efficiency and moderate income may find Xylem’s profile more fitting.
Which one offers the Superior Shareholder Reward?
Xylem Inc. (XYL) yields ~1.18% with a 41% payout ratio and moderate buybacks, balancing steady dividends with growth. Ingersoll Rand (IR) yields a mere 0.1%, with under 6% payout and aggressive buybacks, signaling capital return via repurchases. I see XYL’s dividend plus buyback combo as more sustainable and attractive for 2026 total returns. IR’s low payout ratio limits income but may fuel growth, yet its higher valuation risks temper enthusiasm. For income-focused investors, XYL leads; for capital appreciation, IR offers potential but with higher risk. Overall, I favor XYL’s balanced distribution strategy for superior shareholder reward in 2026.
Comparative Score Analysis: The Strategic Profile
The radar chart reveals the fundamental DNA and trade-offs of Xylem Inc. and Ingersoll Rand Inc., highlighting their respective strengths across key financial metrics:
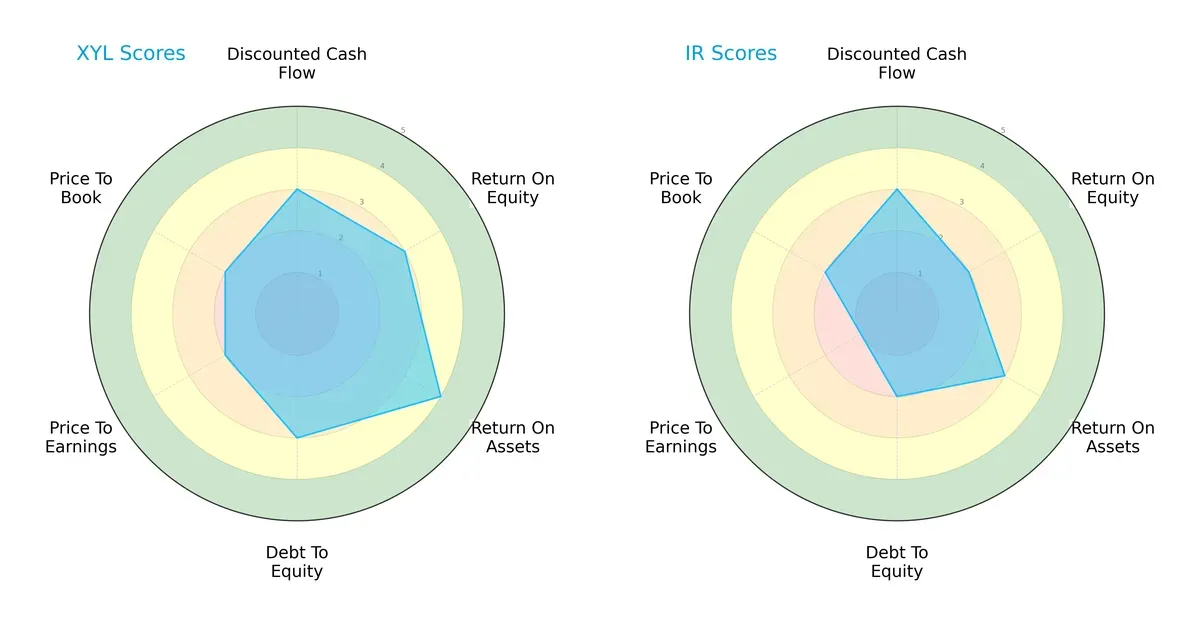
Xylem Inc. shows a more balanced profile with moderate scores in DCF, ROE, and debt-to-equity, and a favorable ROA score. In contrast, Ingersoll Rand leans on a moderate DCF but lags in ROE, debt-to-equity, and valuation metrics. Xylem’s diversified strengths suggest better operational efficiency and financial stability, while Ingersoll Rand relies more heavily on specific edges.
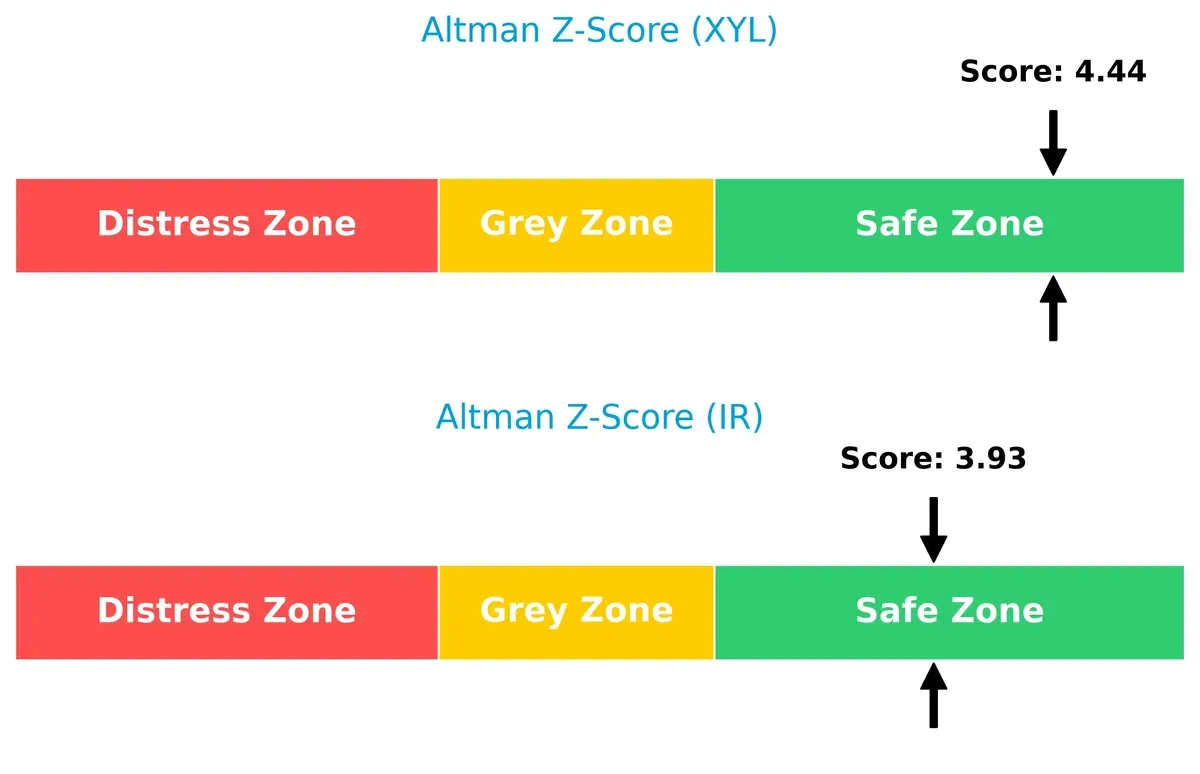
Bankruptcy Risk: Solvency Showdown
Xylem’s Altman Z-Score of 4.44 versus Ingersoll Rand’s 3.93 places both comfortably in the safe zone, though Xylem holds a clearer buffer against bankruptcy risk in this late-cycle environment:
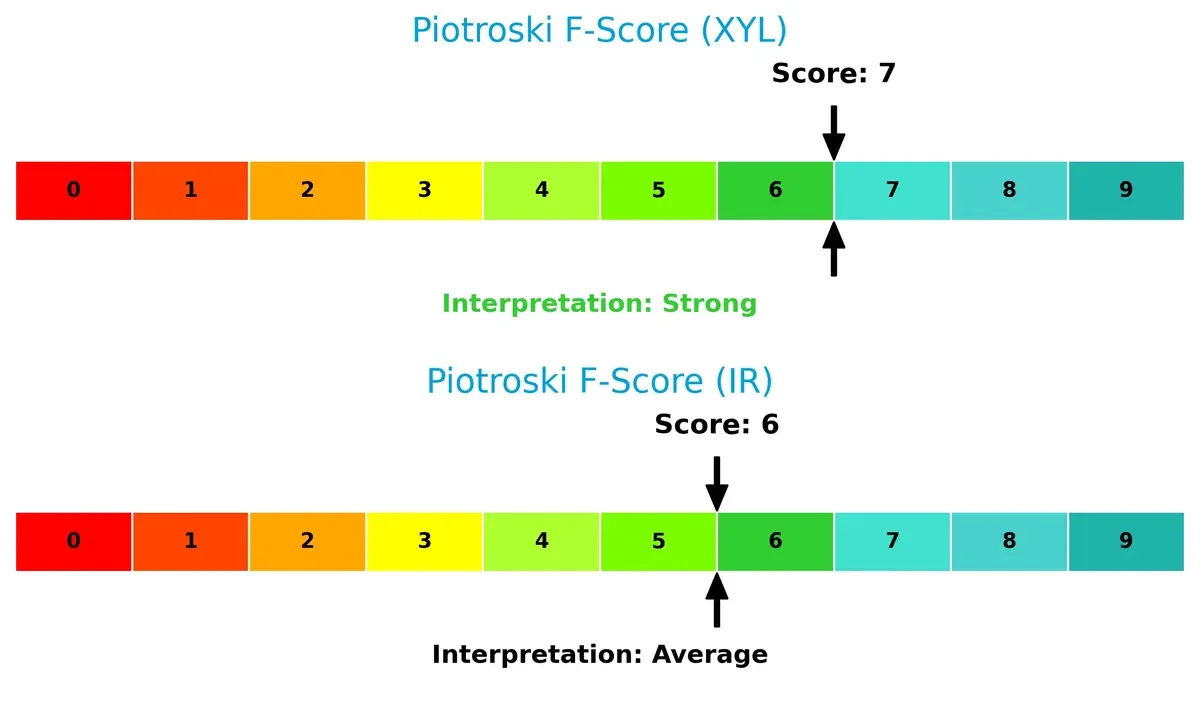
Financial Health: Quality of Operations
Xylem scores a strong 7 on the Piotroski F-Score, signaling robust internal financial health. Ingersoll Rand’s 6, while decent, indicates slightly weaker fundamentals and potential red flags in operational metrics:
How are the two companies positioned?
This section dissects the operational DNA of Xylem and Ingersoll Rand by comparing their revenue distribution by segment and internal dynamics. The final objective is to confront their economic moats to identify which model offers the most resilient competitive advantage today.
Revenue Segmentation: The Strategic Mix
This visual comparison dissects how Xylem Inc. and Ingersoll Rand Inc. diversify their income streams and where their primary sector bets lie:
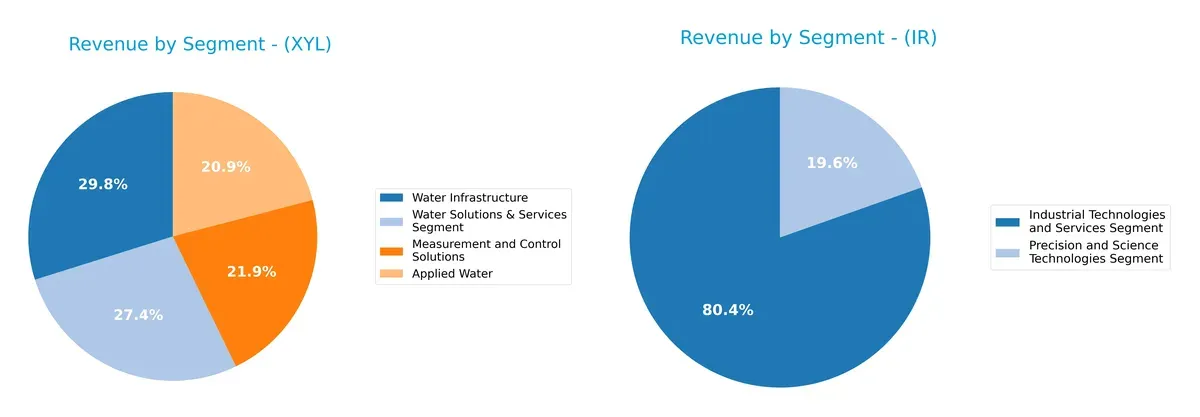
Xylem’s revenue splits across four key water-related segments, with Water Infrastructure anchoring at $2.55B in 2024, showing moderate diversification. Ingersoll Rand heavily pivots on Industrial Technologies and Services, generating $5.82B, dwarfing its Precision and Science Technologies segment at $1.42B. Xylem’s balanced mix reduces concentration risk, while Ingersoll Rand leverages industrial scale but faces higher dependency on its dominant segment.
Strengths and Weaknesses Comparison
This table compares the strengths and weaknesses of Xylem Inc. and Ingersoll Rand Inc. based on diversification, profitability, financials, innovation, global presence, and market share:
Xylem Inc. Strengths
- Diverse revenue streams across Applied Water, Measurement & Control, Water Infrastructure, and Services
- Favorable net margin at 10.59%
- Strong liquidity with current ratio 1.62 and quick ratio 1.28
- Low leverage with debt-to-assets 11.01%
- Robust interest coverage at 42.17x
- Solid fixed asset turnover at 7.8
Ingersoll Rand Inc. Strengths
- Broad segments including Industrial Technologies and Precision Sciences
- Favorable liquidity ratios with current ratio 2.06 and quick ratio 1.49
- Moderate leverage with debt-to-assets 26.15%
- Positive interest coverage at 5.58x
- Strong fixed asset turnover at 8.22
Xylem Inc. Weaknesses
- Return on equity (ROE) at 8.34% is unfavorable compared to benchmarks
- Price-to-earnings (PE) ratio high at 34.64, indicating expensive valuation
- Moderate return on invested capital (ROIC) at 6.42% below WACC of 8.75%
- Neutral asset turnover at 0.51, limiting efficiency
Ingersoll Rand Inc. Weaknesses
- Lower net margin at 7.6%, less profitable than peers
- ROE weak at 5.76%
- High PE ratio of 54.24 suggests overvaluation risk
- Unfavorable price-to-book (PB) at 3.13
- Asset turnover low at 0.42, indicating less efficient use of assets
- Dividend yield very low at 0.1%
Xylem’s strengths lie in diversified water-focused segments and strong financial health, although valuation and profitability metrics lag. Ingersoll Rand shows operational breadth and solid liquidity but struggles with profitability and asset efficiency, suggesting areas for strategic improvement.
The Moat Duel: Analyzing Competitive Defensibility
A structural moat is the only reliable shield preserving a company’s long-term profits from relentless competition erosion:
Xylem Inc.: Intangible Assets and Innovation Edge
Xylem’s competitive edge lies in its patented water technology and integrated smart solutions, reflected in stable margins near 38%. Yet, declining ROIC signals risk, despite growth from expanding global water infrastructure markets in 2026.
Ingersoll Rand Inc.: Operational Efficiency and Market Reach
Ingersoll Rand leverages scale and diverse industrial tech brands, supporting a superior 18.5% EBIT margin. Its ROIC trend climbs sharply, indicating improving capital efficiency, with potential upside in precision fluid management innovations.
Verdict: Innovation Intangibles vs. Operational Scale
Xylem’s moat is deeper in unique technology but weakening financially. Ingersoll Rand’s operational efficiency and improving ROIC present a wider, more sustainable moat. I see Ingersoll Rand better positioned to defend and expand market share.
Which stock offers better returns?
The past year shows contrasting price dynamics: Xylem Inc. edged slightly down with decelerating losses, while Ingersoll Rand Inc. posted steady gains with accelerating momentum.
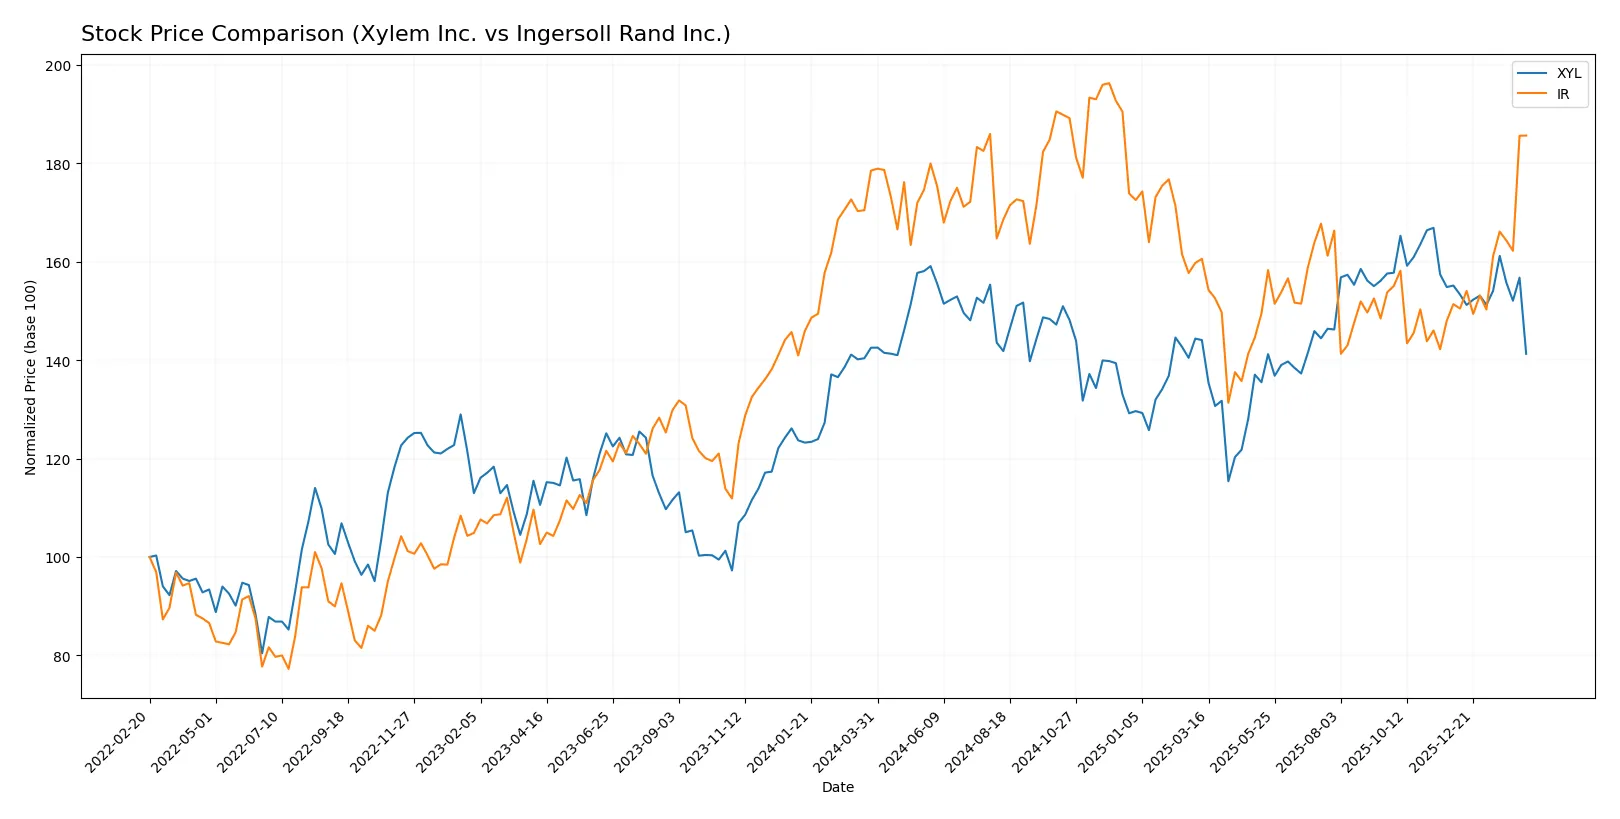
Trend Comparison
Xylem Inc.’s stock declined 0.87% over the past 12 months, reflecting a bearish trend with decelerating losses. The price ranged between 104.6 and 151.31, showing moderate volatility (9.59 std dev).
Ingersoll Rand Inc. gained 3.99% over the same period, marking a bullish trend with accelerating upward momentum. Its price fluctuated from 69.7 to 104.17, with slightly lower volatility (8.19 std dev).
Ingersoll Rand outperformed Xylem, delivering positive returns and stronger trend acceleration, while Xylem’s slight loss and deceleration indicate weaker market performance.
Target Prices
Analysts present a clear target consensus for both Xylem Inc. and Ingersoll Rand Inc.
| Company | Target Low | Target High | Consensus |
|---|---|---|---|
| Xylem Inc. | 138 | 176 | 162.67 |
| Ingersoll Rand Inc. | 87 | 100 | 93 |
The target consensus for Xylem Inc. exceeds its current price of 128.09, signaling bullish analyst sentiment. Ingersoll Rand’s consensus price is slightly below its current price of 98.52, suggesting a more cautious outlook.

Don’t Let Luck Decide Your Entry Point
Optimize your entry points with our advanced ProRealTime indicators. You’ll get efficient buy signals with precise price targets for maximum performance. Start outperforming now!
How do institutions grade them?
The following tables summarize recent institutional grades for Xylem Inc. and Ingersoll Rand Inc.:
Xylem Inc. Grades
This table presents recent grades issued by reputable financial institutions for Xylem Inc.
| Grading Company | Action | New Grade | Date |
|---|---|---|---|
| Citigroup | Maintain | Buy | 2026-02-11 |
| Stifel | Maintain | Buy | 2026-02-11 |
| RBC Capital | Maintain | Outperform | 2026-02-11 |
| Barclays | Maintain | Overweight | 2026-02-11 |
| Barclays | Maintain | Overweight | 2026-01-07 |
| Mizuho | Maintain | Neutral | 2026-01-05 |
| TD Cowen | Maintain | Hold | 2025-12-05 |
| UBS | Maintain | Buy | 2025-11-06 |
| Stifel | Maintain | Buy | 2025-10-29 |
| RBC Capital | Maintain | Outperform | 2025-10-29 |
Ingersoll Rand Inc. Grades
This table shows recent grades provided by recognized institutions for Ingersoll Rand Inc.
| Grading Company | Action | New Grade | Date |
|---|---|---|---|
| Stifel | Maintain | Hold | 2026-01-23 |
| Citigroup | Maintain | Buy | 2026-01-12 |
| Wells Fargo | Maintain | Overweight | 2026-01-07 |
| Stifel | Maintain | Hold | 2025-12-16 |
| Citigroup | Maintain | Buy | 2025-12-08 |
| Citigroup | Maintain | Buy | 2025-11-03 |
| Baird | Maintain | Outperform | 2025-11-03 |
| Stifel | Maintain | Hold | 2025-10-20 |
| Wells Fargo | Maintain | Overweight | 2025-10-06 |
| Morgan Stanley | Maintain | Equal Weight | 2025-08-13 |
Which company has the best grades?
Xylem Inc. consistently receives Buy and Outperform ratings from multiple firms, indicating stronger institutional confidence. Ingersoll Rand Inc. has a mix of Hold and Buy grades but fewer Outperform ratings. This divergence may impact investor sentiment and portfolio positioning.
Risks specific to each company
The following categories identify the critical pressure points and systemic threats facing Xylem Inc. and Ingersoll Rand Inc. in the 2026 market environment:
1. Market & Competition
Xylem Inc.
- Faces strong competition in water technology with moderate net margin and ROIC near WACC, indicating slim economic moat.
Ingersoll Rand Inc.
- Competes across diverse industrial tech sectors with lower net margin and ROIC also near WACC, signaling competitive pressure.
2. Capital Structure & Debt
Xylem Inc.
- Maintains low debt-to-equity (0.17) and strong interest coverage (42.17), reflecting conservative leverage.
Ingersoll Rand Inc.
- Carries higher debt-to-equity (0.47) and weaker interest coverage (5.58), increasing financial risk under stress.
3. Stock Volatility
Xylem Inc.
- Beta of 1.16 suggests moderate volatility relative to market benchmarks.
Ingersoll Rand Inc.
- Higher beta of 1.31 implies greater stock price swings and market sensitivity.
4. Regulatory & Legal
Xylem Inc.
- Exposure to water regulations and environmental standards globally; risk of compliance costs.
Ingersoll Rand Inc.
- Faces regulatory scrutiny in air, fluid, and precision tech markets; potential for compliance and liability issues.
5. Supply Chain & Operations
Xylem Inc.
- Global supply chains for engineered products risk disruption; reliance on multiple suppliers.
Ingersoll Rand Inc.
- Complex multi-brand operations with exposure to supply chain bottlenecks across diverse segments.
6. ESG & Climate Transition
Xylem Inc.
- Positioned in water sustainability solutions; ESG initiatives critical for future growth and regulatory favor.
Ingersoll Rand Inc.
- Faces pressure to decarbonize industrial processes; ESG compliance increasingly vital amid climate policies.
7. Geopolitical Exposure
Xylem Inc.
- Operations span US, Europe, Asia Pacific; geopolitical instability could impact supply and sales.
Ingersoll Rand Inc.
- Similar global footprint including Middle East and Africa adds geopolitical risk to operations and logistics.
Which company shows a better risk-adjusted profile?
Xylem’s most impactful risk lies in market competition and margin pressure, but it benefits from a robust balance sheet and lower leverage. Ingersoll Rand faces significant financial risk due to higher debt and stock volatility. Xylem’s strong interest coverage and safer Altman Z-score signal a better risk-adjusted profile. Notably, Ingersoll Rand’s elevated P/E of 54.24 flags valuation risk amid weaker profitability, reinforcing my caution.
Final Verdict: Which stock to choose?
Xylem Inc. stands out for its operational efficiency and robust cash generation, making it a reliable cash machine in a capital-intensive industry. Its main point of vigilance is the declining return on invested capital, signaling potential value erosion. It suits investors seeking aggressive growth with a tolerance for cyclical pressure.
Ingersoll Rand’s strategic moat lies in its improving profitability and disciplined capital allocation, supported by strong operating returns and accelerating stock momentum. It offers better financial stability than Xylem but trades at a premium. It fits well in a GARP portfolio focused on steady growth with moderate risk.
If you prioritize dynamic cash flow and aggressive expansion, Xylem’s unmatched efficiency makes it the compelling choice despite its value destruction signals. However, if you seek growing profitability paired with superior stability, Ingersoll Rand outshines as a more balanced growth play with improving fundamentals.
Disclaimer: Investment carries a risk of loss of initial capital. The past performance is not a reliable indicator of future results. Be sure to understand risks before making an investment decision.
Go Further
I encourage you to read the complete analyses of Xylem Inc. and Ingersoll Rand Inc. to enhance your investment decisions: