In the dynamic world of industrial machinery, Symbotic Inc. and Ingersoll Rand Inc. stand out as influential players driving innovation and efficiency. Symbotic’s cutting-edge warehouse automation contrasts with Ingersoll Rand’s broad portfolio of mission-critical technologies spanning air, fluid, and energy solutions. Both companies compete in overlapping markets with distinct strategies, making this comparison essential. Join me as we explore which company presents the most compelling opportunity for your investment portfolio.
Table of contents
Companies Overview
I will begin the comparison between Symbotic Inc. and Ingersoll Rand Inc. by providing an overview of these two companies and their main differences.
Symbotic Inc. Overview
Symbotic Inc., based in Wilmington, Massachusetts, specializes in automation technology, delivering robotics and systems that enhance efficiency for retailers and wholesalers in the U.S. Its core offering, The Symbotic System, is a comprehensive warehouse automation solution designed to reduce operational costs and optimize inventory management. The company operates in the industrial machinery sector with a market cap of approximately 42.8B USD.
Ingersoll Rand Inc. Overview
Ingersoll Rand Inc., headquartered in Davidson, North Carolina, manufactures and markets a wide range of air, fluid, energy, specialty vehicle, and medical technologies across multiple global regions. It operates through Industrial Technologies and Services, and Precision and Science Technologies segments, serving diverse industries from manufacturing to healthcare. The company has a market cap near 33.8B USD and employs around 21,000 people.
Key similarities and differences
Both companies operate within the industrial machinery sector and provide technology-driven solutions aimed at improving operational efficiency. Symbotic focuses primarily on automation in warehouse environments, targeting retail and wholesale customers, while Ingersoll Rand offers a broader portfolio of mission-critical technologies across various industrial and medical markets. Additionally, Ingersoll Rand operates internationally with a significantly larger workforce compared to Symbotic’s U.S.-centric operations.
Income Statement Comparison
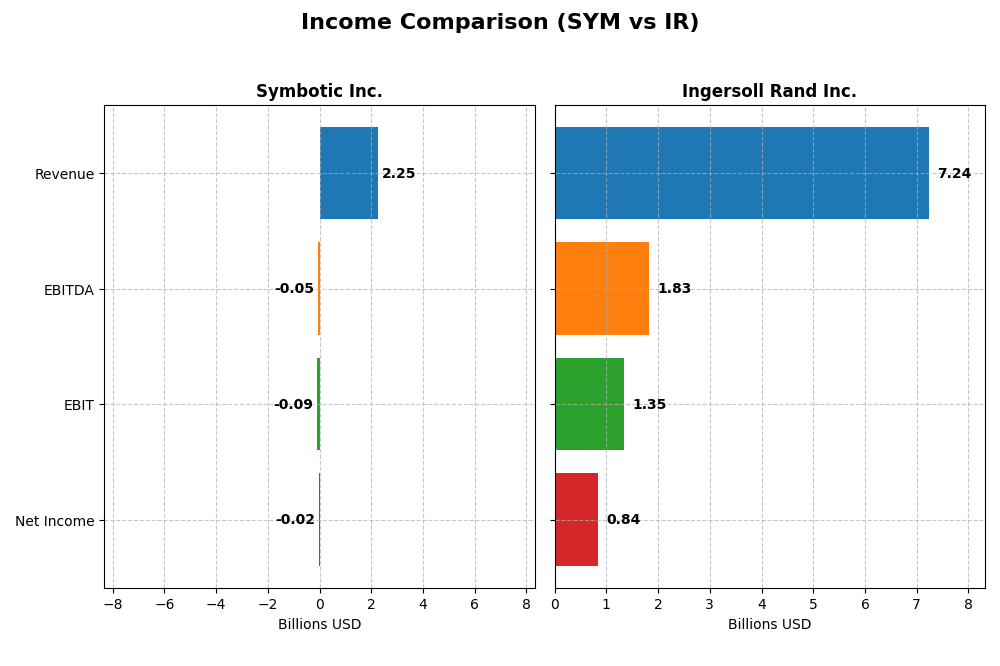
The table below presents a side-by-side comparison of the most recent fiscal year income statement figures for Symbotic Inc. and Ingersoll Rand Inc., highlighting key financial metrics.
| Metric | Symbotic Inc. (SYM) | Ingersoll Rand Inc. (IR) |
|---|---|---|
| Market Cap | 42.8B | 33.8B |
| Revenue | 2.25B | 7.24B |
| EBITDA | -48.0M | 1.83B |
| EBIT | -92.1M | 1.35B |
| Net Income | -17.0M | 839M |
| EPS | -0.16 | 2.08 |
| Fiscal Year | 2025 | 2024 |
Income Statement Interpretations
Symbotic Inc.
Symbotic Inc. has shown a strong revenue growth of 792% from 2021 to 2025, yet it remains unprofitable with a net loss of $17M in 2025. Gross margins are stable at 18.8%, but EBIT and net margins are negative, marking unfavorable profitability. The latest year saw revenue rise 26% while EBIT declined 11%, reflecting rising operating costs.
Ingersoll Rand Inc.
Ingersoll Rand reported steady revenue growth of 82% from 2020 to 2024, with a strong 2024 revenue of $7.24B and net income of $839M. Margins are robust; gross margin at 44%, EBIT margin near 19%, and net margin at 11.6%. The 2024 fiscal year showed moderate revenue growth of 5% and improved EBIT by 13%, signaling operational efficiency gains.
Which one has the stronger fundamentals?
Comparing fundamentals, Ingersoll Rand displays stronger income statement health with consistent profitability, higher margins, and favorable growth across key metrics. Symbotic’s rapid revenue expansion is offset by persistent losses and negative margins. Overall, Ingersoll Rand demonstrates more stable and favorable earnings quality and margin strength over the assessed periods.
Financial Ratios Comparison
The table below presents a side-by-side comparison of key financial ratios for Symbotic Inc. and Ingersoll Rand Inc. based on their most recent fiscal year data.
| Ratios | Symbotic Inc. (2025) | Ingersoll Rand Inc. (2024) |
|---|---|---|
| ROE | -7.65% | 8.24% |
| ROIC | -16.63% | 6.11% |
| P/E | -334.5 | 43.51 |
| P/B | 25.60 | 3.58 |
| Current Ratio | 1.08 | 2.29 |
| Quick Ratio | 0.99 | 1.71 |
| D/E (Debt-to-Equity) | 0.14 | 0.49 |
| Debt-to-Assets | 1.32% | 27.65% |
| Interest Coverage | 0 | 6.10 |
| Asset Turnover | 0.94 | 0.40 |
| Fixed Asset Turnover | 15.92 | 8.59 |
| Payout ratio | 0 | 3.85% |
| Dividend yield | 0% | 0.09% |
Interpretation of the Ratios
Symbotic Inc.
Symbotic’s ratios reveal several weaknesses: negative net margin (-0.75%) and return on equity (-7.65%), alongside a high price-to-book ratio of 25.6, signaling overvaluation concerns. However, it has favorable debt metrics and fixed asset turnover. The company does not pay dividends, likely reflecting its reinvestment focus amid ongoing losses and a high beta of 2.14 indicating elevated volatility.
Ingersoll Rand Inc.
Ingersoll Rand presents mixed ratios with a solid net margin of 11.59% and strong liquidity ratios, yet an unfavorable price-to-earnings ratio of 43.51 and modest returns on equity (8.24%). Its debt ratios and interest coverage are favorable, supporting financial stability. The company pays a modest dividend yield of 0.09%, suggesting cautious shareholder returns amid balanced operational performance.
Which one has the best ratios?
Ingersoll Rand holds a more favorable overall ratio profile, with half of its key ratios rated positively and stronger liquidity and profitability metrics. Symbotic shows significant profitability challenges and valuation concerns, despite some strengths in leverage and asset efficiency. Thus, Ingersoll Rand’s ratios are comparatively stronger, reflecting a more stable financial position.
Strategic Positioning
This section compares the strategic positioning of Symbotic Inc. and Ingersoll Rand Inc. regarding Market position, Key segments, and Exposure to technological disruption:
Symbotic Inc.
- Market cap of 42.8B with strong NASDAQ presence; higher beta indicates greater volatility.
- Focuses on warehouse automation systems and operational services primarily for US retailers and wholesalers.
- Provides robotics and automation technology that enhances efficiency but faces disruption risk from evolving automation tech.
Ingersoll Rand Inc.
- Market cap of 33.8B with NYSE listing; lower beta shows less volatility and established market stance.
- Operates two segments providing air, fluid, energy, and precision technologies globally across industries.
- Involved in diverse industrial and precision technologies, facing moderate disruption through innovation.
Symbotic Inc. vs Ingersoll Rand Inc. Positioning
Symbotic concentrates on automation for retail and wholesale sectors, leveraging robotics and software, while Ingersoll Rand pursues a diversified industrial technology strategy across multiple sectors and geographies. Symbotic’s narrower focus may limit market scope but enhances specialization; Ingersoll Rand’s breadth offers cross-sector resilience but complexity.
Which has the best competitive advantage?
Both companies currently shed value with ROIC below WACC; however, Ingersoll Rand shows improving profitability trends, indicating a slightly stronger potential moat compared to Symbotic’s declining returns and very unfavorable moat status.
Stock Comparison
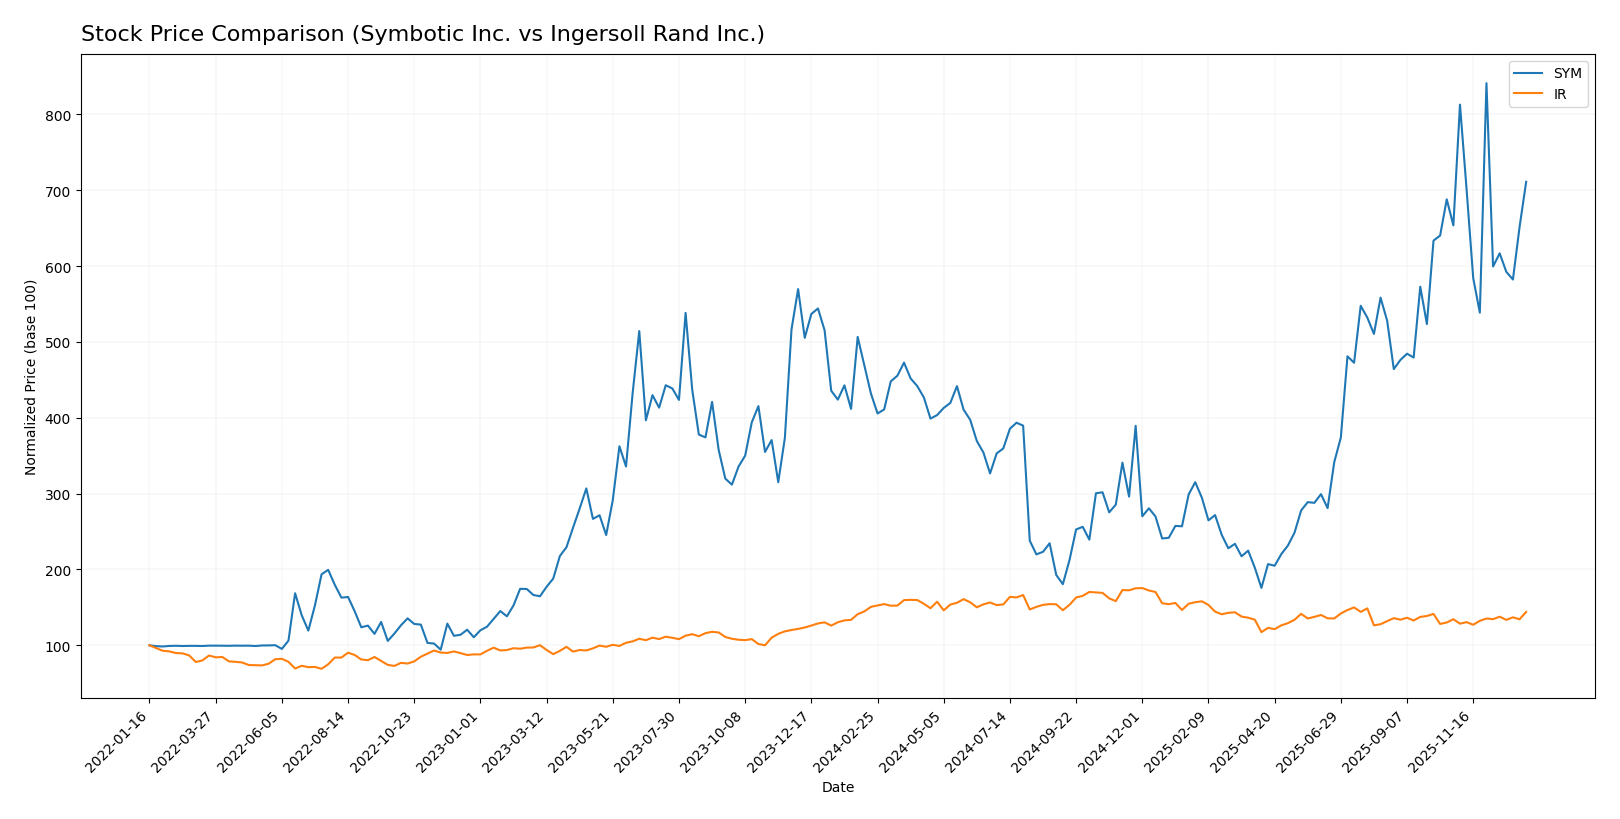
The stock price movements over the past 12 months reveal contrasting dynamics: Symbotic Inc. (SYM) experienced a strong bullish trend with significant gains, while Ingersoll Rand Inc. (IR) showed a bearish trajectory despite recent recovery signs.
Trend Analysis
Symbotic Inc. (SYM) posted a bullish trend with a 64.58% price increase over the past year, though the upward momentum has recently decelerated. The stock ranged from a low of 17.5 to a high of 83.77 with notable volatility (std deviation 15.15).
Ingersoll Rand Inc. (IR) registered a bearish trend with a 4.43% price decline over the same period, but recent data indicate a slight bullish reversal with a 7.18% increase and accelerating momentum. Price fluctuated between 69.7 and 104.17, showing moderate volatility (std deviation 8.07).
Comparing both stocks, Symbotic Inc. has delivered substantially higher market performance over the past year than Ingersoll Rand, driven by a strong overall price appreciation despite recent trend deceleration.
Target Prices
Analysts show a positive outlook with clear target price ranges for both Symbotic Inc. and Ingersoll Rand Inc.
| Company | Target High | Target Low | Consensus |
|---|---|---|---|
| Symbotic Inc. | 83 | 41 | 65.11 |
| Ingersoll Rand Inc. | 100 | 81 | 91.5 |
The consensus targets suggest moderate upside potential for Symbotic Inc., with its current price near the consensus, while Ingersoll Rand Inc. shows stronger expected growth as the consensus target exceeds its current price by a significant margin.
Analyst Opinions Comparison
This section compares analysts’ ratings and grades for Symbotic Inc. and Ingersoll Rand Inc.:
Rating Comparison
SYM Rating
- Rating: C+ with a very favorable status.
- Discounted Cash Flow Score: 5, very favorable.
- ROE Score: 1, very unfavorable.
- ROA Score: 1, very unfavorable.
- Debt To Equity Score: 3, moderate.
- Overall Score: 2, moderate.
IR Rating
- Rating: C+ with a very favorable status.
- Discounted Cash Flow Score: 3, moderate.
- ROE Score: 2, moderate.
- ROA Score: 3, moderate.
- Debt To Equity Score: 2, moderate.
- Overall Score: 2, moderate.
Which one is the best rated?
Both Symbotic Inc. and Ingersoll Rand Inc. share the same overall rating of C+ and moderate overall scores. However, Symbotic scores higher on discounted cash flow, while Ingersoll Rand shows better returns on equity and assets, indicating differing strengths in their financial profiles.
Scores Comparison
The scores comparison between Symbotic Inc. and Ingersoll Rand Inc. is as follows:
SYM Scores
- Altman Z-Score: 13.05, indicating a safe zone with very low bankruptcy risk.
- Piotroski Score: 3, classified as very weak financial strength.
IR Scores
- Altman Z-Score: 3.27, indicating a safe zone with low bankruptcy risk.
- Piotroski Score: 5, classified as average financial strength.
Which company has the best scores?
Symbotic Inc. has a significantly higher Altman Z-Score, suggesting stronger bankruptcy safety. However, Ingersoll Rand Inc. has a better Piotroski Score, indicating comparatively stronger financial health.
Grades Comparison
The grades assigned by leading financial institutions for Symbotic Inc. and Ingersoll Rand Inc. are as follows:
Symbotic Inc. Grades
The table below shows recent grade updates from various reputable grading companies for Symbotic Inc.:
| Grading Company | Action | New Grade | Date |
|---|---|---|---|
| Goldman Sachs | Sell | Sell | 2025-12-02 |
| Barclays | Maintain | Underweight | 2025-11-26 |
| Baird | Maintain | Neutral | 2025-11-26 |
| Craig-Hallum | Buy | Buy | 2025-11-25 |
| Northland Capital Markets | Maintain | Outperform | 2025-11-25 |
| Needham | Maintain | Buy | 2025-11-25 |
| Cantor Fitzgerald | Maintain | Overweight | 2025-11-25 |
| DA Davidson | Maintain | Neutral | 2025-11-25 |
| Citigroup | Maintain | Buy | 2025-11-25 |
| UBS | Sell | Sell | 2025-09-23 |
Symbotic’s grades show a mixed trend with several downgrades to Sell from Goldman Sachs and UBS, balanced by multiple Buy and Outperform ratings from other firms.
Ingersoll Rand Inc. Grades
The table below presents the latest grade assessments for Ingersoll Rand Inc. by major grading companies:
| Grading Company | Action | New Grade | Date |
|---|---|---|---|
| Wells Fargo | Maintain | Overweight | 2026-01-07 |
| Stifel | Maintain | Hold | 2025-12-16 |
| Citigroup | Maintain | Buy | 2025-12-08 |
| Citigroup | Maintain | Buy | 2025-11-03 |
| Baird | Maintain | Outperform | 2025-11-03 |
| Stifel | Maintain | Hold | 2025-10-20 |
| Wells Fargo | Maintain | Overweight | 2025-10-06 |
| Morgan Stanley | Maintain | Equal Weight | 2025-08-13 |
| Barclays | Maintain | Overweight | 2025-08-04 |
| Stifel | Maintain | Hold | 2025-08-04 |
Ingersoll Rand’s grades are consistently stable with no downgrades, maintaining several Overweight, Buy, and Outperform ratings.
Which company has the best grades?
Ingersoll Rand Inc. has generally received steadier and more positive grades than Symbotic Inc., which has seen some downgrades. This difference could influence investor confidence and risk perception between the two stocks.
Strengths and Weaknesses
The table below compares key strengths and weaknesses of Symbotic Inc. (SYM) and Ingersoll Rand Inc. (IR) based on their recent financial performance, market positioning, and operational metrics.
| Criterion | Symbotic Inc. (SYM) | Ingersoll Rand Inc. (IR) |
|---|---|---|
| Diversification | Moderate: Focused on systems and operation services, less diversified | Strong: Diverse industrial and precision technologies segments |
| Profitability | Weak: Negative net margin (-0.75%), ROIC -16.63%, value destroying | Moderate: Positive net margin (11.59%), ROIC 6.11%, slight value destruction but improving |
| Innovation | Moderate: Heavy investment in systems, but declining returns | Moderate to strong: Growing ROIC suggests improving innovation efficiency |
| Global presence | Limited information, likely niche market focus | Broad global industrial footprint, well established |
| Market Share | Growing revenue in systems segment, but overall value destruction | Large revenue base with steady growth, market leader in segments |
In summary, Symbotic faces challenges with profitability and value creation despite its growth in systems revenue. Ingersoll Rand shows stronger diversification and improving profitability, making it a somewhat more stable choice, though still with caution due to current slight value destruction.
Risk Analysis
Below is a comparative table summarizing key risks for Symbotic Inc. (SYM) and Ingersoll Rand Inc. (IR) based on the latest available data from 2025 and 2024 respectively.
| Metric | Symbotic Inc. (SYM) | Ingersoll Rand Inc. (IR) |
|---|---|---|
| Market Risk | High beta (2.143) indicates high volatility and sensitivity to market swings. | Moderate beta (1.332) suggests moderate market risk exposure. |
| Debt level | Low debt-to-equity (0.14), low debt-to-assets (1.32%), indicating low leverage. | Moderate leverage with debt-to-equity (0.49), debt-to-assets (27.65%). |
| Regulatory Risk | Moderate, as a US-based industrial automation firm, subject to industry regulations. | Moderate to high, operating globally with exposure to diverse regulatory environments. |
| Operational Risk | High due to negative profit margins (-0.75%) and unfavorable ROE (-7.65%) and ROIC (-16.63%). | Moderate, with positive net margin (11.59%) but lower asset turnover (0.4). |
| Environmental Risk | Potential risk related to industrial machinery production and automation technology. | Moderate, with operations in multiple sectors including energy and manufacturing. |
| Geopolitical Risk | Primarily US-focused, lower geopolitical risk. | Higher geopolitical exposure due to global operations across multiple regions. |
Symbotic shows higher market volatility and operational risk, mainly due to poor profitability and efficiency ratios, despite low debt levels. Ingersoll Rand benefits from stronger profitability and financial stability but faces moderate geopolitical and regulatory risks owing to its international footprint. Investors should weigh Symbotic’s growth potential against its operational challenges and Ingersoll Rand’s steadier but globally exposed profile.
Which Stock to Choose?
Symbotic Inc. (SYM) shows strong revenue growth of 792% over 2021-2025 but struggles with profitability, posting negative returns on equity (-7.65%) and invested capital (-16.63%). Its financial ratios are mixed, with favorable debt metrics but an overall slightly unfavorable profile. The company’s rating is moderate, supported by a very favorable discounted cash flow score but hampered by weak profitability scores.
Ingersoll Rand Inc. (IR) delivers steady income growth of 82% over 2020-2024 and maintains positive profitability with an 11.6% net margin and 8.2% return on equity. Its financial ratios lean slightly favorable with strong liquidity and manageable debt, though price multiples appear less attractive. The firm’s rating is also moderate, reflecting balanced strengths and weaknesses.
Considering ratings and income quality, IR might appear more favorable for investors seeking stability and improving profitability, while SYM’s rapid growth and valuation metrics could appeal to more risk-tolerant investors focused on growth opportunities. The choice could hinge on whether one prioritizes established profitability or dynamic expansion potential.
Disclaimer: Investment carries a risk of loss of initial capital. The past performance is not a reliable indicator of future results. Be sure to understand risks before making an investment decision.
Go Further
I encourage you to read the complete analyses of Symbotic Inc. and Ingersoll Rand Inc. to enhance your investment decisions: