Home > Comparison > Industrials > ROP vs IR
The strategic rivalry between Roper Technologies, Inc. and Ingersoll Rand Inc. shapes the industrial machinery sector’s evolution. Roper excels as a diversified software-focused innovator, integrating engineered products with cloud-based solutions. In contrast, Ingersoll Rand operates as a heavy-hitting manufacturer of mission-critical air, fluid, and specialty technologies. This analysis will reveal which company offers superior risk-adjusted returns amid shifting industrial demands and technological integration.
Table of contents
Companies Overview
Roper Technologies and Ingersoll Rand stand as key players in the industrial machinery sector, shaping global infrastructure and technology.
Roper Technologies, Inc.: Diverse Industrial Software & Equipment Leader
Roper Technologies dominates with a broad portfolio of software and engineered products. It generates revenue from cloud-based software solutions across insurance, healthcare, finance, and supply chain sectors. In 2026, the company focuses on expanding its digital transformation capabilities and precision instruments, enhancing integration of data analytics with industrial applications.
Ingersoll Rand Inc.: Industrial & Precision Technologies Powerhouse
Ingersoll Rand specializes in mission-critical air, fluid, and energy technologies. Its core revenue derives from designing and servicing compressors, pumps, and power tools across industrial and medical markets. The firm targets growth in precision and science technologies, emphasizing fluid management and energy-efficient equipment to meet evolving industrial demands.
Strategic Collision: Similarities & Divergences
Both companies operate in industrial machinery but differ in approach: Roper champions software-driven, diversified solutions, while Ingersoll Rand emphasizes hardware-centric, mission-critical technologies. Their primary competition lies in offering integrated industrial technologies to manufacturing and infrastructure sectors. Investors face distinct profiles: Roper’s innovation in digital platforms contrasts with Ingersoll Rand’s focus on durable, specialized equipment.
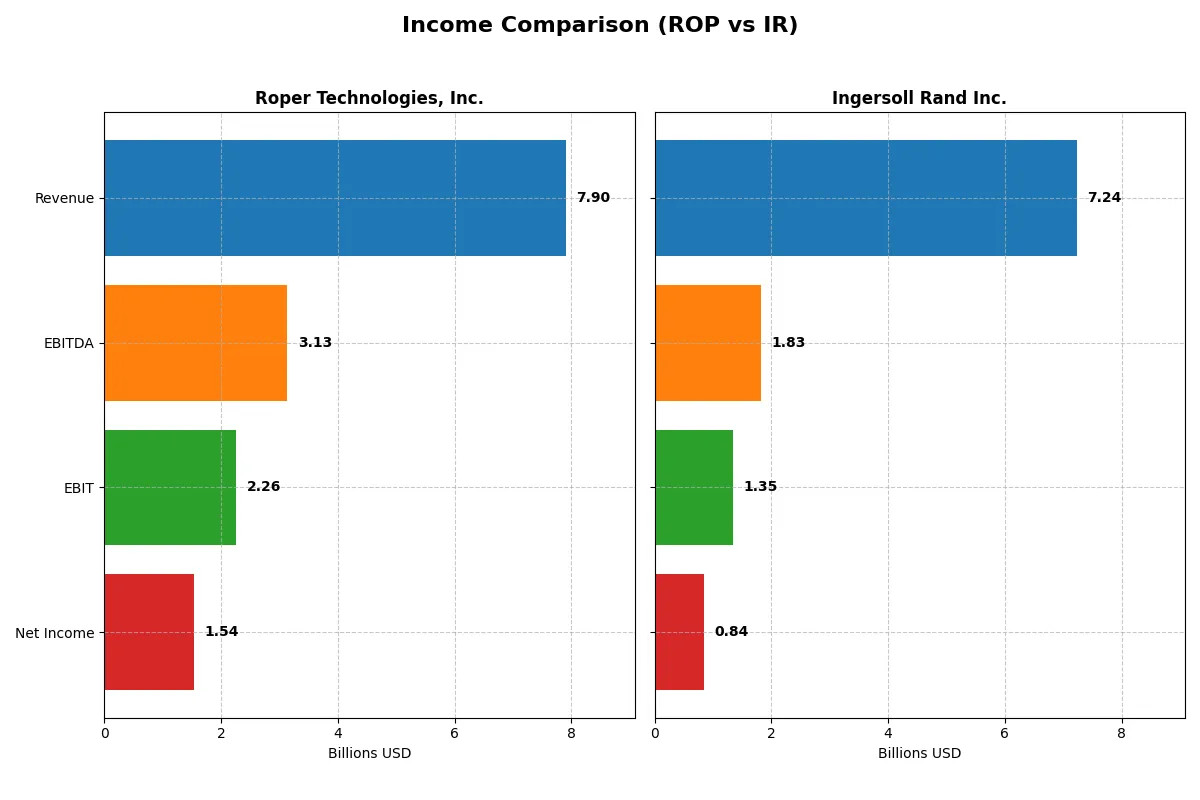
Income Statement Comparison
This data dissects the core profitability and scalability of both corporate engines to reveal who dominates the bottom line:
| Metric | Roper Technologies, Inc. (ROP) | Ingersoll Rand Inc. (IR) |
|---|---|---|
| Revenue | 7.9B | 7.2B |
| Cost of Revenue | 2.4B | 4.1B |
| Operating Expenses | 3.2B | 1.9B |
| Gross Profit | 5.5B | 3.2B |
| EBITDA | 3.1B | 1.8B |
| EBIT | 2.3B | 1.3B |
| Interest Expense | 325M | 213M |
| Net Income | 1.5B | 839M |
| EPS | 14.31 | 2.08 |
| Fiscal Year | 2025 | 2024 |
Income Statement Analysis: The Bottom-Line Duel
This income statement comparison reveals which company manages its revenues and profits with superior efficiency and momentum.
Roper Technologies, Inc. Analysis
Roper’s revenue climbed steadily from 4.8B in 2021 to 7.9B in 2025, with net income rising from 1.1B to 1.5B. Its gross margin holds strong at 69.2%, and net margin remains favorable near 19.4%. The 2025 results show solid revenue growth (12.3%) but a slight dip in net margin, signaling pressure on bottom-line efficiency despite scale.
Ingersoll Rand Inc. Analysis
Ingersoll Rand grew revenue from 3.97B in 2020 to 7.2B in 2024, with net income surging from a loss to 839M. Its gross margin of 43.8% and net margin of 11.6% trail Roper’s but show marked improvement. The 2024 year features healthy EBIT growth (13.3%) and expanding net margin, reflecting accelerating operational momentum and margin recovery.
Margin Power vs. Revenue Scale
Roper dominates with superior margins and consistent profitability, leveraging scale for steady growth. Ingersoll Rand impresses with rapid earnings turnaround and strong growth rates, though at lower margin levels. For investors prioritizing margin resilience and stable earnings, Roper offers a more robust profile, while Ingersoll Rand suits those seeking dynamic growth potential amid improving profitability.
Financial Ratios Comparison
These vital ratios act as a diagnostic tool to expose the underlying fiscal health, valuation premiums, and capital efficiency of the companies compared below:
| Ratios | Roper Technologies, Inc. (ROP) | Ingersoll Rand Inc. (IR) |
|---|---|---|
| ROE | 8.2% | 8.2% |
| ROIC | 5.5% | 6.1% |
| P/E | 36.0 | 43.5 |
| P/B | 2.95 | 3.58 |
| Current Ratio | 0.40 | 2.29 |
| Quick Ratio | 0.37 | 1.71 |
| D/E (Debt-to-Equity) | 0.41 | 0.49 |
| Debt-to-Assets | 24.5% | 27.7% |
| Interest Coverage | 7.7 | 6.1 |
| Asset Turnover | 0.22 | 0.40 |
| Fixed Asset Turnover | 47.0 | 8.6 |
| Payout Ratio | 21% | 3.9% |
| Dividend Yield | 0.58% | 0.09% |
| Fiscal Year | 2024 | 2024 |
Efficiency & Valuation Duel: The Vital Signs
Financial ratios act as the company’s DNA, unlocking insights on hidden risks and operational excellence that numbers alone can’t reveal.
Roper Technologies, Inc.
Roper shows a strong net margin of 19.44%, signaling operational efficiency. However, its ROE and ROIC stand at zero, a red flag for profitability sustainability. The P/E ratio of 31.06 suggests the stock is expensive. Dividend yield is modest at 0.74%, indicating limited shareholder returns amid reinvestment focus.
Ingersoll Rand Inc.
Ingersoll Rand posts a moderate net margin of 11.59% with an ROE of 8.24%, showing reasonable but not stellar profitability. Its P/E ratio at 43.51 marks the stock as stretched. The firm maintains a robust current ratio of 2.29, reflecting solid liquidity. Dividend yield is low at 0.09%, implying minimal cash returns.
Premium Valuation vs. Operational Safety
Roper offers higher operational efficiency but struggles with key returns metrics and carries a high valuation. Ingersoll Rand balances moderate profitability with better liquidity and a slightly more favorable ratio profile. Investors seeking operational strength may prefer Roper, while those prioritizing financial stability might lean towards Ingersoll Rand.
Which one offers the Superior Shareholder Reward?
I observe Roper Technologies (ROP) and Ingersoll Rand (IR) pursue contrasting shareholder reward strategies. ROP pays a consistent dividend with a 0.74% yield and a sustainable 23% payout ratio, supported by robust free cash flow coverage near 98%. Its buyback program remains moderate but steady, complementing dividends for total return. IR offers a minimal 0.09% dividend yield with a low 3.9% payout, prioritizing reinvestment and buybacks that have been aggressive recently, enhancing shareholder value through capital allocation. However, IR’s lower profit margins and lower FCF per share limit dividend sustainability. Historically, I find ROP’s balanced dividend and buyback mix offers a more reliable long-term total return profile than IR’s growth-focused but less mature distribution approach. Therefore, I judge Roper Technologies superior for shareholder reward in 2026.
Comparative Score Analysis: The Strategic Profile
The radar chart reveals the fundamental DNA and trade-offs of Roper Technologies and Ingersoll Rand, highlighting their competitive advantages and vulnerabilities:
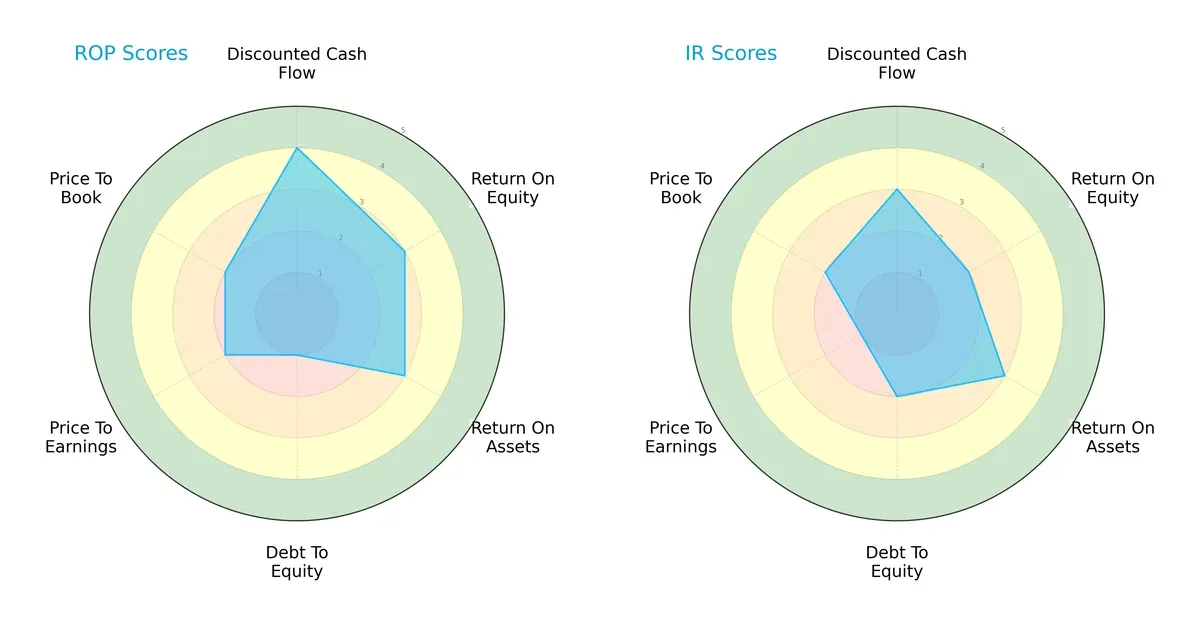
Roper shows strength in discounted cash flow (4) and moderate returns on equity and assets (3 each), but a very unfavorable debt-to-equity score (1) signals leverage risk. Ingersoll Rand has a more balanced debt profile (score 2) but lags in valuation metrics, particularly price-to-earnings (1). Overall, Roper relies on cash flow generation, while Ingersoll Rand offers steadier financial risk management.
Bankruptcy Risk: Solvency Showdown
The Altman Z-Score comparison highlights a solvency edge for Ingersoll Rand (3.54, safe zone) over Roper (2.70, grey zone):
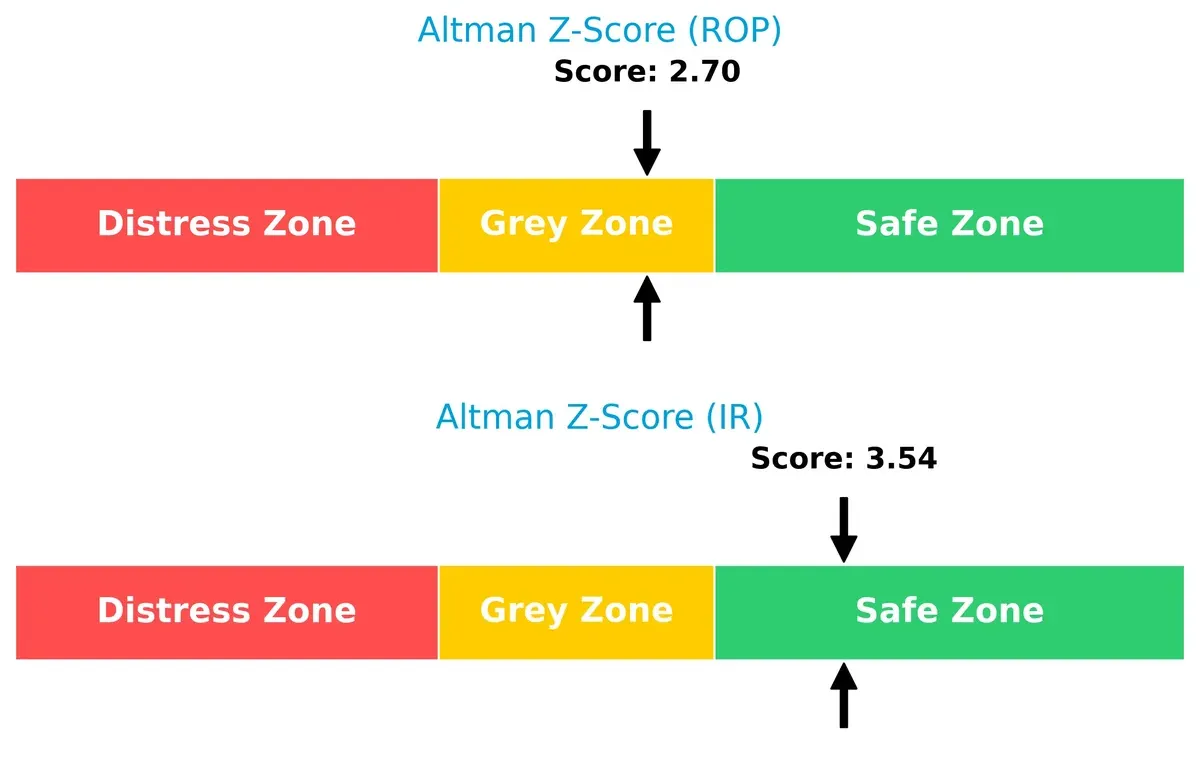
Ingersoll Rand’s score suggests a lower bankruptcy risk and stronger long-term survival prospects. Roper’s grey zone status warrants caution given current economic volatility.
Financial Health: Quality of Operations
Roper’s Piotroski F-Score of 9 signals peak financial health, outperforming Ingersoll Rand’s average score of 5:
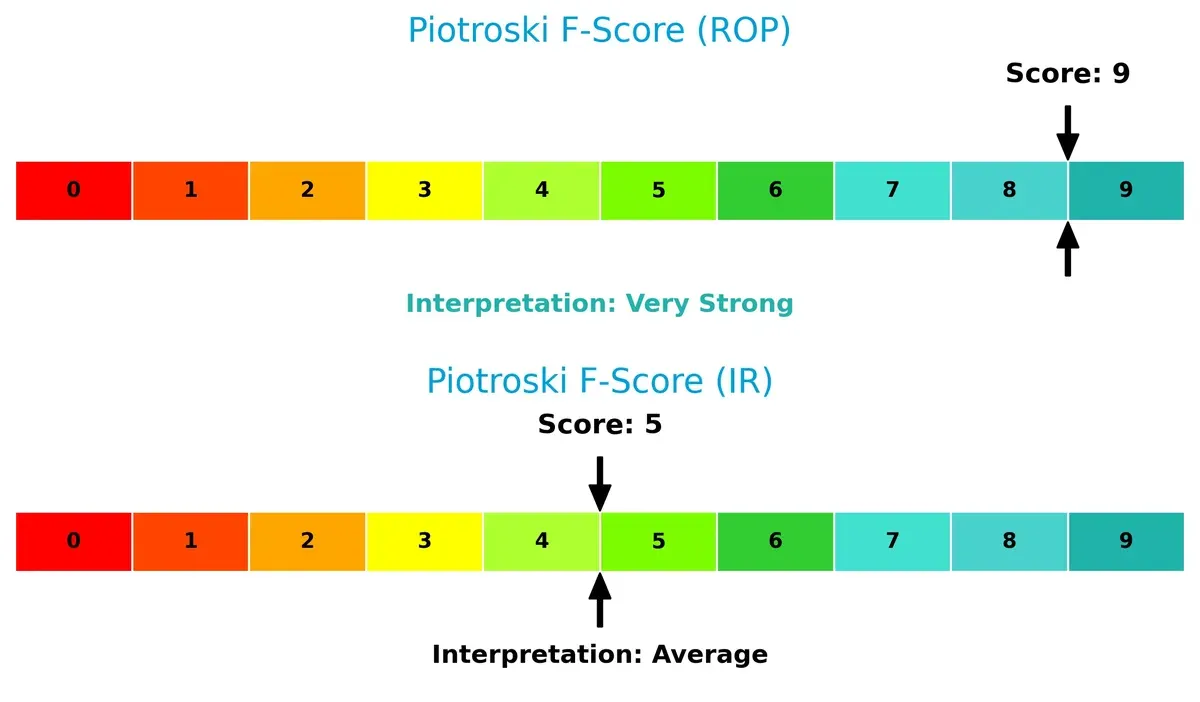
This stark difference shows Roper’s superior profitability, liquidity, and operational efficiency. Ingersoll Rand’s middling score raises red flags on internal financial quality compared to Roper’s robust profile.
How are the two companies positioned?
This section dissects the operational DNA of ROP and IR by comparing their revenue distribution and internal dynamics, including strengths and weaknesses. The goal is to confront their economic moats and identify which business model offers the most resilient, sustainable competitive advantage today.
Revenue Segmentation: The Strategic Mix
This visual comparison dissects how Roper Technologies and Ingersoll Rand diversify their income streams and where their primary sector bets lie:
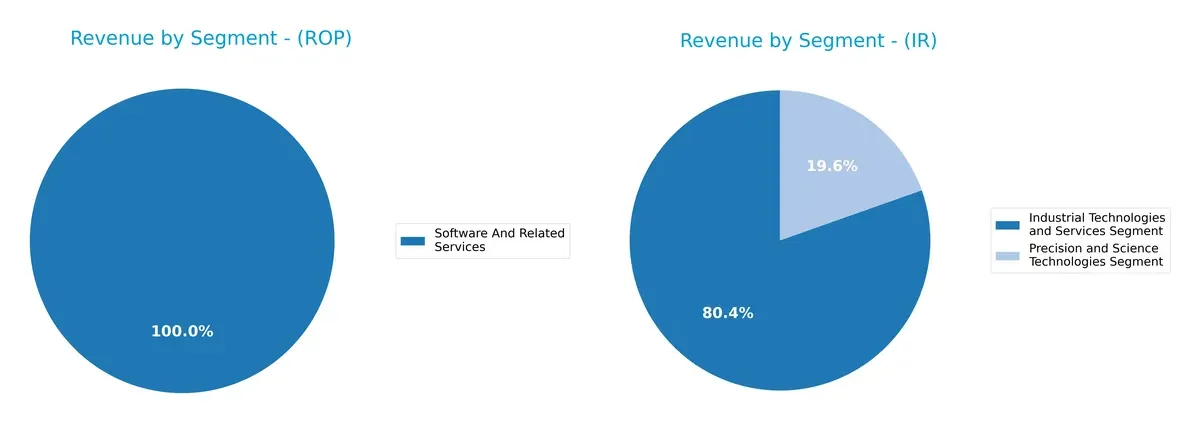
Roper Technologies leans heavily on Software and Related Services, generating $10.7B in 2024, showing a dominant focus on technology. Ingersoll Rand, by contrast, balances $5.8B in Industrial Technologies and $1.4B in Precision and Science, revealing a more diversified industrial portfolio. Roper’s concentration fuels ecosystem lock-in but risks dependence on software demand. Ingersoll Rand’s split mitigates risk, anchoring its foothold in infrastructure and precision markets.
Strengths and Weaknesses Comparison
This table compares the Strengths and Weaknesses of Roper Technologies and Ingersoll Rand based on diversification, profitability, financials, innovation, global presence, and market share:
Roper Technologies Strengths
- Significant software and technology product diversification
- High net margin at 19.44% indicates strong profitability
- Favorable debt-to-assets and interest coverage ratios show solid financial health
- Large U.S. revenue base supports market dominance
Ingersoll Rand Strengths
- Balanced industrial and precision technology segments diversify revenue
- Positive net margin of 11.59% with slightly favorable global ratios
- Strong current and quick ratios imply good liquidity
- Diverse geographic presence across Americas, Asia Pacific, and EMEA
Roper Technologies Weaknesses
- Unfavorable ROE and ROIC suggest poor capital efficiency
- Lack of available WACC data limits cost of capital analysis
- Weak liquidity ratios (current and quick ratio) raise short-term risk concerns
- High P/E ratio at 31.06 may indicate overvaluation
Ingersoll Rand Weaknesses
- ROE below 10% signals mediocre returns on equity
- Slightly unfavorable P/B and P/E ratios reflect valuation pressures
- Low dividend yield at 0.09% may deter income-focused investors
- Asset turnover below 1 suggests lower operational efficiency
Both companies show strengths in product and geographic diversification, but Roper’s profitability margin outpaces Ingersoll Rand’s by a wide margin. However, Roper’s weak capital efficiency and liquidity ratios are notable red flags. In contrast, Ingersoll Rand’s stronger liquidity and operational metrics offer a more balanced financial profile, though its returns and valuation ratios call for cautious evaluation. These factors shape the strategic focus each company might prioritize going forward.
The Moat Duel: Analyzing Competitive Defensibility
A structural moat is the only defense against competition eroding long-term profits. Let’s examine how Roper Technologies and Ingersoll Rand protect their turf:
Roper Technologies, Inc.: Intangible Assets and Software Integration
Roper’s moat stems from its diversified software and engineered products portfolio, enabling stable margins and strong gross profits near 70%. Yet, declining ROIC signals pressure on capital efficiency. New cloud-based offerings may deepen the moat but require close monitoring in 2026.
Ingersoll Rand Inc.: Operational Efficiency and Expanding Industrial Footprint
Ingersoll Rand relies on operational scale and growing ROIC, despite currently shedding value versus WACC. Its broad industrial technologies and services sustain margin improvement and support expansion into emerging markets. Continued ROIC growth hints at strengthening defenses in 2026.
Intangible Assets vs. Operational Efficiency: Which Moat Holds Stronger?
Roper boasts higher margins and software-driven advantages, but declining ROIC weakens its economic moat. Ingersoll Rand’s improving ROIC trend, despite current value destruction, suggests a deeper moat emerging through operational gains. I see Ingersoll Rand better positioned to defend and grow market share going forward.
Which stock offers better returns?
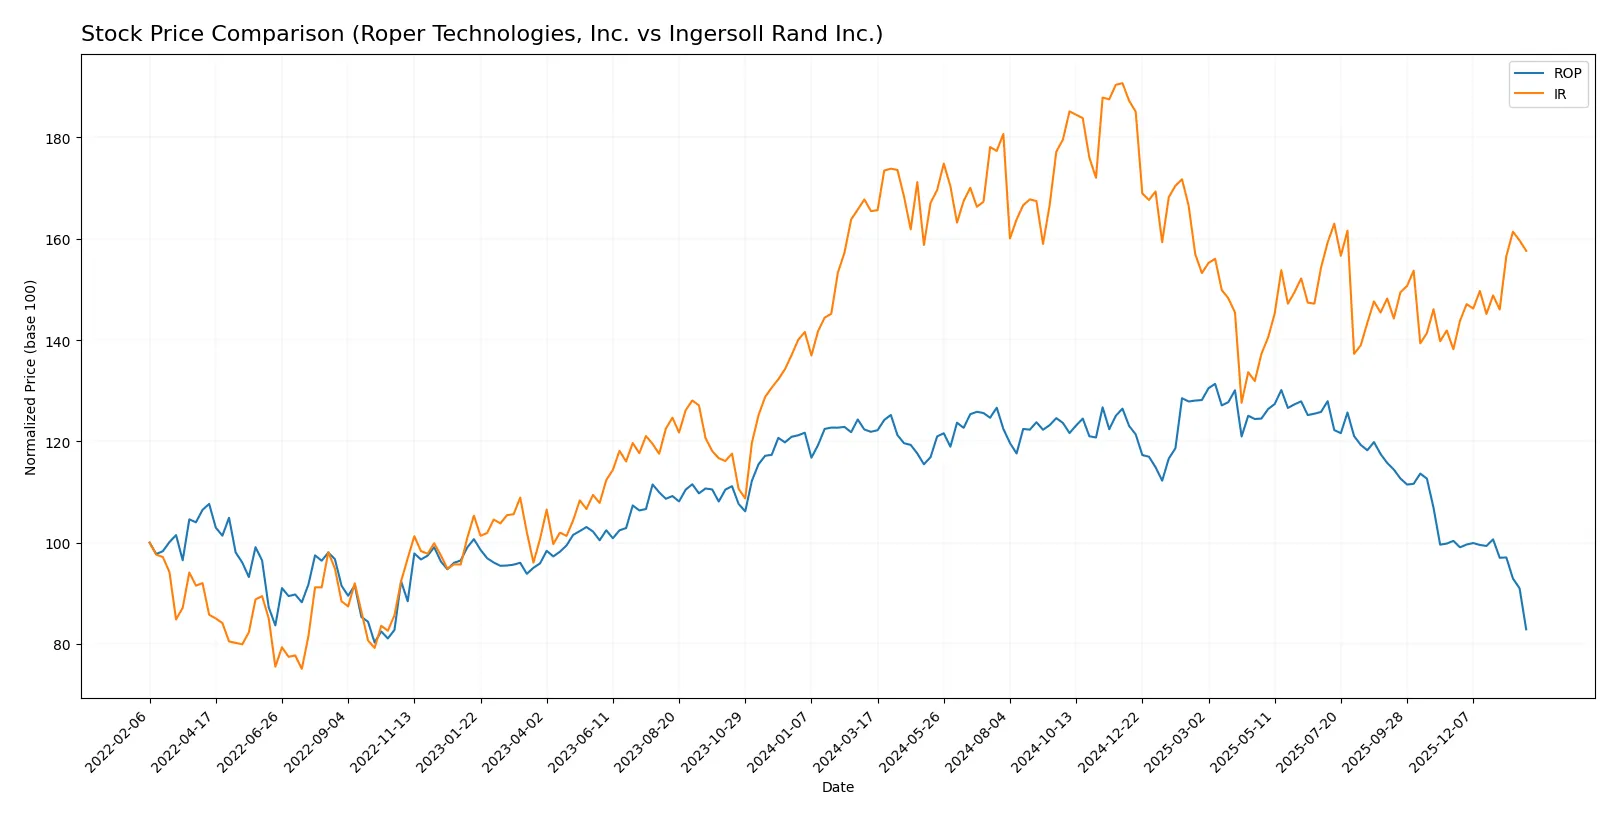
Over the past 12 months, Roper Technologies, Inc. and Ingersoll Rand Inc. exhibited clear bearish trends with distinct price declines and varied trading dynamics.
Trend Comparison
Roper Technologies, Inc. declined 32.0% over the last year, showing a bearish trend with deceleration. It hit a high of 588.38 and a low of 371.23, reflecting significant volatility (std dev 44.8).
Ingersoll Rand Inc. also faced a bearish trend with a 4.74% decline over 12 months but showed acceleration. The price ranged between 69.7 and 104.17, with lower volatility (std dev 8.05).
Comparing both, Ingersoll Rand delivered a smaller loss and showed recent recovery, outperforming Roper Technologies in market performance over the period.
Target Prices
Analysts present a clear target price consensus for Roper Technologies and Ingersoll Rand, reflecting optimistic growth expectations.
| Company | Target Low | Target High | Consensus |
|---|---|---|---|
| Roper Technologies, Inc. | 365 | 575 | 475.5 |
| Ingersoll Rand Inc. | 87 | 100 | 93 |
Roper’s target consensus at 475.5 suggests a significant upside from its current 371.23 price. Ingersoll Rand’s consensus of 93 also implies modest appreciation above the current 86.09 price.

Don’t Let Luck Decide Your Entry Point
Optimize your entry points with our advanced ProRealTime indicators. You’ll get efficient buy signals with precise price targets for maximum performance. Start outperforming now!
How do institutions grade them?
Roper Technologies, Inc. Grades
The following table summarizes recent grades assigned to Roper Technologies, Inc.:
| Grading Company | Action | New Grade | Date |
|---|---|---|---|
| Goldman Sachs | maintain | Neutral | 2026-01-29 |
| Argus Research | downgrade | Hold | 2026-01-28 |
| Truist Securities | maintain | Buy | 2026-01-28 |
| Mizuho | maintain | Underperform | 2026-01-28 |
| Oppenheimer | downgrade | Perform | 2026-01-28 |
| RBC Capital | maintain | Sector Perform | 2026-01-28 |
| Barclays | maintain | Underweight | 2026-01-28 |
| Stifel | downgrade | Hold | 2026-01-28 |
| Citigroup | maintain | Buy | 2026-01-28 |
| JP Morgan | maintain | Underweight | 2026-01-28 |
Ingersoll Rand Inc. Grades
Below is a summary of recent grades assigned to Ingersoll Rand Inc.:
| Grading Company | Action | New Grade | Date |
|---|---|---|---|
| Stifel | maintain | Hold | 2026-01-23 |
| Citigroup | maintain | Buy | 2026-01-12 |
| Wells Fargo | maintain | Overweight | 2026-01-07 |
| Stifel | maintain | Hold | 2025-12-16 |
| Citigroup | maintain | Buy | 2025-12-08 |
| Baird | maintain | Outperform | 2025-11-03 |
| Citigroup | maintain | Buy | 2025-11-03 |
| Stifel | maintain | Hold | 2025-10-20 |
| Wells Fargo | maintain | Overweight | 2025-10-06 |
| Morgan Stanley | maintain | Equal Weight | 2025-08-13 |
Which company has the best grades?
Ingersoll Rand Inc. generally receives more positive grades, including multiple “Buy,” “Overweight,” and “Outperform” ratings. Roper Technologies shows a mix of “Hold,” “Neutral,” and some downgrades. This contrast could influence investor sentiment and portfolio positioning.
Risks specific to each company
The following categories expose critical pressure points and systemic threats facing Roper Technologies, Inc. and Ingersoll Rand Inc. in the challenging 2026 industrial machinery market environment:
1. Market & Competition
Roper Technologies, Inc.
- Operates in niche software and engineered solutions, facing intense tech-driven competition.
Ingersoll Rand Inc.
- Competes broadly in air and fluid technologies with diversified product lines, subject to commoditization risks.
2. Capital Structure & Debt
Roper Technologies, Inc.
- Shows favorable debt-to-assets but unfavorable debt-to-equity ratios, indicating potential financial leverage concerns.
Ingersoll Rand Inc.
- Maintains moderate debt levels with stronger liquidity ratios, reflecting better balance sheet resilience.
3. Stock Volatility
Roper Technologies, Inc.
- Beta near 0.94 suggests below-market volatility, implying steadier stock price behavior.
Ingersoll Rand Inc.
- Beta at 1.33 signals higher volatility, exposing investors to greater market swings.
4. Regulatory & Legal
Roper Technologies, Inc.
- Faces regulatory scrutiny mainly in software compliance and data privacy.
Ingersoll Rand Inc.
- Must navigate complex regulations in industrial manufacturing and environmental standards globally.
5. Supply Chain & Operations
Roper Technologies, Inc.
- Relies on specialized components and software delivery, vulnerable to tech supply disruptions.
Ingersoll Rand Inc.
- Complex global supply chain exposed to raw material price fluctuations and logistic bottlenecks.
6. ESG & Climate Transition
Roper Technologies, Inc.
- ESG risks include energy consumption of data centers and software lifecycle impacts.
Ingersoll Rand Inc.
- Faces pressure to decarbonize heavy industrial operations and align with global climate policies.
7. Geopolitical Exposure
Roper Technologies, Inc.
- Primarily US-based with limited direct geopolitical risk but exposed via global software customers.
Ingersoll Rand Inc.
- Operates across multiple continents, increasing exposure to trade tensions and regional instability.
Which company shows a better risk-adjusted profile?
Roper Technologies’ most significant risk lies in its unfavorable debt-to-equity ratio, threatening financial flexibility despite steady stock volatility. Ingersoll Rand’s elevated stock volatility and complex geopolitical exposure pose greater market risks but benefit from stronger liquidity and supply chain management. The better risk-adjusted profile currently belongs to Ingersoll Rand, supported by its safer Altman Z-score and superior liquidity ratios, which offer greater resilience against market turbulence.
Final Verdict: Which stock to choose?
Roper Technologies, Inc. (ROP) wields a superpower in generating robust free cash flow and maintaining a strong gross margin, reflecting operational excellence. Its main point of vigilance is a weak liquidity position, signaling potential short-term strain. ROP fits best in an aggressive growth portfolio seeking operational efficiency amid some balance sheet risk.
Ingersoll Rand Inc. (IR) boasts a strategic moat through improving return on invested capital and a solid liquidity cushion, offering more stability than ROP. Its accelerating revenue growth and safer financial profile suit investors targeting GARP—growth at a reasonable price—with a focus on steady expansion and risk mitigation.
If you prioritize free cash flow generation and operational efficiency, Roper Technologies outshines as the compelling choice due to its cash machine profile despite liquidity concerns. However, if you seek better financial stability and consistent growth, Ingersoll Rand offers superior risk management and an improving moat, making it attractive for more conservative growth investors.
Disclaimer: Investment carries a risk of loss of initial capital. The past performance is not a reliable indicator of future results. Be sure to understand risks before making an investment decision.
Go Further
I encourage you to read the complete analyses of Roper Technologies, Inc. and Ingersoll Rand Inc. to enhance your investment decisions: