Industrial machinery giants Rockwell Automation, Inc. (ROK) and Ingersoll Rand Inc. (IR) stand as leaders in providing innovative solutions across manufacturing and process industries. Both companies operate in overlapping markets with a focus on automation, energy efficiency, and advanced technologies, catering to global industrial demands. This comparison delves into their strategies and financial health to help you identify which stock could be a smarter addition to your investment portfolio.

Table of contents
Companies Overview
I will begin the comparison between Rockwell Automation, Inc. and Ingersoll Rand Inc. by providing an overview of these two companies and their main differences.
Rockwell Automation Overview
Rockwell Automation, Inc. focuses on industrial automation and digital transformation solutions. Operating globally, it segments its business into Intelligent Devices, Software & Control, and Lifecycle Services. The company offers hardware, software, and consulting services primarily to discrete, hybrid, and process end markets, including automotive, semiconductor, food and beverage, and oil and gas sectors. Founded in 1903, it is headquartered in Milwaukee, Wisconsin.
Ingersoll Rand Overview
Ingersoll Rand Inc. provides mission-critical air, fluid, energy, specialty vehicle, and medical technologies worldwide. It operates through Industrial Technologies and Services, and Precision and Science Technologies segments. Its products serve diverse markets such as medical, industrial manufacturing, water treatment, chemical processing, and agriculture. Founded in 1859 and based in Davidson, North Carolina, Ingersoll Rand sells through direct sales and distributors under multiple established brands.
Key similarities and differences
Both companies operate in the industrial machinery sector and serve diverse global markets with specialized equipment and services. Rockwell Automation emphasizes automation and digital solutions, focusing on software and lifecycle services, while Ingersoll Rand centers on air and fluid technologies with a broad product portfolio including power tools and precision pumps. Their business models differ in segment focus, with Rockwell leaning more towards software integration and Ingersoll Rand towards manufacturing and servicing industrial technologies.
Income Statement Comparison
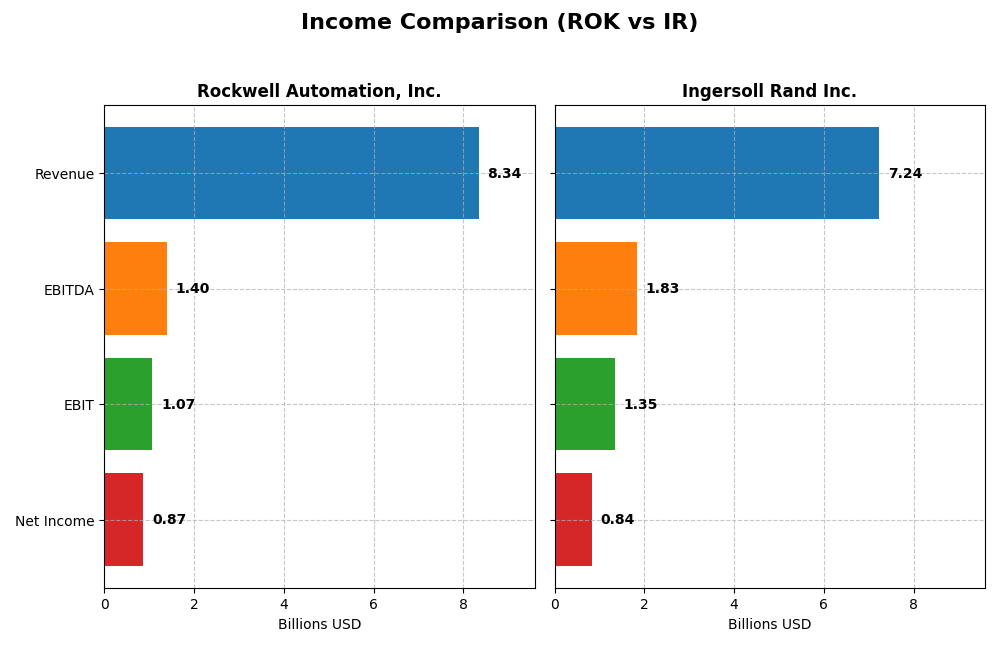
The table below presents a clear income statement comparison for the most recent fiscal year between Rockwell Automation, Inc. and Ingersoll Rand Inc.
| Metric | Rockwell Automation, Inc. (ROK) | Ingersoll Rand Inc. (IR) |
|---|---|---|
| Market Cap | 46.1B | 33.8B |
| Revenue | 8.34B | 7.24B |
| EBITDA | 1.40B | 1.83B |
| EBIT | 1.07B | 1.35B |
| Net Income | 869M | 839M |
| EPS | 7.69 | 2.08 |
| Fiscal Year | 2025 | 2024 |
Income Statement Interpretations
Rockwell Automation, Inc.
Rockwell Automation’s revenue showed a modest growth of 0.97% from 2024 to 2025, reaching $8.34B, while net income declined to $869M, indicating a 9.64% drop in net margin to 10.42%. Gross margin improved to 48.14%, but EBIT margin and EPS both receded, signaling margin pressures despite stable revenue. The recent year saw slowing growth and weaker profitability metrics.
Ingersoll Rand Inc.
Ingersoll Rand posted a 5.22% revenue increase to $7.24B in 2024, with net income rising 7.7% to $839M. Its gross margin of 43.81% and EBIT margin of 18.6% remained strong, supported by favorable EPS growth at 8.42%. Margins and profitability demonstrated resilience and expansion, reflecting improving operational efficiency and robust earnings growth in the latest year.
Which one has the stronger fundamentals?
Ingersoll Rand exhibits stronger fundamentals, with favorable trends in revenue, net income, and margin expansion over the period. Rockwell Automation, despite solid gross margins, faces declining net income and EPS, reflecting margin contraction and slower growth. Overall, Ingersoll Rand’s consistent profitability improvements and margin gains position it more favorably on income statement metrics.
Financial Ratios Comparison
The table below presents a side-by-side comparison of the most recent key financial ratios for Rockwell Automation, Inc. (ROK) and Ingersoll Rand Inc. (IR), based on their latest fiscal year data.
| Ratios | Rockwell Automation, Inc. (ROK) | Ingersoll Rand Inc. (IR) |
|---|---|---|
| ROE | 23.8% | 8.2% |
| ROIC | 13.7% | 6.1% |
| P/E | 45.3 | 43.5 |
| P/B | 10.8 | 3.58 |
| Current Ratio | 1.14 | 2.29 |
| Quick Ratio | 0.77 | 1.71 |
| D/E (Debt-to-Equity) | 1.00 | 0.49 |
| Debt-to-Assets | 32.5% | 27.7% |
| Interest Coverage | 9.12 | 6.10 |
| Asset Turnover | 0.74 | 0.40 |
| Fixed Asset Turnover | 6.95 | 8.59 |
| Payout ratio | 68.0% | 3.9% |
| Dividend yield | 1.50% | 0.09% |
Interpretation of the Ratios
Rockwell Automation, Inc.
Rockwell Automation shows strong profitability with a net margin of 10.42% and a high return on equity of 23.78%, but faces challenges with a high PE ratio of 45.33 and a price-to-book ratio of 10.78. Liquidity is moderate, with a current ratio of 1.14 and a quick ratio below 1. The company pays dividends with a 1.5% yield, maintaining a balanced payout supported by free cash flow, though some valuation metrics suggest caution.
Ingersoll Rand Inc.
Ingersoll Rand exhibits a favorable net margin of 11.59% and solid liquidity ratios, including a current ratio of 2.29 and quick ratio of 1.71. However, returns on equity and invested capital are weaker, at 8.24% and 6.11%, respectively. The firm pays a very low dividend yield of 0.09%, reflecting a conservative shareholder return strategy, while maintaining a lower debt-to-equity ratio and strong interest coverage.
Which one has the best ratios?
Ingersoll Rand has a higher proportion of favorable liquidity and solvency ratios, reflecting financial stability, while Rockwell Automation excels in profitability metrics and shareholder returns. Both companies have slightly favorable overall ratio profiles, but Rockwell’s valuation and liquidity ratios present more concerns compared to Ingersoll Rand’s balanced financial position.
Strategic Positioning
This section compares the strategic positioning of Rockwell Automation, Inc. and Ingersoll Rand Inc., focusing on market position, key segments, and exposure to technological disruption:
Rockwell Automation, Inc.
- Leading in industrial automation with global reach and strong competition in machinery.
- Diverse segments: Intelligent Devices, Software & Control, Lifecycle Services driving growth.
- Focused on digital transformation and automation software, facing moderate technological disruption.
Ingersoll Rand Inc.
- Competes in industrial machinery with significant presence across multiple regions.
- Two main segments: Industrial Technologies and Precision and Science Technologies.
- Exposure to evolving air, fluid, and energy technologies with moderate disruption risk.
Rockwell Automation, Inc. vs Ingersoll Rand Inc. Positioning
Rockwell Automation has a diversified portfolio across hardware, software, and services, supporting varied end markets. Ingersoll Rand concentrates on air, fluid, and precision technologies, targeting mission-critical applications. Diversification offers Rockwell broader market coverage, while Ingersoll Rand’s focus may allow specialization advantages.
Which has the best competitive advantage?
Rockwell Automation exhibits a very favorable moat with consistent value creation and growing profitability. Ingersoll Rand shows slightly unfavorable moat status, indicating value destruction despite improving profitability. Rockwell holds a stronger competitive advantage based on MOAT evaluation.
Stock Comparison
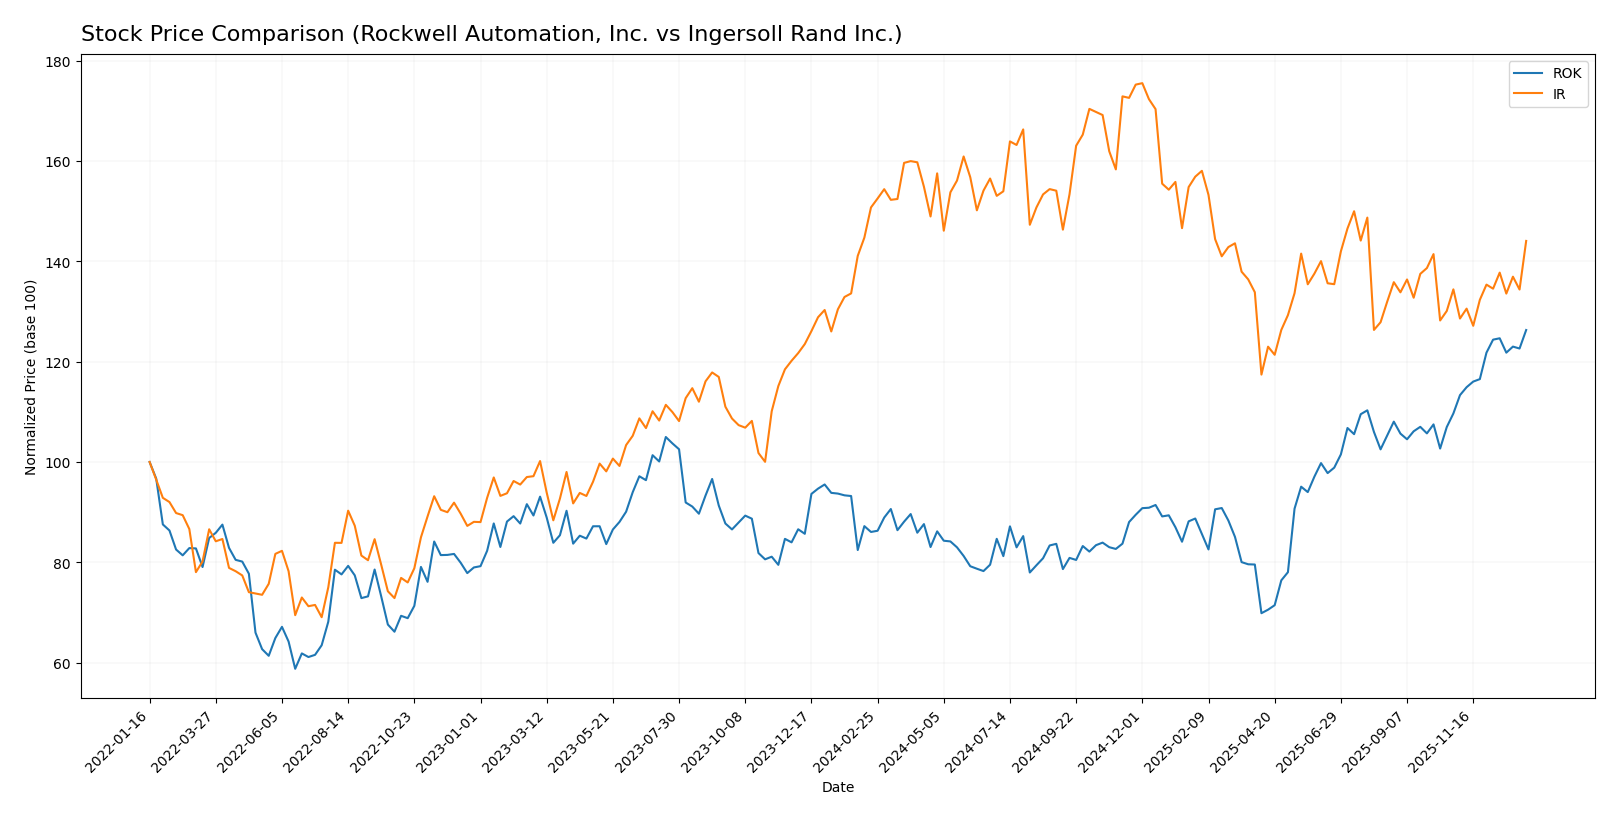
The stock prices of Rockwell Automation, Inc. (ROK) and Ingersoll Rand Inc. (IR) have shown distinct dynamics over the past 12 months, with ROK exhibiting a strong upward momentum and IR facing a moderate decline, reflecting divergent trading behaviors and market responses in their sectors.
Trend Analysis
Rockwell Automation, Inc. (ROK) displayed a bullish trend over the past year with a substantial price increase of 46.76%, showing acceleration and reaching a high of 410.53. The stock’s recent 15.16% rise confirms continued positive momentum.
Ingersoll Rand Inc. (IR) experienced a bearish trend, declining by 4.43% over the same period despite acceleration. The price fluctuated between 69.7 and 104.17, with a recent mild recovery of 7.18%, indicating some stabilization.
Comparing both, Rockwell Automation delivered the highest market performance with a significant positive gain, whereas Ingersoll Rand’s stock showed an overall negative return despite recent improvements.
Target Prices
Analysts present a confident target price consensus for both Rockwell Automation, Inc. and Ingersoll Rand Inc.
| Company | Target High | Target Low | Consensus |
|---|---|---|---|
| Rockwell Automation, Inc. | 470 | 380 | 421.57 |
| Ingersoll Rand Inc. | 100 | 81 | 91.5 |
The target consensus for Rockwell Automation at 421.57 is slightly above its current price of 410.53, indicating moderate upside potential. Ingersoll Rand’s target consensus of 91.5 also suggests a positive outlook compared to its current price of 85.51.
Analyst Opinions Comparison
This section compares analysts’ ratings and grades for Rockwell Automation, Inc. and Ingersoll Rand Inc.:
Rating Comparison
ROK Rating
- Rating: B-, considered Very Favorable overall.
- Discounted Cash Flow Score: 3, indicating a Moderate valuation perspective.
- ROE Score: 5, Very Favorable, showing strong profit generation efficiency.
- ROA Score: 4, Favorable, reflecting effective asset utilization.
- Debt To Equity Score: 1, Very Unfavorable, suggesting higher financial risk.
- Overall Score: 3, Moderate financial standing.
IR Rating
- Rating: C+, considered Very Favorable overall.
- Discounted Cash Flow Score: 3, indicating a Moderate valuation perspective.
- ROE Score: 2, Moderate, demonstrating lower profit generation efficiency.
- ROA Score: 3, Moderate, indicating average asset utilization.
- Debt To Equity Score: 2, Moderate, implying moderate financial risk.
- Overall Score: 2, Moderate financial standing but lower than ROK’s.
Which one is the best rated?
Based on the provided data, Rockwell Automation (ROK) holds higher ratings in ROE, ROA, and overall score compared to Ingersoll Rand (IR). However, ROK’s debt to equity score is less favorable, indicating higher financial risk than IR.
Scores Comparison
Here is a comparison of the Altman Z-Score and Piotroski Score for Rockwell Automation and Ingersoll Rand:
Rockwell Automation Scores
- Altman Z-Score: 5.32, indicating a safe zone with low bankruptcy risk.
- Piotroski Score: 8, classified as very strong financial health.
Ingersoll Rand Scores
- Altman Z-Score: 3.27, indicating a safe zone with low bankruptcy risk.
- Piotroski Score: 5, classified as average financial health.
Which company has the best scores?
Rockwell Automation has a higher Altman Z-Score and a stronger Piotroski Score compared to Ingersoll Rand. This indicates Rockwell Automation currently shows stronger financial stability and health based on these scores.
Grades Comparison
Here is a comparison of the recent grades and ratings assigned to Rockwell Automation, Inc. and Ingersoll Rand Inc.:
Rockwell Automation, Inc. Grades
The following table summarizes recent grades from recognized financial institutions for Rockwell Automation, Inc.:
| Grading Company | Action | New Grade | Date |
|---|---|---|---|
| Wells Fargo | Maintain | Equal Weight | 2026-01-07 |
| Barclays | Maintain | Overweight | 2026-01-07 |
| Goldman Sachs | Upgrade | Neutral | 2025-12-16 |
| Jefferies | Maintain | Buy | 2025-12-10 |
| Citigroup | Maintain | Buy | 2025-12-08 |
| Barclays | Maintain | Overweight | 2025-12-04 |
| Baird | Maintain | Outperform | 2025-11-21 |
| B of A Securities | Maintain | Buy | 2025-11-20 |
| JP Morgan | Maintain | Neutral | 2025-11-11 |
| Morgan Stanley | Maintain | Overweight | 2025-11-10 |
Rockwell Automation’s grades show a balanced mix of buy and overweight ratings, with a recent upgrade from sell to neutral by Goldman Sachs, indicating cautious optimism.
Ingersoll Rand Inc. Grades
Below is a summary of recent grades from reputable grading companies for Ingersoll Rand Inc.:
| Grading Company | Action | New Grade | Date |
|---|---|---|---|
| Wells Fargo | Maintain | Overweight | 2026-01-07 |
| Stifel | Maintain | Hold | 2025-12-16 |
| Citigroup | Maintain | Buy | 2025-12-08 |
| Citigroup | Maintain | Buy | 2025-11-03 |
| Baird | Maintain | Outperform | 2025-11-03 |
| Stifel | Maintain | Hold | 2025-10-20 |
| Wells Fargo | Maintain | Overweight | 2025-10-06 |
| Morgan Stanley | Maintain | Equal Weight | 2025-08-13 |
| Barclays | Maintain | Overweight | 2025-08-04 |
| Stifel | Maintain | Hold | 2025-08-04 |
Ingersoll Rand’s ratings consistently show overweight and buy recommendations, with a stable hold rating from some firms, reflecting steady confidence.
Which company has the best grades?
Ingersoll Rand has received a higher proportion of buy and overweight ratings compared to Rockwell Automation, which has more hold and neutral grades. This suggests Ingersoll Rand might be viewed more favorably by analysts, potentially impacting investor sentiment and portfolio positioning.
Strengths and Weaknesses
Below is a comparison table outlining the key strengths and weaknesses of Rockwell Automation, Inc. (ROK) and Ingersoll Rand Inc. (IR) based on recent financial performance, market position, and operational metrics.
| Criterion | Rockwell Automation, Inc. (ROK) | Ingersoll Rand Inc. (IR) |
|---|---|---|
| Diversification | Moderate: Focused on Intelligent Devices, Lifecycle Services, and Software & Control segments | Moderate: Industrial Technologies & Services and Precision & Science Technologies segments |
| Profitability | Strong: ROIC 13.7%, Net margin 10.42%, ROE 23.78% (favorable) | Moderate: ROIC 6.11%, Net margin 11.59%, ROE 8.24% (mixed) |
| Innovation | High: Increasing investment in Software & Control segment, boosting value creation | Moderate: Growing profitability but lower ROIC relative to cost of capital |
| Global presence | Broad: Established global footprint with durable competitive advantage | Broad: Growing revenues and segments but less efficient capital use |
| Market Share | Strong: Consistent value creation and growing ROIC | Weaker: Currently shedding value despite improving profitability |
Key takeaways: Rockwell Automation demonstrates a very favorable moat with strong profitability and innovation focus, making it a more attractive value creator. Ingersoll Rand shows improving profitability but struggles with value destruction and lower capital efficiency, suggesting cautious investment consideration.
Risk Analysis
Below is a summary table of key risks for Rockwell Automation, Inc. (ROK) and Ingersoll Rand Inc. (IR) based on the most recent data from 2025 and 2024 respectively:
| Metric | Rockwell Automation, Inc. (ROK) | Ingersoll Rand Inc. (IR) |
|---|---|---|
| Market Risk | High beta of 1.516 indicates elevated volatility | Beta of 1.332 shows moderately high volatility |
| Debt level | Debt-to-Equity ratio neutral at 1.0, Debt/Assets 32.5% | Favorable debt-to-equity at 0.49, Debt/Assets 27.65% |
| Regulatory Risk | Moderate, due to global industrial exposure | Moderate, with diverse regulatory environments globally |
| Operational Risk | Medium, reliance on complex automation solutions | Medium, broad product range with operational complexity |
| Environmental Risk | Exposure in eco-industrial and renewable sectors | Moderate, with industrial and energy sector exposure |
| Geopolitical Risk | Moderate, global supply chain and market presence | Moderate, global operations across multiple regions |
The most significant risks are market volatility for both companies, highlighted by their betas above 1, indicating sensitivity to market swings. Rockwell Automation’s higher leverage compared to Ingersoll Rand suggests a slightly elevated financial risk. Both firms face moderate regulatory and geopolitical risks due to their global industrial operations. Investors should monitor market conditions and debt management closely, as these factors will most impact financial stability and performance going forward.
Which Stock to Choose?
Rockwell Automation, Inc. (ROK) shows a mixed income evolution with a 0.97% revenue growth in the last year but a declining net margin and EPS over the overall period. Financial ratios are slightly favorable, with strong profitability metrics but some valuation concerns. Debt levels are moderate, supported by a solid interest coverage ratio, and the company holds a very favorable B- rating.
Ingersoll Rand Inc. (IR) demonstrates favorable income growth with 5.22% revenue growth last year and strong net income and EPS increases over the longer term. Its financial ratios are slightly favorable overall, with strong liquidity and moderate profitability, backed by a very favorable C+ rating. Debt metrics appear conservative, and the company is in a safe zone financially.
For investors, the choice might depend on risk tolerance and investment style: growth-oriented investors could find IR’s favorable income growth and improving profitability attractive, while those seeking a company with a durable competitive advantage and high returns on equity may view ROK’s strong moat and profitability metrics as compelling. Both stocks show slightly favorable financial ratios, but their income trends and ratings offer contrasting profiles.
Disclaimer: Investment carries a risk of loss of initial capital. The past performance is not a reliable indicator of future results. Be sure to understand risks before making an investment decision.
Go Further
I encourage you to read the complete analyses of Rockwell Automation, Inc. and Ingersoll Rand Inc. to enhance your investment decisions: