Home > Comparison > Industrials > PH vs IR
The strategic rivalry between Parker-Hannifin Corporation and Ingersoll Rand Inc. shapes the industrial machinery landscape. Parker-Hannifin excels as a diversified industrial and aerospace systems powerhouse, while Ingersoll Rand focuses on mission-critical air and fluid technologies. This head-to-head pits broad industrial diversification against specialized precision technologies. My analysis aims to identify which company offers a superior risk-adjusted outlook for a balanced portfolio in today’s evolving industrial sector.
Table of contents
Companies Overview
Parker-Hannifin and Ingersoll Rand stand as heavyweight players in the industrial machinery sector with distinct market approaches.
Parker-Hannifin Corporation: Precision Motion and Control Leader
Parker-Hannifin dominates the motion and control technologies market, generating revenue by supplying sealing, hydraulic, pneumatic, and aerospace systems. In 2026, its strategic focus remains on expanding diversified industrial and aerospace segments, serving OEMs and distributors globally with complex, precision-engineered components.
Ingersoll Rand Inc.: Mission-Critical Industrial Solutions Provider
Ingersoll Rand specializes in air, fluid, and energy technologies, profiting from industrial and precision science equipment sales. Its 2026 strategy emphasizes broadening its portfolio across air compression, vacuum, and fluid management systems, targeting diverse sectors such as medical, manufacturing, and agriculture through a robust brand network.
Strategic Collision: Similarities & Divergences
While both firms operate in industrial machinery, Parker-Hannifin prioritizes a highly engineered product portfolio with aerospace integration. In contrast, Ingersoll Rand focuses on mission-critical air and fluid technologies with a diversified brand approach. Their competitive battleground centers on OEM and aftermarket solutions, yet their investment profiles diverge by scale and specialization intensity.
Income Statement Comparison
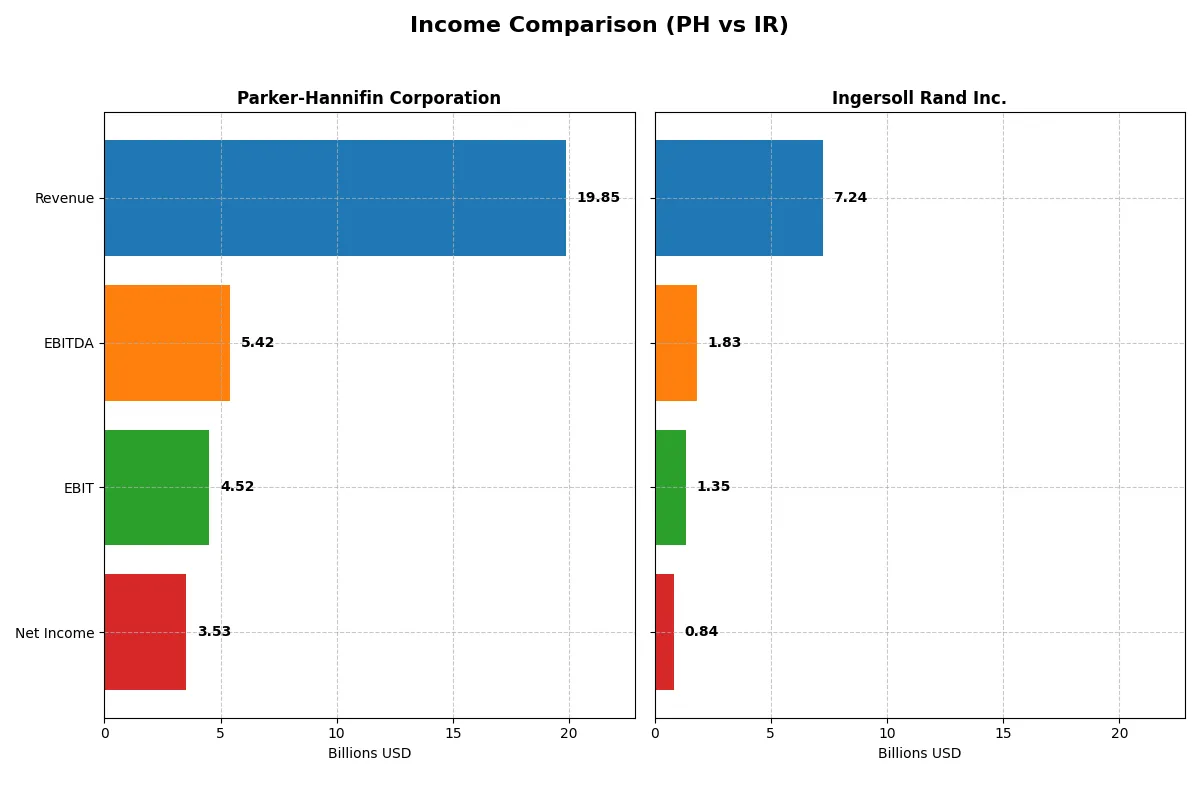
This data dissects the core profitability and scalability of both corporate engines to reveal who dominates the bottom line:
| Metric | Parker-Hannifin Corporation (PH) | Ingersoll Rand Inc. (IR) |
|---|---|---|
| Revenue | 19.85B | 7.24B |
| Cost of Revenue | 12.54B | 4.07B |
| Operating Expenses | 3.26B | 1.87B |
| Gross Profit | 7.32B | 3.17B |
| EBITDA | 5.42B | 1.83B |
| EBIT | 4.52B | 1.35B |
| Interest Expense | 409M | 213M |
| Net Income | 3.53B | 839M |
| EPS | 27.52 | 2.08 |
| Fiscal Year | 2025 | 2024 |
Income Statement Analysis: The Bottom-Line Duel
The income statement comparison reveals which company operates with superior efficiency and profit conversion in their respective markets.
Parker-Hannifin Corporation Analysis
Parker-Hannifin’s revenue grew from 14.3B in 2021 to 19.85B in 2025, reflecting steady expansion. Net income more than doubled, reaching 3.53B in 2025. Gross margin improved to 36.85%, while net margin surged to 17.79%, signaling strong cost control. The 2025 year shows robust EBIT growth of 10.1%, highlighting operational momentum.
Ingersoll Rand Inc. Analysis
Ingersoll Rand’s revenue rose from 3.97B in 2020 to 7.24B in 2024, doubling over the period. Net income jumped dramatically to 839M in 2024 from a loss in 2020. Gross margin stands higher at 43.81%, but net margin remains lower at 11.59%. EBIT advanced 13.3% in 2024, reflecting improving profitability despite tighter net margins.
Margin Strength vs. Growth Trajectory
Parker-Hannifin delivers superior net margins and consistent profit expansion, translating scale into efficiency. Ingersoll Rand boasts stronger gross margins and explosive net income growth from a lower base, but with thinner net profitability. For investors prioritizing margin quality, Parker-Hannifin’s profile is more attractive, while Ingersoll Rand appeals to those favoring rapid growth potential.
Financial Ratios Comparison
These vital ratios act as a diagnostic tool to expose the underlying fiscal health, valuation premiums, and capital efficiency of the companies compared below:
| Ratios | Parker-Hannifin (PH) | Ingersoll Rand (IR) |
|---|---|---|
| ROE | 25.81% | 8.24% |
| ROIC | 13.69% | 6.11% |
| P/E | 25.38 | 43.51 |
| P/B | 6.55 | 3.58 |
| Current Ratio | 1.19 | 2.29 |
| Quick Ratio | 0.71 | 1.71 |
| D/E | 0.69 | 0.49 |
| Debt-to-Assets | 32.16% | 27.65% |
| Interest Coverage | 9.93 | 6.10 |
| Asset Turnover | 0.67 | 0.40 |
| Fixed Asset Turnover | 6.76 | 8.59 |
| Payout Ratio | 24.38% | 3.85% |
| Dividend Yield | 0.96% | 0.09% |
| Fiscal Year | 2025 | 2024 |
Efficiency & Valuation Duel: The Vital Signs
Financial ratios serve as a company’s DNA, exposing hidden risks and operational strengths behind the numbers.
Parker-Hannifin Corporation
Parker-Hannifin delivers robust profitability with a 25.8% ROE and a strong 17.8% net margin, reflecting operational excellence. However, its valuation appears stretched, with a P/E of 25.4 and P/B of 6.55. Shareholder returns include a modest 0.96% dividend yield, indicating reinvestment in growth and innovation.
Ingersoll Rand Inc.
Ingersoll Rand shows moderate profitability, with an 8.2% ROE and 11.6% net margin, but its high P/E of 43.5 signals an expensive valuation. The balance sheet is solid, supported by favorable liquidity and leverage ratios. Dividend yield is negligible at 0.09%, suggesting focus on internal growth rather than payouts.
Valuation Stretch vs. Balanced Liquidity
Parker-Hannifin balances strong returns against a stretched valuation, while Ingersoll Rand offers better liquidity but lower profitability. Investors seeking growth with operational efficiency may lean toward Parker-Hannifin, whereas those prioritizing balance sheet strength might consider Ingersoll Rand’s profile.
Which one offers the Superior Shareholder Reward?
I see Parker-Hannifin (PH) delivers a stronger shareholder reward than Ingersoll Rand (IR). PH offers a 0.96% dividend yield with a prudent 24% payout ratio, well covered by free cash flow at 88%. PH also executes significant buybacks, enhancing total returns sustainably. IR’s dividend yield is negligible at 0.09%, with a 4% payout ratio, signaling limited cash return to shareholders. Though IR reinvests heavily in growth, its elevated P/E of 43x and moderate buyback activity temper near-term reward. Historically, PH’s balanced distribution and capital allocation yield a more attractive and sustainable total return in 2026.
Comparative Score Analysis: The Strategic Profile
The radar chart reveals the fundamental DNA and trade-offs of both firms, highlighting their financial strengths and valuation nuances:
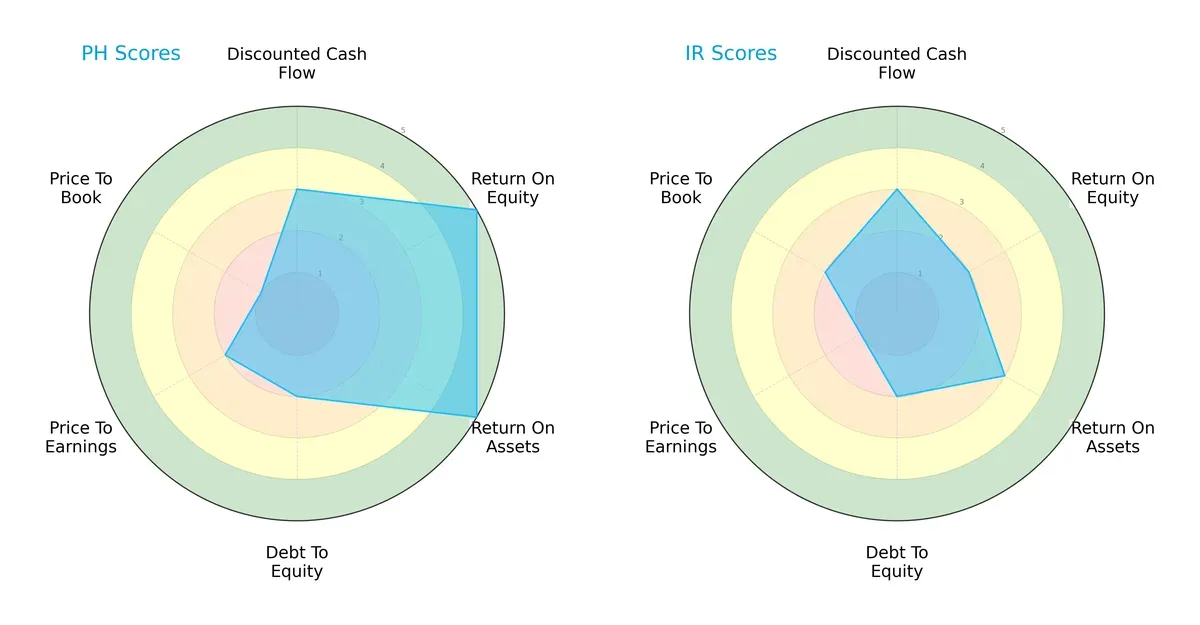
Parker-Hannifin (PH) excels in profitability with top ROE and ROA scores (5 each), showing operational efficiency. In contrast, Ingersoll Rand (IR) posts moderate returns but slightly better price-to-book valuation. Both share moderate DCF and debt-to-equity scores. PH’s profile is more unbalanced, relying heavily on operational strength, while IR presents a more evenly spread, though less potent, performance.
Bankruptcy Risk: Solvency Showdown
The Altman Z-Score gap indicates Parker-Hannifin’s superior solvency, suggesting safer long-term survival amid economic cycles:
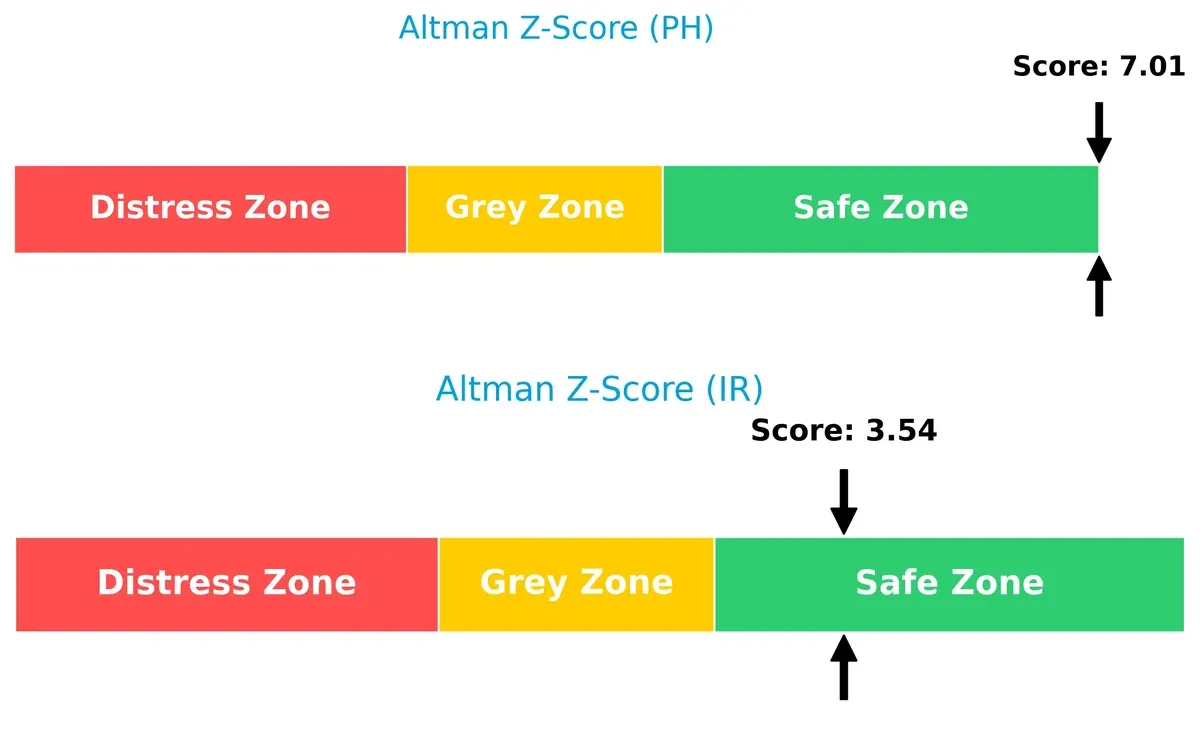
PH’s score of 7.0 places it well within the safe zone, signaling robust financial health and low bankruptcy risk. IR’s 3.5 also sits in the safe zone but closer to the grey area, implying higher vulnerability under stress.
Financial Health: Quality of Operations
Piotroski F-Scores confirm PH’s stronger operational quality, signaling peak financial health compared to IR’s average standing:
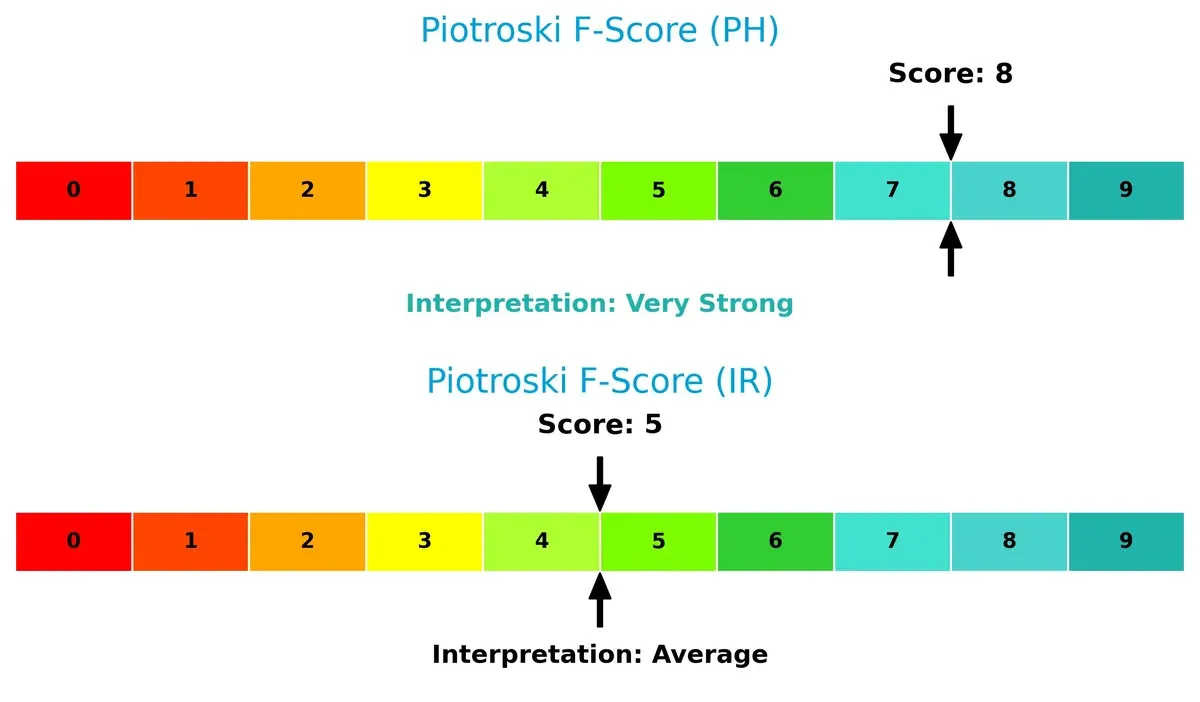
PH scores an impressive 8, reflecting strong profitability, liquidity, and efficiency. IR’s 5 points to moderate financial strength, with potential red flags in internal metrics. This gap highlights PH’s superior internal controls and resilience.
How are the two companies positioned?
This section dissects the operational DNA of PH and IR by comparing their revenue distribution and internal dynamics. The goal is to confront their economic moats to identify which model offers the most resilient competitive advantage today.
Revenue Segmentation: The Strategic Mix
This comparison dissects how Parker-Hannifin Corporation and Ingersoll Rand Inc. diversify their income streams and where their primary sector bets lie:
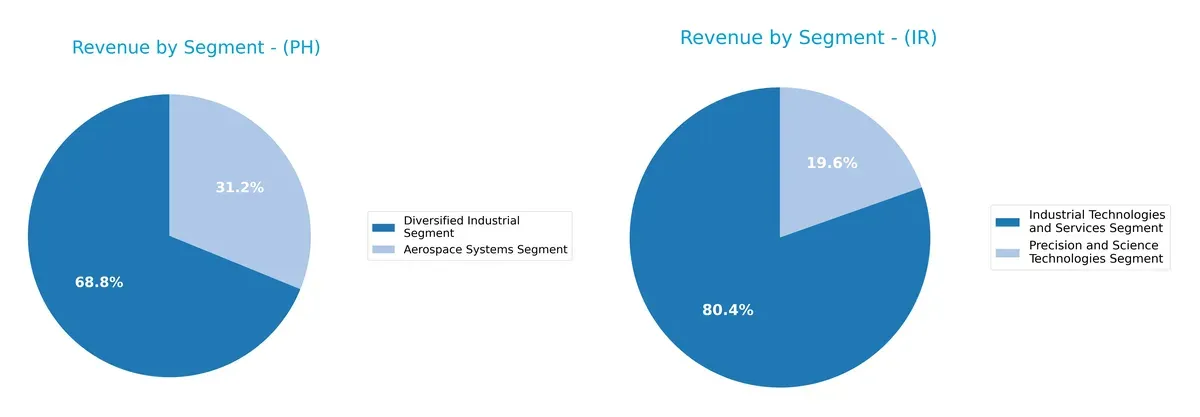
Parker-Hannifin anchors its revenue in two robust segments: $13.7B from Diversified Industrial and $6.2B from Aerospace Systems in 2025. Ingersoll Rand pivots on Industrial Technologies and Services with $5.8B, complemented by $1.4B in Precision and Science Technologies. Parker-Hannifin’s broader industrial focus reduces concentration risk, while Ingersoll Rand leans more heavily on a single segment, suggesting greater vulnerability but also potential for focused innovation.
Strengths and Weaknesses Comparison
This table compares the Strengths and Weaknesses of Parker-Hannifin Corporation (PH) and Ingersoll Rand Inc. (IR):
PH Strengths
- Higher net margin at 17.79%
- Strong ROE at 25.81%
- Favorable interest coverage at 11.04
- Significant Aerospace and Diversified Industrial segments
- Robust North America and Europe revenues
IR Strengths
- Favorable current and quick ratios
- Lower debt to assets at 27.65%
- Strong fixed asset turnover at 8.59
- Balanced Industrial Technologies and Precision segments
- Diversified geographic presence including Americas, Asia Pacific, EMEA
PH Weaknesses
- Unfavorable PE at 25.38 and PB at 6.55
- Quick ratio weak at 0.71
- Dividend yield under 1%
- Moderate asset turnover at 0.67
- Heavy reliance on North America
IR Weaknesses
- Lower ROE at 8.24%
- Unfavorable PE at 43.51 and PB at 3.58
- Lower asset turnover at 0.4
- Low dividend yield at 0.09%
- Smaller revenue base compared to PH
PH shows strong profitability ratios and segment revenue diversity, but valuation and liquidity metrics require caution. IR benefits from solid balance sheet health and asset efficiency, yet profitability and valuation present notable challenges. These contrasts highlight differing strategic priorities and financial structures.
The Moat Duel: Analyzing Competitive Defensibility
A structural moat is the only true shield protecting long-term profits from relentless competitive erosion. Let’s examine where each company stands:
Parker-Hannifin Corporation: Intangible Asset Moat
Parker-Hannifin leverages proprietary motion and control technologies, reflected in a very favorable ROIC 4.4% above WACC and improving profitability. New aerospace and industrial product launches in 2026 could deepen this moat further.
Ingersoll Rand Inc.: Cost and Scale Advantage
Ingersoll Rand relies on scale and cost controls to compete but currently sheds value with ROIC below WACC despite a sharp ROIC rebound. Expansion into precision fluid systems offers growth, yet value creation remains uncertain.
Value Creation vs. Value Destruction: The Moat Verdict
Parker-Hannifin’s durable intangible assets yield a deeper moat than Ingersoll Rand’s cost-based edge. I see Parker-Hannifin better equipped to defend market share and sustain profits long term.
Which stock offers better returns?
Over the past year, Parker-Hannifin’s stock surged sharply, showing strong acceleration, while Ingersoll Rand faced a declining trend despite recent modest gains.
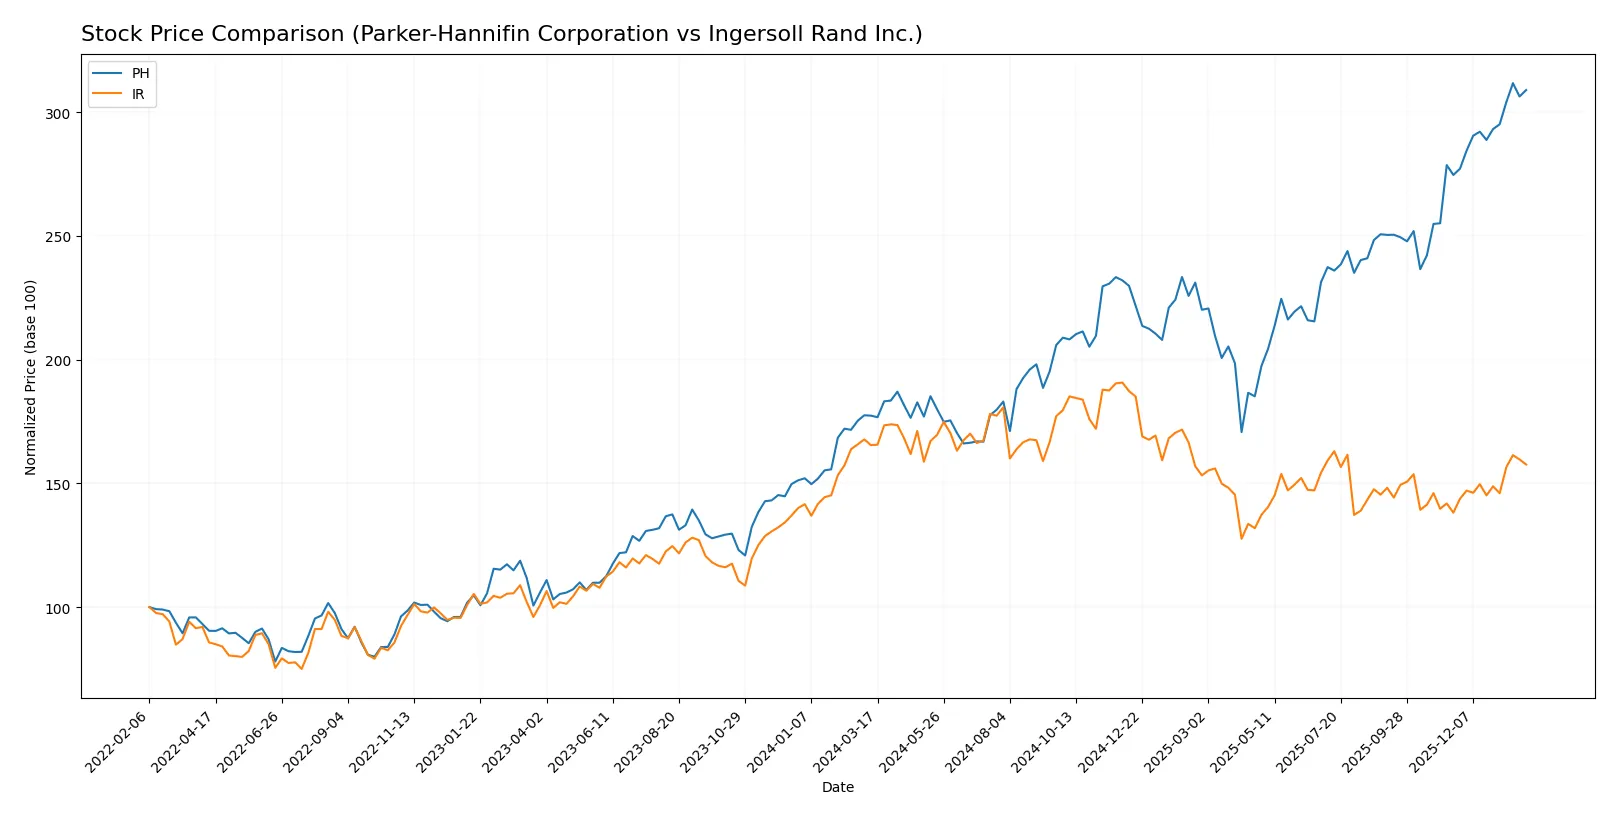
Trend Comparison
Parker-Hannifin’s stock rose 74.16% over the last 12 months, marking a bullish trend with accelerating momentum and a high volatility level of 112.58.
Ingersoll Rand’s stock fell 4.74% over the same period, reflecting a bearish trend despite recent acceleration and low volatility near 8.05.
Parker-Hannifin delivered the highest market performance, outperforming Ingersoll Rand with a substantial positive return versus a moderate overall decline.
Target Prices
Analysts present a solid target price consensus for Parker-Hannifin Corporation and Ingersoll Rand Inc.
| Company | Target Low | Target High | Consensus |
|---|---|---|---|
| Parker-Hannifin Corporation | 825 | 1139 | 995.46 |
| Ingersoll Rand Inc. | 87 | 100 | 93 |
The consensus target for Parker-Hannifin exceeds its current price of 935.84, signaling potential upside. Ingersoll Rand’s target also suggests modest gains above its 86.09 market price.

Don’t Let Luck Decide Your Entry Point
Optimize your entry points with our advanced ProRealTime indicators. You’ll get efficient buy signals with precise price targets for maximum performance. Start outperforming now!
How do institutions grade them?
The following tables summarize recent institutional grades for Parker-Hannifin Corporation and Ingersoll Rand Inc.:
Parker-Hannifin Corporation Grades
This table lists recent grades from recognized financial institutions for Parker-Hannifin Corporation.
| Grading Company | Action | New Grade | Date |
|---|---|---|---|
| Wells Fargo | Maintain | Overweight | 2026-01-30 |
| Citigroup | Maintain | Buy | 2026-01-30 |
| JP Morgan | Maintain | Overweight | 2026-01-30 |
| Jefferies | Maintain | Buy | 2026-01-30 |
| Barclays | Maintain | Overweight | 2026-01-30 |
| Stifel | Maintain | Hold | 2026-01-30 |
| Stifel | Maintain | Hold | 2026-01-23 |
| JP Morgan | Maintain | Overweight | 2026-01-16 |
| Morgan Stanley | Maintain | Equal Weight | 2026-01-14 |
| Barclays | Maintain | Overweight | 2026-01-07 |
Ingersoll Rand Inc. Grades
This table shows recent grades from reputable grading companies for Ingersoll Rand Inc.
| Grading Company | Action | New Grade | Date |
|---|---|---|---|
| Stifel | Maintain | Hold | 2026-01-23 |
| Citigroup | Maintain | Buy | 2026-01-12 |
| Wells Fargo | Maintain | Overweight | 2026-01-07 |
| Stifel | Maintain | Hold | 2025-12-16 |
| Citigroup | Maintain | Buy | 2025-12-08 |
| Baird | Maintain | Outperform | 2025-11-03 |
| Citigroup | Maintain | Buy | 2025-11-03 |
| Stifel | Maintain | Hold | 2025-10-20 |
| Wells Fargo | Maintain | Overweight | 2025-10-06 |
| Morgan Stanley | Maintain | Equal Weight | 2025-08-13 |
Which company has the best grades?
Parker-Hannifin receives mostly Overweight and Buy grades from top firms, signaling solid confidence. Ingersoll Rand shows a mix of Buy, Hold, and Outperform ratings, indicating moderate enthusiasm. Investors might interpret Parker-Hannifin’s consistently higher grades as stronger institutional support.
Risks specific to each company
The following risk categories identify critical pressure points and systemic threats facing Parker-Hannifin Corporation and Ingersoll Rand Inc. in the 2026 market environment:
1. Market & Competition
Parker-Hannifin Corporation
- Strong industrial market presence but faces pressure from high valuation multiples.
Ingersoll Rand Inc.
- Smaller market cap with intense competition and premium valuation risks.
2. Capital Structure & Debt
Parker-Hannifin Corporation
- Moderate debt levels with favorable interest coverage and neutral debt-to-equity ratio.
Ingersoll Rand Inc.
- Lower debt load and strong liquidity ratios, reflecting a more conservative capital structure.
3. Stock Volatility
Parker-Hannifin Corporation
- Beta of 1.25 indicates moderate volatility, typical for industrial machinery firms.
Ingersoll Rand Inc.
- Slightly higher beta at 1.33, suggesting more sensitivity to market swings.
4. Regulatory & Legal
Parker-Hannifin Corporation
- Operates globally with aerospace exposure, facing strict regulatory compliance risks.
Ingersoll Rand Inc.
- Diverse industrial and medical tech segments increase regulatory complexity.
5. Supply Chain & Operations
Parker-Hannifin Corporation
- Complex global supply chains with exposure to aerospace and industrial sectors.
Ingersoll Rand Inc.
- Reliance on specialized manufacturing and global distribution networks.
6. ESG & Climate Transition
Parker-Hannifin Corporation
- Increasing pressure to innovate in sustainable technologies and reduce emissions.
Ingersoll Rand Inc.
- ESG initiatives challenged by diverse product lines and geographic footprint.
7. Geopolitical Exposure
Parker-Hannifin Corporation
- Exposure to global aerospace and industrial markets sensitive to geopolitical tensions.
Ingersoll Rand Inc.
- Presence in multiple regions including Middle East and Asia adds geopolitical risk.
Which company shows a better risk-adjusted profile?
Parker-Hannifin’s strongest risk lies in market valuation and competitive pressures, while Ingersoll Rand faces greater regulatory and geopolitical complexity. Parker-Hannifin’s higher Altman Z-score (7.0 vs. 3.5) and stronger Piotroski score (8 vs. 5) signal superior financial health. This translates to a better risk-adjusted profile. Notably, Parker-Hannifin’s favorable interest coverage and moderate leverage contrast with Ingersoll Rand’s higher stock volatility and regulatory burden, justifying my caution.
Final Verdict: Which stock to choose?
Parker-Hannifin’s superpower lies in its durable competitive advantage, highlighted by a consistently growing ROIC well above its cost of capital. It excels in operational efficiency and value creation, although its high valuation multiples warrant vigilance. This makes it suitable for aggressive growth portfolios willing to pay a premium for sustained profitability.
Ingersoll Rand’s strategic moat centers on its strong liquidity and solid balance sheet, offering more financial safety relative to Parker-Hannifin. While its value creation is less robust, the company appeals to investors favoring stability and moderate growth, fitting well within GARP (Growth at a Reasonable Price) portfolios.
If you prioritize durable economic moats and superior profitability, Parker-Hannifin outshines due to its efficient capital use and accelerating stock momentum. However, if you seek a more conservative profile with better liquidity and financial resilience, Ingersoll Rand offers better stability despite a less compelling moat, appealing to risk-averse investors.
Disclaimer: Investment carries a risk of loss of initial capital. The past performance is not a reliable indicator of future results. Be sure to understand risks before making an investment decision.
Go Further
I encourage you to read the complete analyses of Parker-Hannifin Corporation and Ingersoll Rand Inc. to enhance your investment decisions: