Home > Comparison > Industrials > OTIS vs IR
The strategic rivalry between Otis Worldwide Corporation and Ingersoll Rand Inc. shapes the dynamics of the Industrials sector. Otis dominates as a capital-intensive machinery manufacturer specializing in elevators and escalators, while Ingersoll Rand offers diversified industrial technologies with a focus on air, fluid, and precision equipment. This analysis compares their operational models to identify which company presents a superior risk-adjusted profile for a diversified portfolio navigating industrials’ cyclical shifts.
Table of contents
Companies Overview
Otis Worldwide Corporation and Ingersoll Rand Inc. stand as pivotal players in the industrial machinery sector, shaping infrastructure and industrial technology markets globally.
Otis Worldwide Corporation: Elevating Urban Mobility
Otis dominates the elevator and escalator market. It generates revenue by designing, manufacturing, and servicing vertical transportation systems worldwide. In 2026, Otis focuses on expanding its service network with 34,000 mechanics, aiming to enhance maintenance and modernization profitability amid urban infrastructure growth.
Ingersoll Rand Inc.: Industrial Technology Innovator
Ingersoll Rand excels in industrial and precision technologies, producing air compression, fluid transfer, and specialty equipment. Its revenue stems from diverse segments addressing critical industrial needs. The firm prioritizes broadening its integrated sales channels and innovation in energy-efficient solutions for mission-critical applications in 2026.
Strategic Collision: Similarities & Divergences
Both companies operate within industrial machinery but diverge sharply in business philosophy. Otis emphasizes a closed ecosystem focused on vertical transport maintenance, while Ingersoll Rand pursues a diversified open infrastructure approach across multiple industrial markets. Their primary battleground lies in servicing infrastructure vs. industrial manufacturing sectors. Investors face distinct risk-reward profiles shaped by Otis’s scale in urban environments and Ingersoll Rand’s technological breadth.
Income Statement Comparison
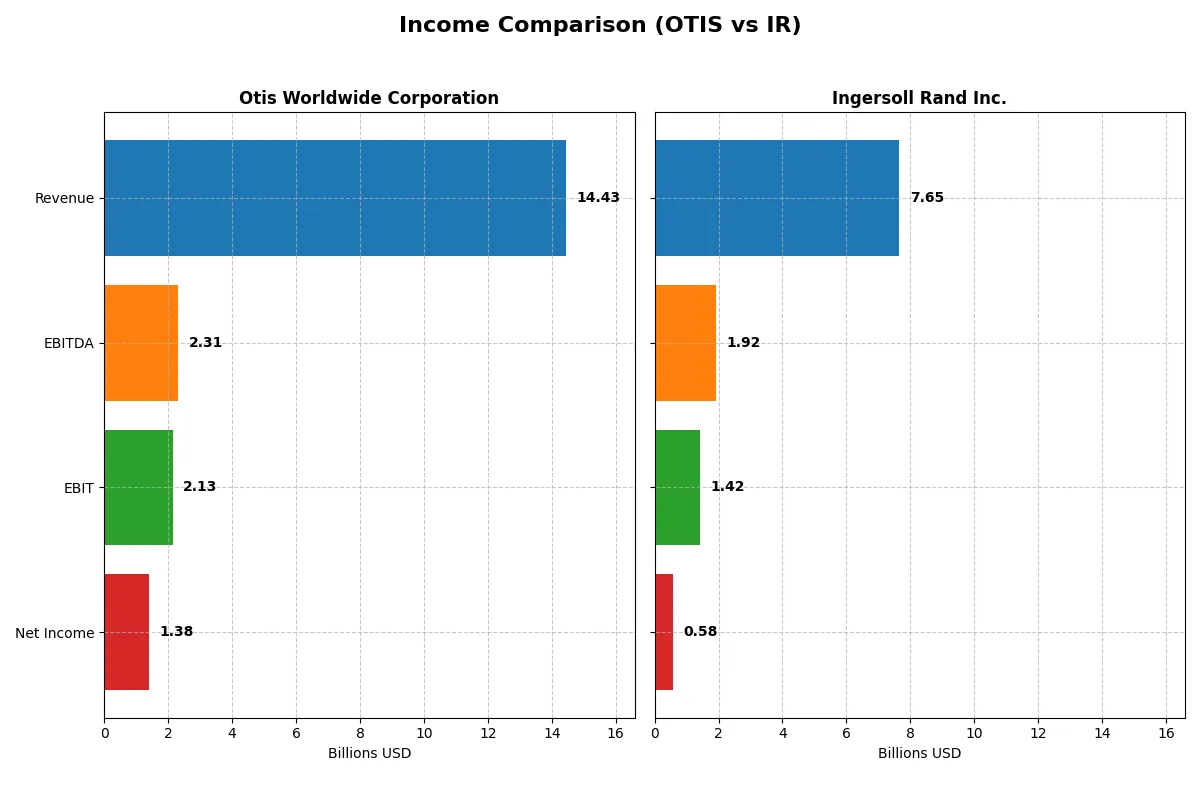
This data dissects the core profitability and scalability of both corporate engines to reveal who dominates the bottom line:
| Metric | Otis Worldwide Corporation (OTIS) | Ingersoll Rand Inc. (IR) |
|---|---|---|
| Revenue | 14.43B | 7.65B |
| Cost of Revenue | 10.06B | 4.70B |
| Operating Expenses | 2.24B | 1.53B |
| Gross Profit | 4.37B | 2.95B |
| EBITDA | 2.31B | 1.92B |
| EBIT | 2.13B | 1.42B |
| Interest Expense | 196M | 254M |
| Net Income | 1.38B | 581M |
| EPS | 3.53 | 1.46 |
| Fiscal Year | 2025 | 2025 |
Income Statement Analysis: The Bottom-Line Duel
This income statement comparison reveals the true efficiency and profitability of Otis Worldwide Corporation and Ingersoll Rand Inc. over recent years.
Otis Worldwide Corporation Analysis
Otis steadily grows revenue from 14.3B in 2021 to 14.4B in 2025, with net income rising from 1.25B to 1.38B despite a dip in 2024. Gross margin holds firm at 30.3%, while net margin remains healthy near 9.6%. The 2025 figures show improved operating efficiency and controlled expenses, sustaining solid profitability.
Ingersoll Rand Inc. Analysis
Ingersoll Rand expands revenue significantly from 5.15B in 2021 to 7.65B in 2025. Gross margin is robust at 38.5%, and EBIT margin leads at 18.5%, yet net margin is lower at 7.6%. Despite growth momentum, net income in 2025 drops to 581M due to higher interest and other expenses, signaling margin pressure.
Margin Strength vs. Revenue Growth
Otis demonstrates consistent profitability with stable margins and modest income growth, while Ingersoll Rand shows strong top-line expansion but weaker net income conversion. Otis’s margin resilience offers a clearer fundamental winner for investors seeking steady earnings. In contrast, Ingersoll Rand’s profile suits those prioritizing revenue scale over bottom-line efficiency.
Financial Ratios Comparison
These vital ratios act as a diagnostic tool to expose the underlying fiscal health, valuation premiums, and capital efficiency of the companies compared:
| Ratios | Otis Worldwide Corporation (OTIS) | Ingersoll Rand Inc. (IR) |
|---|---|---|
| ROE | -25.67% | 5.76% |
| ROIC | 39.59% | 6.36% |
| P/E | 24.85 | 54.24 |
| P/B | -6.38 | 3.13 |
| Current Ratio | 0.85 | 2.06 |
| Quick Ratio | 0.77 | 1.49 |
| D/E (Debt-to-Equity) | -1.62 | 0.47 |
| Debt-to-Assets | 82.14% | 26.15% |
| Interest Coverage | 10.88 | 5.58 |
| Asset Turnover | 1.35 | 0.42 |
| Fixed Asset Turnover | 11.13 | 8.22 |
| Payout Ratio | 46.75% | 5.47% |
| Dividend Yield | 1.88% | 0.10% |
| Fiscal Year | 2025 | 2025 |
Efficiency & Valuation Duel: The Vital Signs
Financial ratios act as a company’s DNA, exposing hidden risks and operational strengths that shape investor confidence and valuation.
Otis Worldwide Corporation
Otis shows a strong return on invested capital (ROIC) at 39.6%, signaling operational efficiency well above its 7.2% WACC. However, its negative return on equity (-25.7%) raises concerns about shareholder profitability. The stock trades at a neutral P/E of 24.9 and offers a modest 1.9% dividend yield, balancing income with reinvestment in R&D and growth.
Ingersoll Rand Inc.
Ingersoll Rand posts a modest ROIC of 6.4%, barely covering its 9.2% WACC, which suggests limited capital returns. Its 5.8% ROE remains positive but unimpressive. The stock appears expensive with a P/E of 54.2 and a low dividend yield of 0.1%, indicating a focus on liquidity and cautious shareholder returns amid slower asset turnover.
Premium Valuation vs. Operational Efficiency
Otis balances solid capital efficiency with a reasonable valuation and shareholder yield, despite weak equity returns. In contrast, Ingersoll Rand shows financial prudence with strong liquidity but suffers from stretched valuation and weaker profitability. Investors seeking operational strength may prefer Otis, while those valuing liquidity might lean toward Ingersoll Rand.
Which one offers the Superior Shareholder Reward?
I observe that Otis Worldwide (OTIS) delivers a more balanced and sustainable shareholder reward than Ingersoll Rand (IR). Otis pays a respectable 1.88% dividend yield with a moderate 47% payout ratio, backed by strong free cash flow coverage near 90%. Its buyback program supplements returns, indicating disciplined capital allocation. In contrast, Ingersoll Rand offers a negligible 0.10% dividend yield with a minuscule 5% payout, focusing heavily on reinvestment and growth, but its free cash flow yield is similar. However, IR’s lower dividend and higher valuation (P/E over 50) imply a riskier total return profile. I conclude Otis provides the superior total shareholder reward in 2026 through a proven, sustainable distribution mix and value discipline.
Comparative Score Analysis: The Strategic Profile
The radar chart reveals the fundamental DNA and trade-offs of Otis Worldwide Corporation and Ingersoll Rand Inc., highlighting their financial strengths and vulnerabilities:
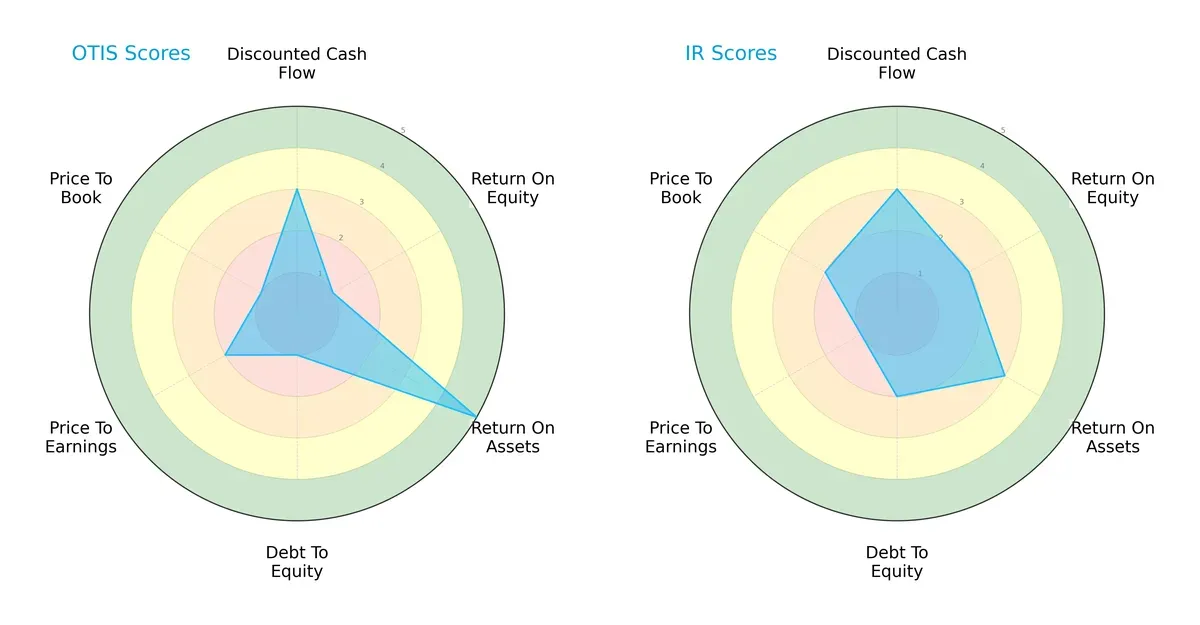
Otis shows exceptional asset efficiency with a top ROA score (5) but struggles with equity returns (ROE 1) and balance sheet leverage (Debt/Equity 1). Ingersoll Rand delivers a more balanced profile with moderate ROE (2) and ROA (3) but faces valuation pressures with very unfavorable P/E (1) and weak P/B (2) scores. Otis relies heavily on asset utilization, while Ingersoll Rand maintains steadier equity returns and debt management.
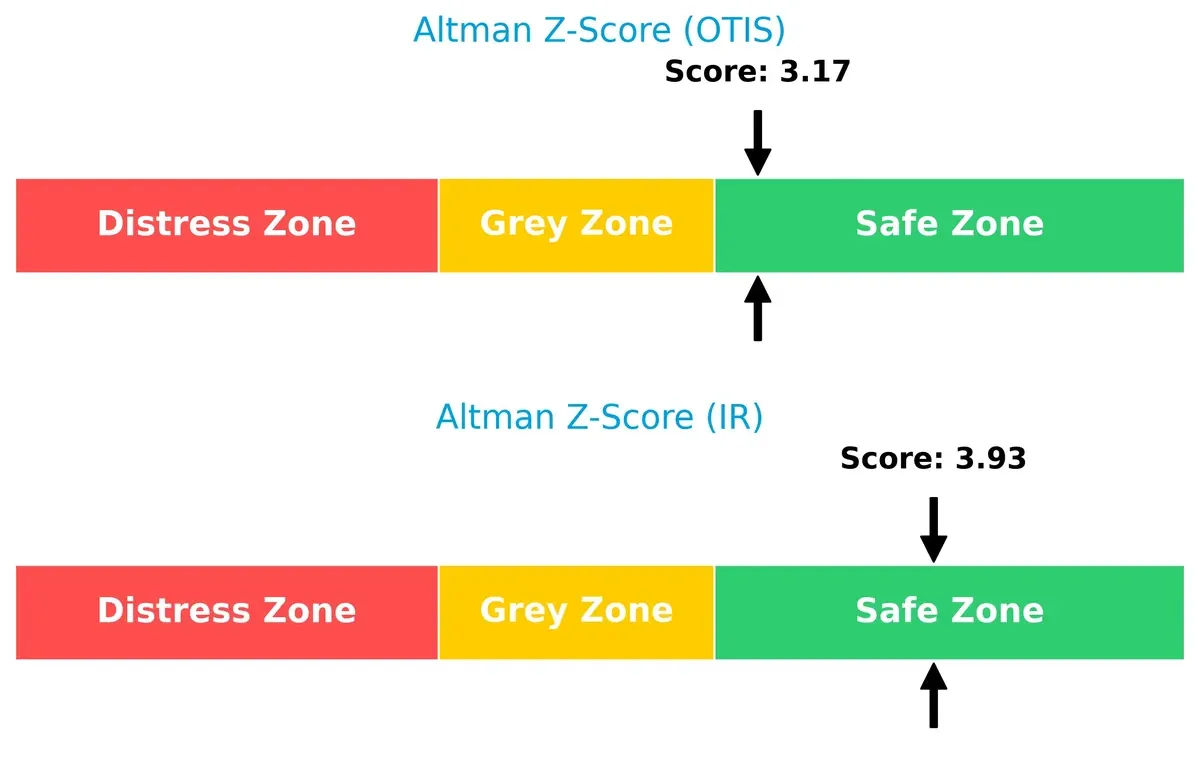
Bankruptcy Risk: Solvency Showdown
Ingersoll Rand’s higher Altman Z-Score (3.93) compared to Otis (3.17) places both firms in the safe zone, but IR exhibits a stronger buffer against bankruptcy risks in this cycle:
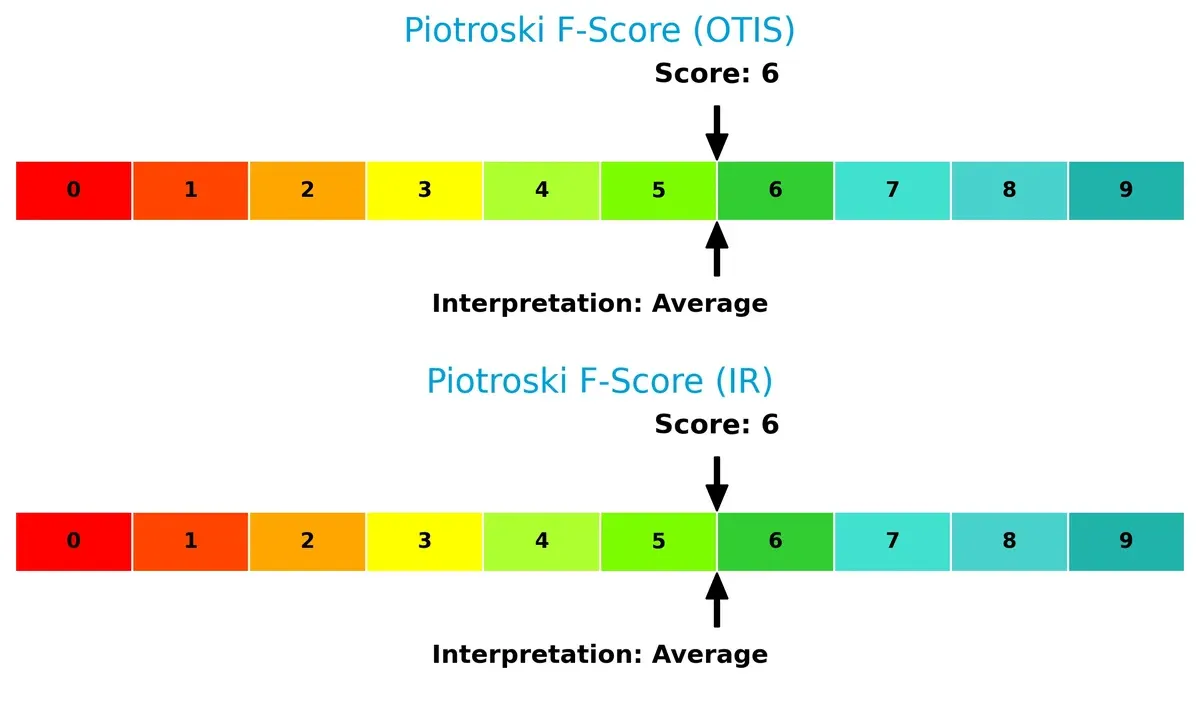
Financial Health: Quality of Operations
Both companies score an average Piotroski F-Score of 6, indicating moderate financial health without clear red flags in operational quality or profitability metrics:
How are the two companies positioned?
This section dissects Otis and Ingersoll Rand’s operational DNA by comparing revenue distribution and internal dynamics. The goal is to confront their economic moats and identify the most resilient, sustainable competitive advantage today.
Revenue Segmentation: The Strategic Mix
This visual comparison dissects how Otis and Ingersoll Rand diversify their income streams and where their primary sector bets lie:
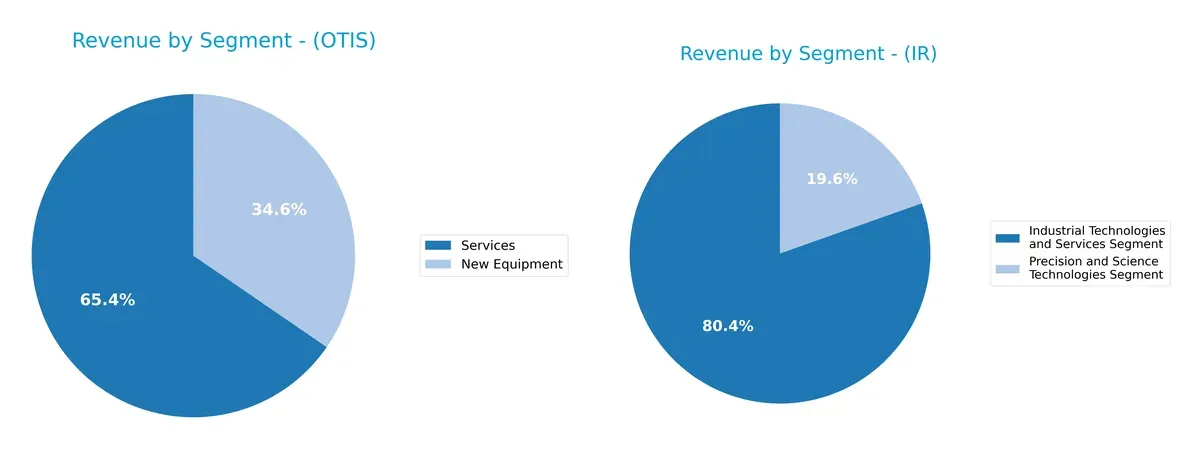
Otis anchors its revenue in two segments: Services at $9.4B and New Equipment at $5.0B in 2025, showing a balanced but service-tilted mix. Ingersoll Rand pivots around Industrial Technologies and Services at $5.8B, with a smaller $1.4B in Precision and Science Technologies, indicating higher concentration risk. Otis’s diversity supports ecosystem lock-in, while Ingersoll Rand leans on infrastructure dominance but faces exposure to its narrower segment base.
Strengths and Weaknesses Comparison
This table compares the strengths and weaknesses of Otis Worldwide Corporation and Ingersoll Rand Inc.:
Otis Strengths
- Strong service revenue of 9.4B in 2025
- Favorable ROIC of 39.6% well above WACC
- High fixed asset turnover of 11.1
- Favorable interest coverage at 10.9
- Diversified global sales including 1.65B in China
Ingersoll Rand Strengths
- Healthy liquidity with current ratio 2.06
- Favorable debt to assets at 26.1%
- Service and industrial segments diversifying revenue
- Favorable fixed asset turnover of 8.2
- Balanced geographic exposure across Americas and EMEA
Otis Weaknesses
- Unfavorable ROE at -25.7% signals poor equity returns
- High debt to assets at 82.1% raises financial risk
- Low current and quick ratios below 1
- Negative P/B ratio unusual and concerning
- Slightly lower net margin of 9.6% than typical industrial peers
Ingersoll Rand Weaknesses
- Unfavorable P/E of 54.2 suggests expensive valuation
- Lower asset turnover at 0.42 indicating less efficient use of assets
- Low dividend yield at 0.1%
- ROIC only slightly above cost of capital at 6.4%
- ROE weak at 5.8%, limiting shareholder returns
Otis shows operational efficiency and strong returns on invested capital but carries risks from high leverage and weak equity returns. Ingersoll Rand maintains solid liquidity and lower leverage but faces challenges in asset utilization and valuation metrics. Both companies exhibit unique strategic strengths and financial trade-offs.
The Moat Duel: Analyzing Competitive Defensibility
A structural moat is the only reliable shield protecting long-term profits from relentless competition erosion. Let’s dissect two industrial giants’ moats:
Otis Worldwide Corporation: Service Network Switching Costs
Otis leverages extensive service mechanics and branch networks, creating high switching costs. Its 14.8% EBIT margin and 32% ROIC premium confirm strong value creation. Expansion in emerging markets may deepen this moat by 2026.
Ingersoll Rand Inc.: Diversified Product Ecosystem
Ingersoll Rand builds a broad product and service ecosystem across multiple industries, contrasting Otis’s focused service moat. Despite a favorable EBIT margin of 18.5%, its negative ROIC spread signals value destruction, though improving profitability hints at future recovery and market expansion.
Service Network vs. Product Ecosystem: The Moat Battle
Otis boasts a deeper moat with a sustained ROIC well above WACC, reflecting efficient capital use and durable competitive advantage. Ingersoll Rand’s ecosystem is broader but less defensible financially. Otis stands better positioned to defend and grow its market share in 2026.
Which stock offers better returns?
The past year reveals contrasting dynamics: Otis Worldwide faces a sustained decline with accelerating losses, while Ingersoll Rand posts steady gains supported by strong buyer momentum.
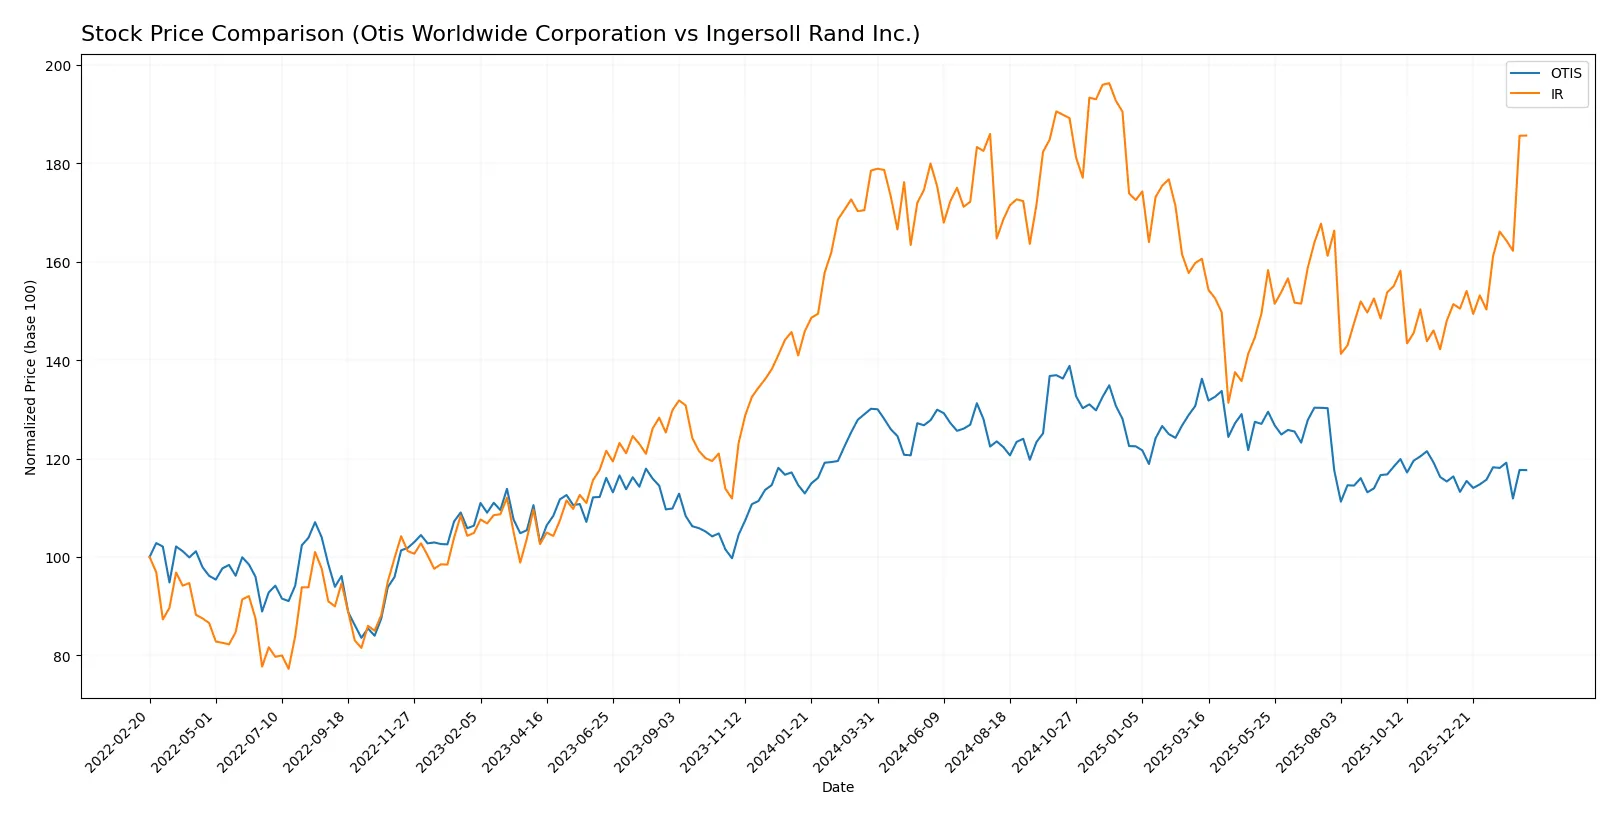
Trend Comparison
Otis Worldwide Corporation’s stock dropped 9.57% over 12 months, marking a bearish trend with accelerating decline. Its price ranged between 84.93 and 106.01, showing moderate volatility.
Ingersoll Rand Inc. gained 3.99% over the same period, indicating a bullish trend with accelerating upward momentum. Price fluctuated from 69.7 to 104.17, exhibiting higher volatility.
Ingersoll Rand outperformed Otis, delivering positive returns versus Otis’s notable decline over the past year.
Target Prices
Analysts present a cautiously optimistic consensus for Otis Worldwide Corporation and Ingersoll Rand Inc.
| Company | Target Low | Target High | Consensus |
|---|---|---|---|
| Otis Worldwide Corporation | 92 | 109 | 97.75 |
| Ingersoll Rand Inc. | 87 | 100 | 93 |
The target consensus for Otis suggests a moderate upside from its current 89.83 USD price, while Ingersoll Rand’s consensus at 93 USD slightly trails its current 98.52 USD price, indicating mixed analyst expectations.

Don’t Let Luck Decide Your Entry Point
Optimize your entry points with our advanced ProRealTime indicators. You’ll get efficient buy signals with precise price targets for maximum performance. Start outperforming now!
How do institutions grade them?
Here is a comparison of recent institutional grades for Otis Worldwide Corporation and Ingersoll Rand Inc.:
Otis Worldwide Corporation Grades
The following table summarizes recent grade actions by established financial institutions for Otis Worldwide:
| Grading Company | Action | New Grade | Date |
|---|---|---|---|
| JP Morgan | Maintain | Overweight | 2026-01-16 |
| Wells Fargo | Maintain | Equal Weight | 2025-12-15 |
| Barclays | Maintain | Underweight | 2025-10-30 |
| JP Morgan | Maintain | Overweight | 2025-10-15 |
| Wolfe Research | Upgrade | Outperform | 2025-10-08 |
| Wells Fargo | Maintain | Equal Weight | 2025-10-06 |
| JP Morgan | Maintain | Overweight | 2025-09-18 |
| RBC Capital | Maintain | Outperform | 2025-07-28 |
| Wolfe Research | Upgrade | Peer Perform | 2025-07-25 |
| JP Morgan | Maintain | Overweight | 2025-07-24 |
Ingersoll Rand Inc. Grades
Below is a summary of recent grades and actions from major grading firms for Ingersoll Rand:
| Grading Company | Action | New Grade | Date |
|---|---|---|---|
| Stifel | Maintain | Hold | 2026-01-23 |
| Citigroup | Maintain | Buy | 2026-01-12 |
| Wells Fargo | Maintain | Overweight | 2026-01-07 |
| Stifel | Maintain | Hold | 2025-12-16 |
| Citigroup | Maintain | Buy | 2025-12-08 |
| Citigroup | Maintain | Buy | 2025-11-03 |
| Baird | Maintain | Outperform | 2025-11-03 |
| Stifel | Maintain | Hold | 2025-10-20 |
| Wells Fargo | Maintain | Overweight | 2025-10-06 |
| Morgan Stanley | Maintain | Equal Weight | 2025-08-13 |
Which company has the best grades?
Ingersoll Rand has consistently earned Buy and Overweight ratings from top firms, while Otis shows a mix with several Overweight and Outperform ratings but also Underweight. This suggests Ingersoll Rand currently holds a stronger consensus, potentially attracting more investor confidence.
Risks specific to each company
The following categories identify critical pressure points and systemic threats facing Otis Worldwide Corporation and Ingersoll Rand Inc. in the 2026 market environment:
1. Market & Competition
Otis Worldwide Corporation
- Operates in elevator/escalator niche with strong service network but faces mature market growth.
Ingersoll Rand Inc.
- Competes in diversified industrial tech with exposure to multiple sectors, increasing competitive complexity.
2. Capital Structure & Debt
Otis Worldwide Corporation
- High debt-to-assets ratio (82%) signals leverage risk despite solid interest coverage.
Ingersoll Rand Inc.
- Lower leverage (26%) and better liquidity ratios reduce financial distress risk.
3. Stock Volatility
Otis Worldwide Corporation
- Beta near 1.0 indicates market-correlated volatility, stable but sensitive to sector shifts.
Ingersoll Rand Inc.
- Higher beta (1.31) suggests greater price swings and sensitivity to market cycles.
4. Regulatory & Legal
Otis Worldwide Corporation
- Compliance risks tied to international safety and building codes in elevator installations.
Ingersoll Rand Inc.
- Exposure to diverse regulations across medical, industrial, and environmental sectors.
5. Supply Chain & Operations
Otis Worldwide Corporation
- Large global service network requires complex logistics; susceptible to labor and parts shortages.
Ingersoll Rand Inc.
- Complex manufacturing with multiple product lines increases supply chain disruption risks.
6. ESG & Climate Transition
Otis Worldwide Corporation
- Pressure to improve energy efficiency in products amid rising ESG investor scrutiny.
Ingersoll Rand Inc.
- Faces risks from energy transition and emissions regulations across industrial technologies.
7. Geopolitical Exposure
Otis Worldwide Corporation
- Global footprint includes China and emerging markets, vulnerable to trade tensions.
Ingersoll Rand Inc.
- Wider geographic spread including Europe and Asia exposes it to varied geopolitical risks.
Which company shows a better risk-adjusted profile?
Otis faces its largest risk in capital structure, with a high leverage ratio threatening financial flexibility. Ingersoll Rand’s biggest concern is stock volatility, driven by its broader industrial scope and higher beta. Despite Otis’s leverage, its strong ROIC and operational efficiency offer stability. Ingersoll Rand benefits from lower debt and better liquidity but endures greater market price swings and valuation risk, as shown by its high P/E ratio. Overall, Otis presents a slightly better risk-adjusted profile due to its safer financial distress zone and focused market position.
Final Verdict: Which stock to choose?
Otis Worldwide Corporation’s superpower lies in its robust capital efficiency and strong economic moat, evidenced by a very favorable ROIC well above its cost of capital. However, its tight liquidity position remains a point of vigilance. Otis suits investors targeting aggressive growth with a tolerance for short-term balance sheet risks.
Ingersoll Rand Inc. boasts a strategic moat anchored in its healthier liquidity and lower leverage, providing a safer financial profile. Though its returns on invested capital lag behind Otis, its steady revenue growth and strong operating cash flow make it a fit for GARP investors seeking a balance between growth and stability.
If you prioritize capital efficiency and competitive advantage, Otis outshines with its value creation and profitability edge. However, if you seek better financial stability and consistent cash generation, Ingersoll Rand offers superior safety and growth resilience despite commanding a premium. Both stocks present analytical scenarios aligned with distinct investor profiles.
Disclaimer: Investment carries a risk of loss of initial capital. The past performance is not a reliable indicator of future results. Be sure to understand risks before making an investment decision.
Go Further
I encourage you to read the complete analyses of Otis Worldwide Corporation and Ingersoll Rand Inc. to enhance your investment decisions: