Ingersoll Rand Inc. and Nano Nuclear Energy Inc. both operate within the industrial machinery sector but represent distinct approaches to innovation and market focus. Ingersoll Rand is a well-established industrial giant specializing in air, fluid, and energy technologies, while Nano Nuclear Energy pioneers microreactor nuclear technology with promising clean energy solutions. This comparison spotlights their contrasting strategies and growth potential, helping you decide which company aligns best with your investment goals.
Table of contents
Companies Overview
I will begin the comparison between Ingersoll Rand Inc. and Nano Nuclear Energy Inc by providing an overview of these two companies and their main differences.
Ingersoll Rand Inc. Overview
Ingersoll Rand Inc. is a longstanding industrial firm founded in 1859 and headquartered in Davidson, North Carolina. It provides mission-critical air, fluid, energy, specialty vehicle, and medical technologies globally. The company operates through two segments, Industrial Technologies and Services, and Precision and Science Technologies, serving diverse markets including medical, industrial manufacturing, and energy with a broad portfolio of products and brands.
Nano Nuclear Energy Inc Overview
Nano Nuclear Energy Inc., based in New York City and founded in 2021, focuses on microreactor technology development. The company is advancing innovative nuclear reactors such as ZEUS and ODIN, alongside fuel fabrication capabilities for the nuclear sector. With a small workforce, it also engages in nuclear fuel transportation and consultation, positioning itself in a niche but emerging segment within the industrial machinery sector.
Key similarities and differences
Both companies operate in the industrial machinery industry and are headquartered in the United States, but they differ significantly in scale and focus. Ingersoll Rand is a large, diversified manufacturer with a broad product range and global presence, while Nano Nuclear is a small, specialized firm concentrating on advanced nuclear microreactors and related services. Their business models contrast between established industrial manufacturing and innovative nuclear technology development.
Income Statement Comparison
Below is a comparison of the most recent fiscal year income statement metrics for Ingersoll Rand Inc. and Nano Nuclear Energy Inc.

| Metric | Ingersoll Rand Inc. (IR) | Nano Nuclear Energy Inc (NNE) |
|---|---|---|
| Market Cap | 33.8B | 1.33B |
| Revenue | 7.23B | 0 |
| EBITDA | 1.83B | -46.2M |
| EBIT | 1.35B | 0 |
| Net Income | 839M | -40.1M |
| EPS | 2.08 | -1.06 |
| Fiscal Year | 2024 | 2025 |
Income Statement Interpretations
Ingersoll Rand Inc.
Ingersoll Rand’s revenue increased steadily from $3.97B in 2020 to $7.24B in 2024, with net income rising sharply from a loss of $33M in 2020 to $839M in 2024. Margins improved notably, with a gross margin of 43.81% and net margin of 11.59% in 2024. The latest year showed a moderate revenue growth of 5.22% and favorable EPS growth of 8.42%, reflecting solid operational leverage.
Nano Nuclear Energy Inc
Nano Nuclear Energy reported no revenue from 2022 to 2025 and consistent net losses, increasing from -$1.03M in 2022 to -$40.07M in 2025. Margins remain unfavorable due to zero revenue and ongoing expenses, with a negative gross margin and net margin of 0%. While EPS improved nearly 100% year-over-year, the company faces continued challenges in generating positive earnings or revenue.
Which one has the stronger fundamentals?
Ingersoll Rand exhibits stronger fundamentals with consistent revenue growth, positive and expanding margins, and improving earnings over five years. Conversely, Nano Nuclear Energy remains in the development stage with no revenue and significant losses, resulting in an unfavorable income statement profile. Thus, Ingersoll Rand’s track record indicates a more stable income statement performance.
Financial Ratios Comparison
Below is a comparison of key financial ratios for Ingersoll Rand Inc. and Nano Nuclear Energy Inc., based on the most recent fiscal year data available.
| Ratios | Ingersoll Rand Inc. (2024) | Nano Nuclear Energy Inc (2025) |
|---|---|---|
| ROE | 8.24% | -18.00% |
| ROIC | 6.11% | -20.51% |
| P/E | 43.51 | -0.04 |
| P/B | 3.58 | 0.007 |
| Current Ratio | 2.29 | 53.48 |
| Quick Ratio | 1.71 | 53.48 |
| D/E | 0.49 | 0.01 |
| Debt-to-Assets | 27.65% | 1.22% |
| Interest Coverage | 6.10 | 0 |
| Asset Turnover | 0.40 | 0 |
| Fixed Asset Turnover | 8.59 | 0 |
| Payout ratio | 3.85% | 0 |
| Dividend yield | 0.09% | 0 |
Interpretation of the Ratios
Ingersoll Rand Inc.
Ingersoll Rand exhibits a balanced ratio profile with 50% favorable, 35.7% unfavorable, and 14.3% neutral ratios, leading to a slightly favorable overall assessment. Strong current and quick ratios (2.29 and 1.71) and low debt levels support financial stability, but its high PE (43.51) and low asset turnover (0.4) raise concerns. The company pays a dividend with a low yield of 0.09%, indicating modest shareholder returns with no apparent risk of unsustainable payouts.
Nano Nuclear Energy Inc
Nano Nuclear Energy shows a predominantly unfavorable ratio profile, with 64.3% of ratios negative and 35.7% favorable, resulting in an overall unfavorable rating. Despite excellent leverage metrics, including a low debt-to-equity ratio (0.01) and debt-to-assets (1.22%), its negative profitability ratios and zero dividend reflect ongoing losses and reinvestment focus. The company does not pay dividends, consistent with its early-stage, high-growth microreactor development phase.
Which one has the best ratios?
Ingersoll Rand holds the advantage with a more balanced and slightly favorable ratio profile, underpinned by solid liquidity and manageable debt. Nano Nuclear Energy’s ratios reflect the challenges of a nascent company with sustained losses and extreme volatility. Thus, Ingersoll Rand demonstrates relatively stronger financial health based on the available metrics.
Strategic Positioning
This section compares the strategic positioning of Ingersoll Rand Inc. and Nano Nuclear Energy Inc. regarding market position, key segments, and exposure to technological disruption:
Ingersoll Rand Inc.
- Established industrial machinery leader facing moderate competitive pressure in global markets.
- Diverse segments including Industrial Technologies and Services, Precision and Science Technologies driving revenue growth.
- Moderate exposure with established technologies; incremental innovation in air, fluid, and medical technologies.
Nano Nuclear Energy Inc
- Emerging microreactor technology company in a niche sector with high volatility and competition.
- Focused on microreactors, fuel fabrication, and nuclear consultation with a concentrated business model.
- High exposure to disruption due to advanced nuclear microreactor development and novel fuel technologies.
Ingersoll Rand Inc. vs Nano Nuclear Energy Inc. Positioning
Ingersoll Rand maintains a diversified portfolio across multiple industrial segments, providing stable revenue streams but facing steady competition. Nano Nuclear Energy operates a highly concentrated, innovation-driven model in nuclear microreactors, with potential growth but greater technological and market risks.
Which has the best competitive advantage?
Both companies are currently shedding value with growing profitability trends, resulting in a slightly unfavorable moat status. Their competitive advantages are limited; Ingersoll Rand benefits from diversification while Nano Nuclear Energy faces high uncertainty from its emerging technology focus.
Stock Comparison
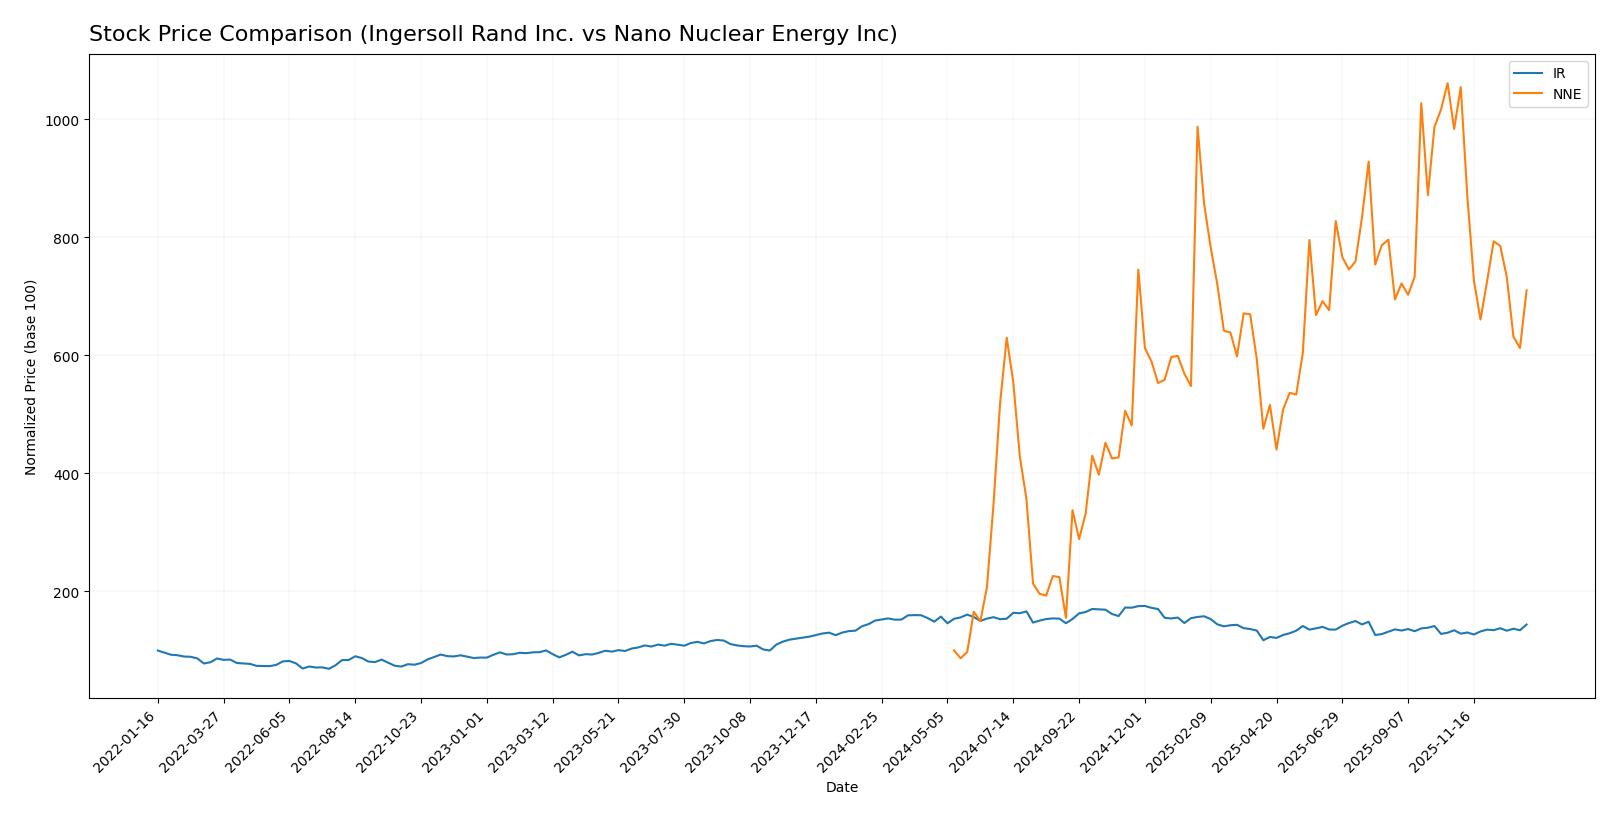
The stock price chart illustrates significant divergences in performance and trading dynamics between Ingersoll Rand Inc. and Nano Nuclear Energy Inc. over the past year, highlighting contrasting bullish and bearish movements as well as recent shifts in momentum.
Trend Analysis
Ingersoll Rand Inc. experienced a bearish trend over the past 12 months with a price decline of 4.43%, showing acceleration in the downward movement and a high volatility level of 8.07, reaching a peak of 104.17 and a low of 69.7.
Nano Nuclear Energy Inc. delivered a strong bullish trend over the same period with a remarkable 609.76% price increase, though the uptrend showed signs of deceleration, accompanied by higher volatility at 10.81 and price ranging from 3.92 to 47.84.
Comparing both, Nano Nuclear Energy Inc. outperformed Ingersoll Rand Inc. substantially in market performance despite a recent negative trend, reflecting a more pronounced overall growth trajectory.
Target Prices
Analysts present a clear consensus on target prices for Ingersoll Rand Inc. and Nano Nuclear Energy Inc.
| Company | Target High | Target Low | Consensus |
|---|---|---|---|
| Ingersoll Rand Inc. | 100 | 81 | 91.5 |
| Nano Nuclear Energy Inc | 50 | 50 | 50 |
The consensus target price for Ingersoll Rand Inc. at 91.5 suggests upside potential compared to its current price of 85.51 USD. Nano Nuclear Energy Inc.’s fixed target of 50 indicates strong expected growth from its current 32.01 USD.
Analyst Opinions Comparison
This section compares analysts’ ratings and grades for Ingersoll Rand Inc. and Nano Nuclear Energy Inc.:
Rating Comparison
IR Rating
- Rating: C+, classified as Very Favorable by analysts.
- Discounted Cash Flow Score: Moderate at 3 out of 5.
- ROE Score: Moderate at 2, indicating decent profitability.
- ROA Score: Moderate at 3, showing reasonable asset use.
- Debt To Equity Score: Moderate at 2, reflecting moderate financial risk.
- Overall Score: Moderate at 2, reflecting average overall financial health.
NNE Rating
- Rating: C, also classified as Very Favorable by analysts.
- Discounted Cash Flow Score: Moderate at 2 out of 5.
- ROE Score: Very Unfavorable at 1, indicating weak profitability.
- ROA Score: Very Unfavorable at 1, showing poor asset use.
- Debt To Equity Score: Very Favorable at 5, indicating low financial risk.
- Overall Score: Moderate at 2, reflecting average overall financial health.
Which one is the best rated?
Based strictly on the provided data, IR has stronger profitability metrics with better ROE and ROA scores and a higher DCF score, while NNE shows lower financial risk with a superior debt-to-equity score. Both have the same overall moderate score and very favorable rating status.
Scores Comparison
The scores comparison between Ingersoll Rand Inc. and Nano Nuclear Energy Inc. is as follows:
Ingersoll Rand Inc. Scores
- Altman Z-Score: 3.27, indicating a safe financial zone
- Piotroski Score: 5, representing average financial strength
Nano Nuclear Energy Inc Scores
- Altman Z-Score: 143.56, indicating a safe financial zone
- Piotroski Score: 2, representing very weak financial strength
Which company has the best scores?
Based on the provided data, Nano Nuclear Energy Inc. has a much higher Altman Z-Score, indicating strong financial stability, but Ingersoll Rand Inc. has a significantly better Piotroski Score, showing stronger financial health.
Grades Comparison
Here is a comparison of the recent grades for Ingersoll Rand Inc. and Nano Nuclear Energy Inc.:
Ingersoll Rand Inc. Grades
The following table summarizes recent grades assigned to Ingersoll Rand Inc. by established financial institutions.
| Grading Company | Action | New Grade | Date |
|---|---|---|---|
| Wells Fargo | Maintain | Overweight | 2026-01-07 |
| Stifel | Maintain | Hold | 2025-12-16 |
| Citigroup | Maintain | Buy | 2025-12-08 |
| Citigroup | Maintain | Buy | 2025-11-03 |
| Baird | Maintain | Outperform | 2025-11-03 |
| Stifel | Maintain | Hold | 2025-10-20 |
| Wells Fargo | Maintain | Overweight | 2025-10-06 |
| Morgan Stanley | Maintain | Equal Weight | 2025-08-13 |
| Barclays | Maintain | Overweight | 2025-08-04 |
| Stifel | Maintain | Hold | 2025-08-04 |
Ingersoll Rand’s grades mostly range from Hold to Buy/Overweight, showing steady positive sentiment with no recent downgrades.
Nano Nuclear Energy Inc. Grades
Below are recent grades for Nano Nuclear Energy Inc. from recognized grading firms.
| Grading Company | Action | New Grade | Date |
|---|---|---|---|
| HC Wainwright & Co. | Maintain | Buy | 2025-08-19 |
| Ladenburg Thalmann | Downgrade | Sell | 2025-08-18 |
| HC Wainwright & Co. | Maintain | Buy | 2025-08-15 |
| HC Wainwright & Co. | Maintain | Buy | 2025-03-31 |
| HC Wainwright & Co. | Maintain | Buy | 2025-01-29 |
| HC Wainwright & Co. | Maintain | Buy | 2024-11-27 |
| Benchmark | Maintain | Buy | 2024-11-07 |
| Benchmark | Maintain | Buy | 2024-07-15 |
| Benchmark | Maintain | Buy | 2024-06-25 |
Nano Nuclear Energy shows predominantly Buy ratings, but there is a notable recent downgrade to Sell by Ladenburg Thalmann.
Which company has the best grades?
Ingersoll Rand Inc. holds a broader consensus with multiple Buy and Hold ratings from top firms, reflecting a stable outlook. Nano Nuclear Energy Inc. has mostly Buy ratings but also a Sell downgrade, indicating mixed sentiment and potentially higher risk for investors.
Strengths and Weaknesses
Here is a comparative overview of the strengths and weaknesses of Ingersoll Rand Inc. (IR) and Nano Nuclear Energy Inc. (NNE) based on their latest financials, profitability, innovation, and market presence.
| Criterion | Ingersoll Rand Inc. (IR) | Nano Nuclear Energy Inc. (NNE) |
|---|---|---|
| Diversification | Strong diversification with Industrial Technologies & Services and Precision & Science Technologies segments generating over $7.9B combined in 2024 | Limited diversification; focus is narrow with emerging nuclear tech, no significant reported revenue segments |
| Profitability | Moderate profitability: 11.6% net margin, ROIC 6.1% (neutral), but ROE low at 8.2%, indicating room for improvement | Negative profitability: net margin 0%, ROIC -20.5%, ROE -18%, reflecting loss-making status typical for early-stage tech companies |
| Innovation | Incremental innovation in industrial and precision tech, maintaining steady revenue growth | High innovation potential in nuclear energy, but financials show value destruction; early growth phase |
| Global presence | Established global footprint with sustained revenue growth in multiple segments | Limited global presence; still developing market and operational scale |
| Market Share | Solid presence in industrial technologies with growing revenues, but facing competitive pressures | Small market share due to early development stage and niche technology focus |
Key takeaways: Ingersoll Rand offers stable diversification and moderate profitability with a slightly unfavorable economic moat but improving returns. Nano Nuclear Energy is in an early, loss-making phase with promising innovation but high financial risk and limited market presence. Investors should weigh IR’s stability against NNE’s growth potential and risk.
Risk Analysis
Below is a comparative table of key risks for Ingersoll Rand Inc. (IR) and Nano Nuclear Energy Inc. (NNE) based on the most recent data.
| Metric | Ingersoll Rand Inc. (IR) | Nano Nuclear Energy Inc. (NNE) |
|---|---|---|
| Market Risk | Moderate (Beta 1.33) | High (Beta 7.49) |
| Debt Level | Moderate (Debt/Equity 0.49) | Very Low (Debt/Equity 0.01) |
| Regulatory Risk | Moderate (Industrial & Energy) | High (Nuclear energy regulations) |
| Operational Risk | Moderate (21K employees, global) | High (Early-stage technology, 5 employees) |
| Environmental Risk | Moderate (Industrial emissions) | High (Nuclear safety & waste concerns) |
| Geopolitical Risk | Moderate (Global operations) | Moderate-High (Nuclear tech sensitivity) |
The most likely and impactful risks are market volatility for NNE due to its high beta and regulatory hurdles in nuclear energy. Ingersoll Rand faces moderate operational and environmental risks but benefits from a stable debt profile and diversified markets. Investors should weigh NNE’s growth potential against its high regulatory and operational risks.
Which Stock to Choose?
Ingersoll Rand Inc. (IR) shows a favorable income evolution with strong growth in revenue and net income over the 2020-2024 period. Its financial ratios are slightly favorable overall, supported by good margins and sound liquidity, with manageable debt levels and a very favorable rating of C+.
Nano Nuclear Energy Inc (NNE) presents an unfavorable income statement trend marked by losses and negative profitability metrics. Its financial ratios are mainly unfavorable despite low debt and valuation metrics, with a very favorable rating of C but weaker scores in profitability and asset utilization.
For investors focused on growth, NNE’s bullish stock trend and potential for profitability improvement might appear attractive, while those prioritizing financial stability and consistent profitability may find IR’s slightly favorable ratio profile and favorable income evolution more aligned with their risk tolerance.
Disclaimer: Investment carries a risk of loss of initial capital. The past performance is not a reliable indicator of future results. Be sure to understand risks before making an investment decision.
Go Further
I encourage you to read the complete analyses of Ingersoll Rand Inc. and Nano Nuclear Energy Inc to enhance your investment decisions: