In the competitive industrial machinery sector, Ingersoll Rand Inc. and Kadant Inc. stand out as key players with overlapping markets and distinct innovation strategies. Ingersoll Rand focuses on air, fluid, and energy technologies, while Kadant excels in flow control and material handling systems. Comparing their market positions and growth potential offers valuable insights. Join me as we explore which company presents the most compelling investment opportunity in 2026.
Table of contents
Companies Overview
I will begin the comparison between Ingersoll Rand Inc. and Kadant Inc. by providing an overview of these two companies and their main differences.
Ingersoll Rand Inc. Overview
Ingersoll Rand Inc. operates in the industrial machinery sector, providing mission-critical air, fluid, energy, specialty vehicle, and medical technologies globally. The company serves diverse markets including medical, industrial manufacturing, water treatment, and agriculture. It operates through Industrial Technologies and Services and Precision and Science Technologies segments, emphasizing a broad product range and extensive aftermarket services.
Kadant Inc. Overview
Kadant Inc. supplies engineered systems and technologies worldwide, focusing on flow control, industrial processing, and material handling. Its product portfolio includes fluid-handling systems, pulping equipment, and conveying machinery tailored to packaging, wood products, and alternative fuel industries. Kadant’s operations emphasize specialized industrial solutions with a more focused segment structure compared to its peer.
Key similarities and differences
Both companies belong to the industrial machinery sector and serve global markets with engineered solutions. Ingersoll Rand has a broader product range spanning multiple critical applications and industries, while Kadant concentrates on flow control, industrial processing, and material handling with a niche focus. Ingersoll Rand’s scale and employee base are larger, reflecting a more diversified industrial footprint versus Kadant’s specialized market segments.
Income Statement Comparison
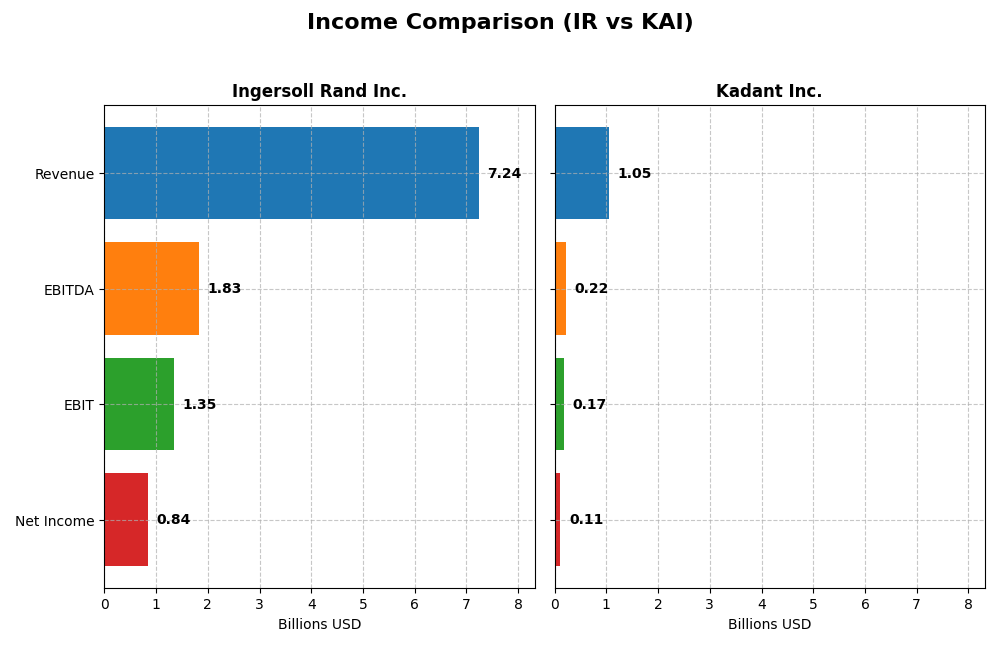
This table presents a side-by-side comparison of key income statement metrics for Ingersoll Rand Inc. and Kadant Inc. for the fiscal year 2024, highlighting their financial performance.
| Metric | Ingersoll Rand Inc. (IR) | Kadant Inc. (KAI) |
|---|---|---|
| Market Cap | 33.8B | 3.76B |
| Revenue | 7.24B | 1.05B |
| EBITDA | 1.83B | 223M |
| EBIT | 1.35B | 173M |
| Net Income | 839M | 112M |
| EPS | 2.08 | 9.51 |
| Fiscal Year | 2024 | 2024 |
Income Statement Interpretations
Ingersoll Rand Inc.
Ingersoll Rand has shown strong revenue growth from $3.97B in 2020 to $7.24B in 2024, with net income increasing substantially from a loss of $33M in 2020 to $839M in 2024. Margins have improved, notably gross margin at 43.81% and net margin at 11.59% in 2024. The latest year saw moderate revenue growth of 5.22% and favorable EBIT growth of 13.32%, indicating margin expansion and operational efficiency gains.
Kadant Inc.
Kadant’s revenue rose steadily from $635M in 2020 to $1.05B in 2024, with net income increasing from $55M to $112M in the same period. Gross margin remained stable at 44.25% in 2024, while net margin was 10.59%. However, the 2024 net income and EPS declined by 12.59% and 4.24% respectively, despite a healthy revenue growth of nearly 10%, suggesting margin pressure or higher expenses impacting profitability.
Which one has the stronger fundamentals?
Ingersoll Rand demonstrates more robust overall income statement growth, with significant improvements in net income and margins over five years and favorable one-year margin expansions. Kadant shows consistent revenue increases but recent declines in net margin and EPS raise concerns. Both have favorable income statements, but Ingersoll Rand’s stronger margin gains and higher net income growth indicate comparatively stronger fundamentals.
Financial Ratios Comparison
The table below compares key financial ratios for Ingersoll Rand Inc. (IR) and Kadant Inc. (KAI) based on their most recent fiscal year data, providing a snapshot of their profitability, liquidity, leverage, and efficiency.
| Ratios | Ingersoll Rand Inc. (IR) | Kadant Inc. (KAI) |
|---|---|---|
| ROE | 8.2% | 13.2% |
| ROIC | 6.1% | 10.1% |
| P/E | 43.5 | 36.9 |
| P/B | 3.58 | 4.86 |
| Current Ratio | 2.29 | 2.31 |
| Quick Ratio | 1.71 | 1.55 |
| D/E | 0.49 | 0.38 |
| Debt-to-Assets | 27.7% | 22.6% |
| Interest Coverage | 6.10 | 8.55 |
| Asset Turnover | 0.40 | 0.74 |
| Fixed Asset Turnover | 8.59 | 6.18 |
| Payout Ratio | 3.9% | 13.1% |
| Dividend Yield | 0.09% | 0.36% |
Interpretation of the Ratios
Ingersoll Rand Inc.
Ingersoll Rand displays a mix of strong and weak ratios. It boasts favorable current and quick ratios, manageable debt levels, and solid interest coverage, but its return on equity and price multiples appear less attractive. The dividend yield is very low at 0.09%, indicating limited shareholder returns, with a cautious view on payout sustainability and buyback activity due to weak free cash flow to equity.
Kadant Inc.
Kadant shows generally favorable financial ratios, including a solid net margin, strong return on invested capital, and good liquidity metrics. Its debt profile and interest coverage are also favorable, though price multiples remain elevated. The dividend yield stands at 0.36%, which, while still low, suggests a moderate shareholder return, balanced by a reinvestment strategy focused on R&D and acquisitions.
Which one has the best ratios?
Kadant’s ratios are overall more favorable, with a higher percentage of positive metrics and stronger returns on capital, despite similar concerns over valuation multiples. Ingersoll Rand presents a more mixed picture with some strengths in liquidity and leverage but weaker profitability and shareholder return profiles. Kadant’s financial health appears comparatively stronger based on the 2024 data.
Strategic Positioning
This section compares the strategic positioning of Ingersoll Rand Inc. and Kadant Inc., including market position, key segments, and exposure to technological disruption:
Ingersoll Rand Inc.
- Large market cap of 33.8B USD, operating globally with many brands, facing competitive industrial machinery market pressure.
- Focuses on Industrial Technologies and Services plus Precision and Science Technologies segments, serving diverse end-markets.
- Exposure to technological disruption likely moderate, given reliance on traditional machinery and fluid management technologies.
Kadant Inc.
- Smaller market cap of 3.76B USD, specialized in engineered systems with moderate competitive pressure in industrial machinery.
- Operates in three segments: Flow Control, Industrial Processing, and Material Handling, targeting packaging and wood industries.
- Also exposed to disruption through engineered systems and fluid-handling technologies, with some focus on renewable and biodegradable products.
Ingersoll Rand Inc. vs Kadant Inc. Positioning
Ingersoll Rand shows a diversified approach across multiple industrial and precision technology segments, while Kadant concentrates on engineered systems with a narrower industrial focus. Ingersoll Rand’s scale offers broader market reach, Kadant’s specialization targets niche segments.
Which has the best competitive advantage?
Kadant holds a slightly favorable moat status with growing profitability, though it is still shedding value. Ingersoll Rand shows a slightly unfavorable moat, also shedding value but with a stronger ROIC growth trend.
Stock Comparison
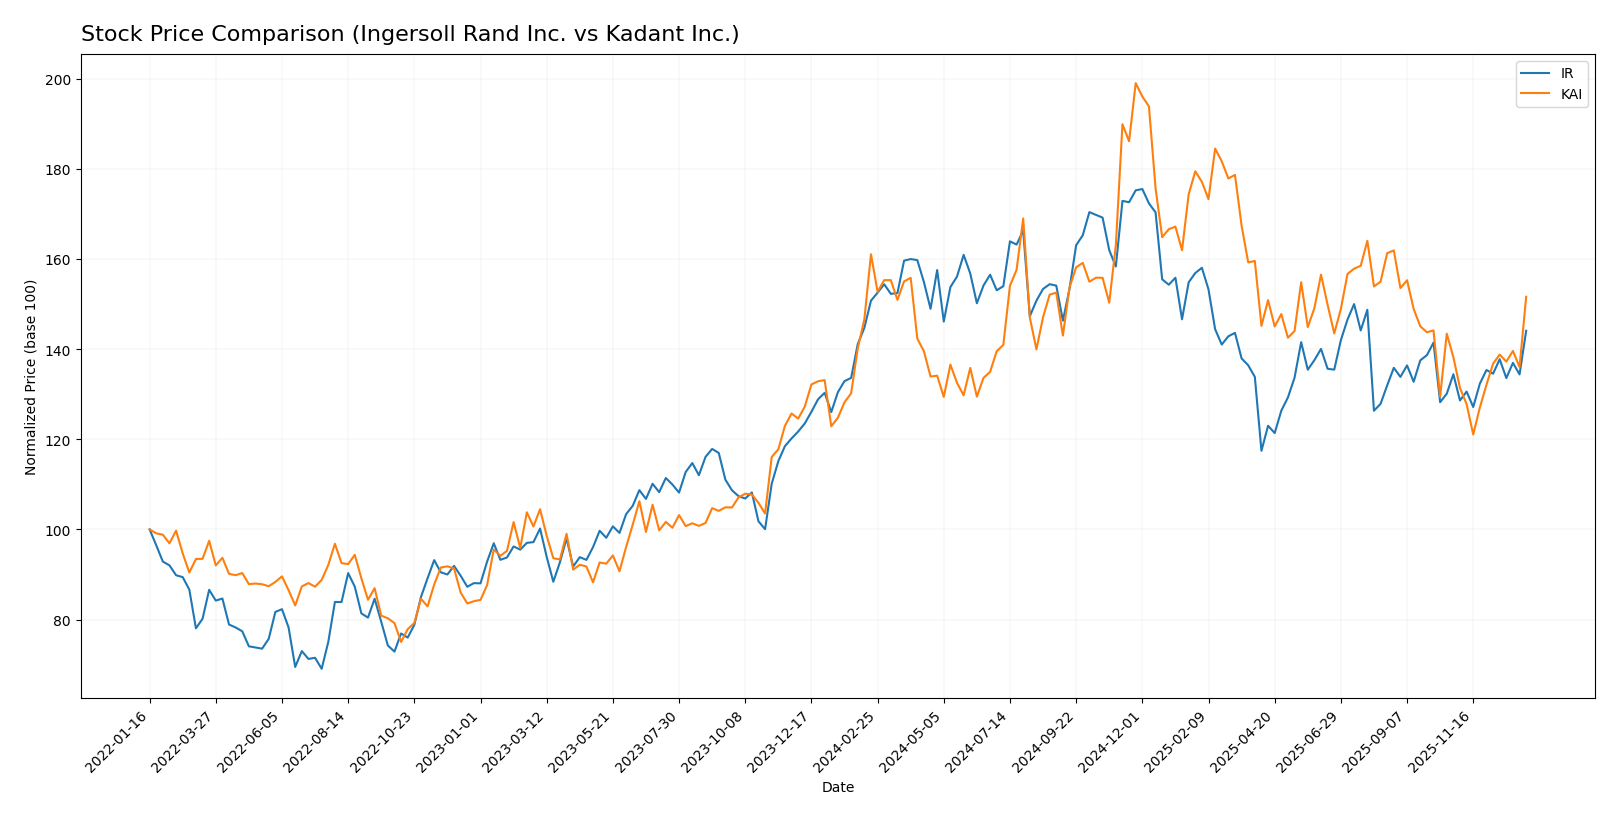
The past year showed a bearish overall trend for both Ingersoll Rand Inc. and Kadant Inc., with recent months indicating a bullish reversal marked by accelerating price gains and distinct trading volume dynamics.
Trend Analysis
Ingersoll Rand Inc. experienced a -4.43% price decline over the past 12 months, indicating a bearish trend with accelerating downward momentum and a price range between 69.7 and 104.17. Recent weeks reversed this with a 7.18% price increase and reduced volatility.
Kadant Inc. showed a -5.86% price drop over the past 12 months, reflecting a bearish trend with acceleration and high volatility, ranging from 254.91 to 419.01. The recent period displayed a 9.69% price rise but with elevated volatility.
Comparing both stocks, Kadant Inc. delivered a larger recent price increase but a steeper overall decline than Ingersoll Rand Inc., making Kadant the highest performer in the recent upward trend despite its greater volatility.
Target Prices
The current analyst consensus indicates promising upside potential for both Ingersoll Rand Inc. and Kadant Inc.
| Company | Target High | Target Low | Consensus |
|---|---|---|---|
| Ingersoll Rand Inc. | 100 | 81 | 91.5 |
| Kadant Inc. | 410 | 275 | 342.5 |
Analysts expect Ingersoll Rand’s price to rise moderately above its current $85.51, while Kadant shows a stronger upside potential compared to its $319.22 market price.
Analyst Opinions Comparison
This section compares analysts’ ratings and financial scores for Ingersoll Rand Inc. and Kadant Inc.:
Rating Comparison
Ingersoll Rand Inc. Rating
- Rating: C+ indicating a very favorable overall evaluation.
- Discounted Cash Flow Score: Moderate score of 3 for valuation.
- ROE Score: Moderate score of 2 showing average equity returns.
- ROA Score: Moderate score of 3 showing average asset efficiency.
- Debt To Equity Score: Moderate score of 2 indicating moderate leverage.
- Overall Score: Moderate score of 2 summarizing financial health.
Kadant Inc. Rating
- Rating: B reflecting a very favorable overall evaluation.
- Discounted Cash Flow Score: Moderate score of 3 for valuation.
- ROE Score: Moderate score of 3 indicating better equity returns.
- ROA Score: Favorable score of 4 indicating strong asset use.
- Debt To Equity Score: Moderate score of 3 indicating slightly stronger balance sheet.
- Overall Score: Moderate score of 3 summarizing financial health.
Which one is the best rated?
Kadant Inc. holds a higher overall rating (B) and scores better on ROE, ROA, debt-to-equity, and overall financial health compared to Ingersoll Rand Inc., which has a C+ rating and generally lower scores.
Scores Comparison
Here is a comparison of the financial scores for Ingersoll Rand Inc. and Kadant Inc.:
Ingersoll Rand Inc. Scores
- Altman Z-Score: 3.27, in the safe zone indicating low bankruptcy risk.
- Piotroski Score: 5, average financial strength and investment potential.
Kadant Inc. Scores
- Altman Z-Score: 5.59, in the safe zone indicating very low bankruptcy risk.
- Piotroski Score: 7, strong financial health and investment potential.
Which company has the best scores?
Kadant Inc. has higher Altman Z-Score and Piotroski Score values than Ingersoll Rand Inc., indicating stronger financial stability and better investment potential based on these metrics.
Grades Comparison
The following presents a comparison of recent grades for Ingersoll Rand Inc. and Kadant Inc.:
Ingersoll Rand Inc. Grades
This table summarizes recent grades issued by recognized financial institutions for Ingersoll Rand Inc.:
| Grading Company | Action | New Grade | Date |
|---|---|---|---|
| Wells Fargo | Maintain | Overweight | 2026-01-07 |
| Stifel | Maintain | Hold | 2025-12-16 |
| Citigroup | Maintain | Buy | 2025-12-08 |
| Citigroup | Maintain | Buy | 2025-11-03 |
| Baird | Maintain | Outperform | 2025-11-03 |
| Stifel | Maintain | Hold | 2025-10-20 |
| Wells Fargo | Maintain | Overweight | 2025-10-06 |
| Morgan Stanley | Maintain | Equal Weight | 2025-08-13 |
| Barclays | Maintain | Overweight | 2025-08-04 |
| Stifel | Maintain | Hold | 2025-08-04 |
Ingersoll Rand’s grades show a positive trend with multiple “Overweight,” “Buy,” and “Outperform” ratings indicating favorable analyst sentiment.
Kadant Inc. Grades
This table presents recent grades provided by financial institutions for Kadant Inc.:
| Grading Company | Action | New Grade | Date |
|---|---|---|---|
| Barrington Research | Maintain | Outperform | 2025-10-30 |
| Barrington Research | Maintain | Outperform | 2025-10-29 |
| Barrington Research | Maintain | Outperform | 2025-10-27 |
| Barrington Research | Maintain | Outperform | 2025-10-10 |
| Barrington Research | Maintain | Outperform | 2025-09-23 |
| DA Davidson | Maintain | Neutral | 2025-08-04 |
| Barrington Research | Maintain | Outperform | 2025-07-30 |
| Barrington Research | Maintain | Outperform | 2025-07-29 |
| Barrington Research | Maintain | Outperform | 2025-05-01 |
| DA Davidson | Maintain | Neutral | 2025-05-01 |
Kadant’s grades primarily consist of “Outperform” ratings from Barrington Research, complemented by some “Neutral” ratings from DA Davidson, indicating a generally positive but mixed outlook.
Which company has the best grades?
Ingersoll Rand has a consensus rating of “Buy” with several “Overweight” and “Buy” grades, while Kadant holds a “Hold” consensus with mostly “Outperform” and some “Neutral” ratings. Ingersoll Rand’s broader analyst support may imply stronger confidence, potentially affecting investor perceptions and portfolio decisions.
Strengths and Weaknesses
Below is a comparative overview of key strengths and weaknesses for Ingersoll Rand Inc. (IR) and Kadant Inc. (KAI) based on recent financial and operational data.
| Criterion | Ingersoll Rand Inc. (IR) | Kadant Inc. (KAI) |
|---|---|---|
| Diversification | Broad segments: Industrial Technologies & Services, Precision & Science Technologies; diversified revenue streams over $7.9B in 2024 | Focused on Capital and Parts & Consumables; total revenue approx. $1.05B in 2024; narrower product base |
| Profitability | Net margin 11.59% (favorable); ROE 8.24% (unfavorable); ROIC 6.11% (neutral); ROIC below WACC, value destroying but improving | Net margin 10.59% (favorable); ROE 13.17% (neutral); ROIC 10.08% (favorable); ROIC above WACC, slightly favorable moat |
| Innovation | Moderate innovation with growing ROIC trend but still value destroying; PE 43.51 high, possibly pricing growth expectations | Steady innovation reflected in growing ROIC and slightly favorable moat; PE 36.9 also high but lower than IR |
| Global presence | Large global industrial footprint with multiple business lines | Smaller scale but well-established in niche markets, less global diversification |
| Market Share | Significant in industrial technologies and aftermarket sectors | Strong in papermaking and fiber-based product niches; smaller overall market share |
Ingersoll Rand shows strong diversification and a solid revenue base but struggles with value creation despite improving profitability. Kadant, while smaller and less diversified, demonstrates better capital efficiency and a slightly favorable competitive position. Investors should weigh IR’s size and growth potential against KAI’s higher efficiency and moat strength.
Risk Analysis
Below is a summary table highlighting key risk factors for Ingersoll Rand Inc. (IR) and Kadant Inc. (KAI) as of 2024–2026.
| Metric | Ingersoll Rand Inc. (IR) | Kadant Inc. (KAI) |
|---|---|---|
| Market Risk | Beta 1.33, moderate volatility risk | Beta 1.25, slightly lower volatility |
| Debt Level | Debt-to-Equity 0.49, favorable | Debt-to-Equity 0.38, favorable |
| Regulatory Risk | Exposure to industrial and environmental regulations globally | Exposure to industrial regulations, moderate compliance risk |
| Operational Risk | Complex product lines, global supply chain | Focused segments, but dependent on industrial demand cycles |
| Environmental Risk | Moderate, given industrial machinery footprint | Moderate, with biodegradable product lines reducing impact |
| Geopolitical Risk | Global presence in US, Europe, Asia, Middle East | Primarily North America, lower geopolitical exposure |
Ingersoll Rand shows slightly higher market risk due to a higher beta and more diverse global operations, increasing geopolitical and regulatory complexities. Kadant benefits from a stronger Piotroski score and lower debt, reducing financial distress risk. The most impactful risks are market volatility for IR and operational cyclicality for KAI. Both companies are financially stable with no immediate bankruptcy concerns but should be monitored for regulatory and geopolitical developments.
Which Stock to Choose?
Ingersoll Rand Inc. (IR) shows favorable income evolution with strong growth in net income and EPS over 2020-2024, supported by solid gross and EBIT margins. Its financial ratios are slightly favorable overall, with strengths in liquidity and debt management, but some weaknesses in profitability ratios and valuation metrics. The company carries moderate debt with a net debt to EBITDA of 1.88 and holds a very favorable C+ rating.
Kadant Inc. (KAI) exhibits favorable income trends with consistent revenue and net income growth, although recent net margin and EPS have declined. Its financial ratios are mostly favorable, particularly in return on capital and asset utilization, with lower debt levels (net debt to EBITDA 1.02) than IR. KAI enjoys a very favorable B rating, supported by strong Altman Z-Score and Piotroski scores.
Which stock may appear more favorable depends on the investor’s profile: those focused on quality and moderate growth might find IR’s improving profitability and stable financial condition appealing despite valuation concerns. Conversely, investors seeking stronger returns on capital and more favorable financial ratios could view KAI as more attractive, especially given its higher rating and stronger financial scores. Both companies show growing ROIC trends but are currently shedding value relative to their WACC to varying degrees.
Disclaimer: Investment carries a risk of loss of initial capital. The past performance is not a reliable indicator of future results. Be sure to understand risks before making an investment decision.
Go Further
I encourage you to read the complete analyses of Ingersoll Rand Inc. and Kadant Inc. to enhance your investment decisions: