UiPath Inc. and Informatica Inc. are two prominent players in the software infrastructure sector, each driving innovation through automation and artificial intelligence. UiPath specializes in robotic process automation, streamlining workflows across industries, while Informatica focuses on data management and integration at enterprise scale. Given their overlapping markets and tech-forward strategies, this comparison will help investors identify which company offers the most compelling growth and value potential in 2026. Let’s explore their strengths and opportunities to guide your investment decision.
Table of contents
Companies Overview
I will begin the comparison between UiPath Inc. and Informatica Inc. by providing an overview of these two companies and their main differences.
UiPath Overview
UiPath Inc. provides an end-to-end automation platform specializing in robotic process automation (RPA) solutions, primarily serving clients in the US, Romania, and Japan. Its platform integrates AI with tools for discovering, analyzing, and automating business processes through low-code environments. Founded in 2005 and headquartered in New York City, UiPath targets sectors like banking, healthcare, and government, aiming to streamline workflows and improve operational efficiency.
Informatica Overview
Informatica Inc. develops an AI-powered platform focused on data connectivity, management, and unification across multi-cloud and hybrid systems at an enterprise scale. Its suite includes data integration, API management, quality control, master data management, and governance tools, supporting accurate and compliant data handling. Founded in 1993 and based in Redwood City, California, Informatica serves large enterprises seeking comprehensive data solutions to drive analytics and operational insights.
Key similarities and differences
Both UiPath and Informatica operate in the software infrastructure industry offering AI-driven platforms to enhance enterprise operations. UiPath emphasizes robotic process automation to optimize workflows, while Informatica specializes in data management and integration across complex environments. Each company supports large organizations with professional services and maintenance, yet they differ in core focus: UiPath automates processes, whereas Informatica manages and unifies data assets.
Income Statement Comparison
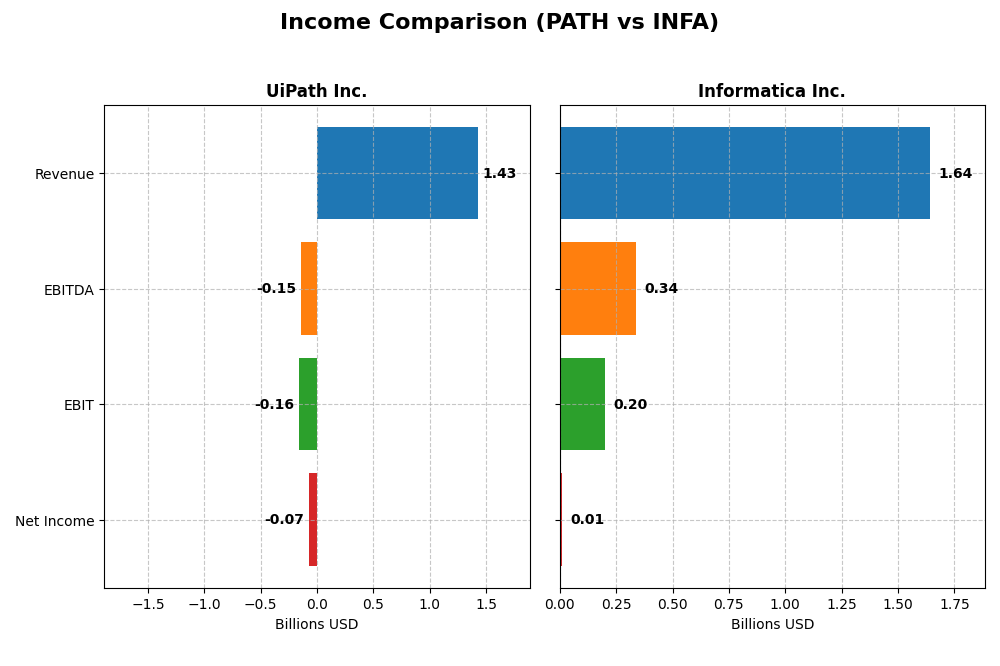
The table below compares key income statement metrics for UiPath Inc. and Informatica Inc. for their most recent fiscal years, providing a snapshot of their financial performance.
| Metric | UiPath Inc. (PATH) | Informatica Inc. (INFA) |
|---|---|---|
| Market Cap | 7.7B | 7.5B |
| Revenue | 1.43B | 1.64B |
| EBITDA | -145M | 339M |
| EBIT | -163M | 199M |
| Net Income | -74M | 10M |
| EPS | -0.13 | 0.033 |
| Fiscal Year | 2025 | 2024 |
Income Statement Interpretations
UiPath Inc.
UiPath’s revenue showed a strong upward trend from 607M in 2021 to 1.43B in 2025, with net income losses narrowing from -92M to -74M over the same period. Gross margins remained robust around 83%, while EBIT margins persisted negative near -11%. The latest year saw 9.3% revenue growth and improved net margin by 25%, indicating a positive momentum despite ongoing losses.
Informatica Inc.
Informatica’s revenue increased steadily from 1.32B in 2020 to 1.64B in 2024, while net income swung from a loss of -168M in 2020 to a modest profit of 10M in 2024. Gross margin was stable at about 80%, and EBIT margin improved significantly to 12%. Recent performance reflects a slower 2.8% revenue growth but notable EBIT and net margin expansions over 100%.
Which one has the stronger fundamentals?
UiPath displays a higher revenue growth rate and strong gross margins but continues to operate at a loss with negative EBIT and net margins. Informatica, while growing more moderately, has achieved positive EBIT and net income, signaling improving profitability. Both companies have favorable income statement evaluations, with UiPath slightly ahead in growth, but Informatica showing stronger profitability fundamentals.
Financial Ratios Comparison
The table below presents a side-by-side comparison of key financial ratios for UiPath Inc. and Informatica Inc. based on their most recent full fiscal year data.
| Ratios | UiPath Inc. (PATH) 2025 | Informatica Inc. (INFA) 2024 |
|---|---|---|
| ROE | -3.99% | 0.43% |
| ROIC | -7.41% | 0.56% |
| P/E | -108.0 | 788.0 |
| P/B | 4.31 | 3.39 |
| Current Ratio | 2.93 | 1.82 |
| Quick Ratio | 2.93 | 1.82 |
| D/E (Debt-to-Equity) | 0.042 | 0.81 |
| Debt-to-Assets | 2.72% | 35.2% |
| Interest Coverage | 0 | 0.87 |
| Asset Turnover | 0.50 | 0.31 |
| Fixed Asset Turnover | 14.41 | 8.75 |
| Payout Ratio | 0 | 0.12% |
| Dividend Yield | 0 | 0.00015% |
Interpretation of the Ratios
UiPath Inc.
UiPath shows a mixed ratio profile with strengths in liquidity (current and quick ratios at 2.93) and low leverage (debt-to-equity at 0.04), but weaknesses in profitability metrics such as net margin (-5.15%), ROE (-3.99%), and ROIC (-7.41%). Asset turnover is low (0.5), although fixed asset turnover is high (14.41). The company does not pay dividends, reflecting its likely reinvestment strategy amid current unprofitable operations.
Informatica Inc.
There is no available ratio data for Informatica, preventing a detailed financial ratio analysis. Dividend data is also absent, suggesting either no dividend payments or insufficient information. Investors should be aware that the lack of disclosed ratios limits direct comparison and requires caution when assessing this company’s financial health.
Which one has the best ratios?
Based on available data, UiPath’s ratios reveal more strengths in liquidity and leverage despite profitability challenges. Informatica’s missing ratio data precludes a full comparison. Therefore, UiPath provides a clearer, though slightly unfavorable, financial profile, while Informatica’s position remains uncertain due to absent information.
Strategic Positioning
This section compares the strategic positioning of UiPath and Informatica, focusing on Market position, Key segments, and Exposure to technological disruption:
UiPath
- Market position in software infrastructure with competitive pressure from automation and AI adoption.
- Key segments include RPA automation licenses, subscription services, and professional services.
- Exposure to technological disruption through AI-enhanced robotic process automation platform.
Informatica
- Market position in software infrastructure emphasizing enterprise data management at scale.
- Key segments are AI-powered data management subscriptions and professional services.
- Exposure to disruption via AI-powered multi-cloud and hybrid data integration platform.
UiPath vs Informatica Positioning
UiPath focuses on robotic process automation with a mix of license and subscription revenues, targeting automation across industries. Informatica concentrates on data integration and governance with a strong subscription base, serving enterprise-scale data needs.
Which has the best competitive advantage?
UiPath shows a slightly unfavorable moat, currently shedding value though with improving profitability. Informatica’s moat evaluation is unavailable, preventing a direct comparison of competitive advantages based on MOAT data.
Stock Comparison
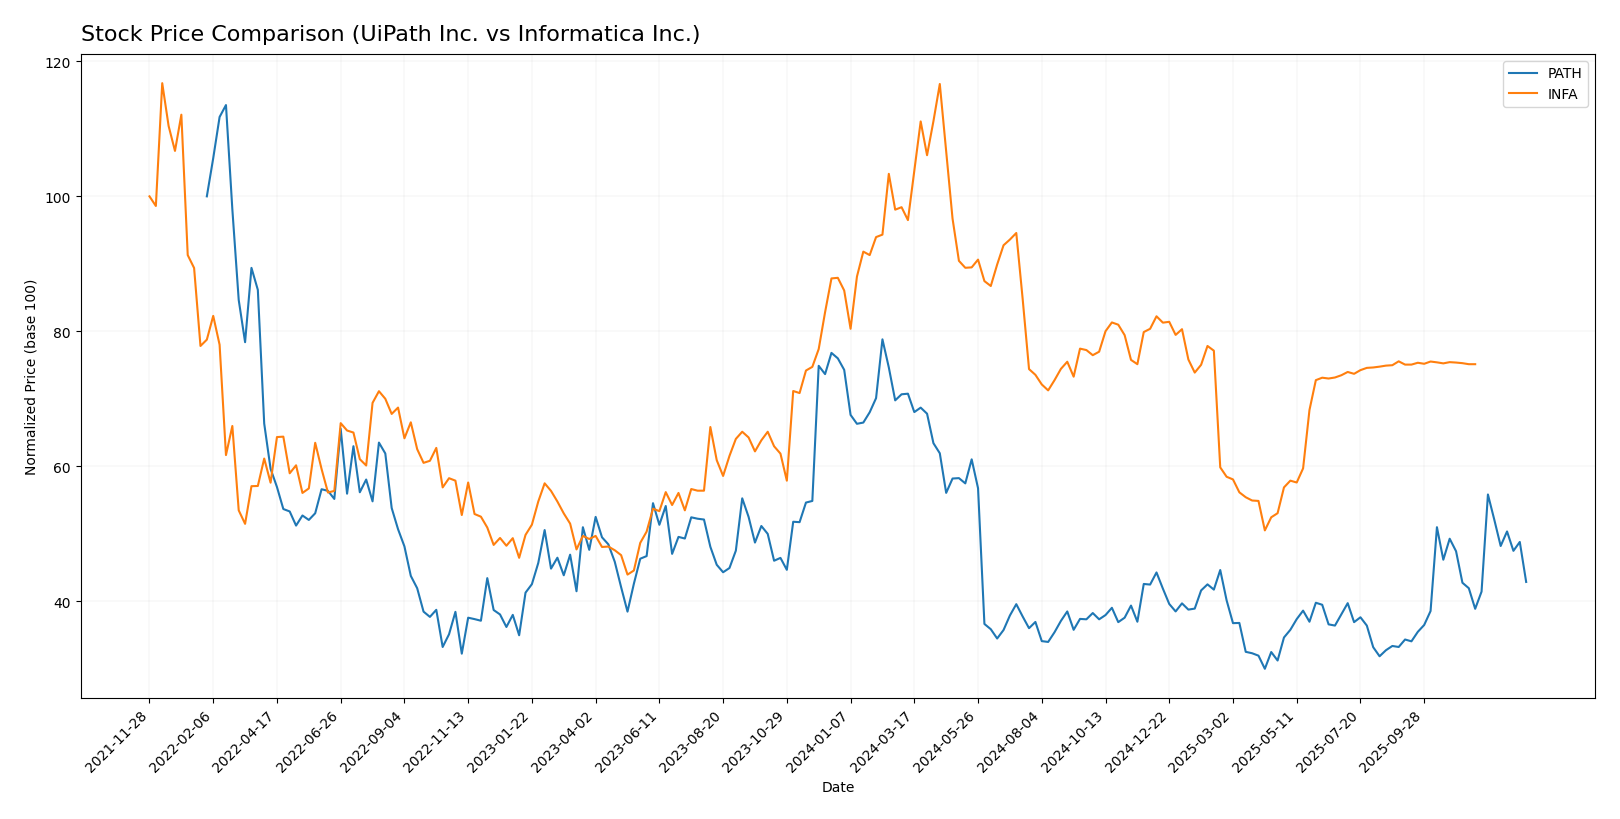
The stock price movements of UiPath Inc. and Informatica Inc. over the past 12 months reveal contrasting bearish trends with differing acceleration patterns and volume dynamics.
Trend Analysis
UiPath Inc. (PATH) experienced a significant bearish trend with a 38.53% price decline over the past year, showing accelerating downward momentum and a high volatility level (std deviation 3.33). The stock ranged between 23.66 and 10.04, with recent trends also bearish but less volatile.
Informatica Inc. (INFA) saw a milder bearish trend, losing 12.68% over the same period, also with accelerating decline and higher volatility (std deviation 4.46). Recent price movement was essentially neutral with a negligible 0.08% change and minimal volatility.
Comparing both, UiPath’s stock showed the steepest market decline, while Informatica’s performance was less negative. Neither stock exhibited bullish trends during the period analyzed.
Target Prices
The current analyst consensus presents a moderate upside potential for both UiPath Inc. and Informatica Inc.
| Company | Target High | Target Low | Consensus |
|---|---|---|---|
| UiPath Inc. | 19 | 14 | 16.6 |
| Informatica Inc. | 27 | 27 | 27 |
Analysts expect UiPath’s stock to appreciate modestly from its current price of 14.34 USD, while Informatica’s consensus target of 27 USD suggests a potential gain from its current 24.79 USD. Overall, both stocks show room for upward movement based on these targets.
Analyst Opinions Comparison
This section compares analysts’ ratings and grades for UiPath Inc. and Informatica Inc.:
Rating Comparison
UiPath Inc. Rating
- Rating: B+, rated Very Favorable
- Discounted Cash Flow Score: 3, Moderate
- ROE Score: 4, Favorable
- ROA Score: 4, Favorable
- Debt To Equity Score: 4, Favorable
- Overall Score: 3, Moderate
Informatica Inc. Rating
- No rating data available
- No data
- No data
- No data
- No data
- No data
Which one is the best rated?
Based on available data, UiPath Inc. holds a B+ rating with favorable scores in ROE, ROA, and debt-to-equity metrics, while Informatica Inc. lacks any rating or score information for comparison.
Scores Comparison
Here is a comparison of the financial health scores for UiPath Inc. and Informatica Inc.:
UiPath Inc. Scores
- Altman Z-Score: 5.27, indicating a safe zone with low bankruptcy risk.
- Piotroski Score: 7, reflecting strong financial strength.
Informatica Inc. Scores
- Altman Z-Score: 1.94, placing the company in the grey zone with moderate risk.
- Piotroski Score: 6, indicating average financial strength.
Which company has the best scores?
UiPath Inc. shows stronger financial health, with a higher Altman Z-Score in the safe zone and a stronger Piotroski Score compared to Informatica Inc.’s moderate and average scores respectively.
Grades Comparison
The following is a comparison of the recent grades provided by recognized grading companies for UiPath Inc. and Informatica Inc.:
UiPath Inc. Grades
Here are the latest grades from reputable financial institutions for UiPath Inc.:
| Grading Company | Action | New Grade | Date |
|---|---|---|---|
| Barclays | Maintain | Equal Weight | 2026-01-12 |
| RBC Capital | Maintain | Sector Perform | 2026-01-05 |
| RBC Capital | Maintain | Sector Perform | 2025-12-10 |
| Morgan Stanley | Maintain | Equal Weight | 2025-12-09 |
| DA Davidson | Maintain | Neutral | 2025-12-05 |
| Canaccord Genuity | Maintain | Buy | 2025-12-04 |
| Mizuho | Maintain | Neutral | 2025-12-04 |
| RBC Capital | Maintain | Sector Perform | 2025-12-04 |
| Wells Fargo | Maintain | Equal Weight | 2025-12-04 |
| Evercore ISI Group | Maintain | In Line | 2025-12-04 |
The overall trend for UiPath Inc. shows a predominance of neutral to sector perform ratings, with one buy rating, indicating steady but cautious market sentiment.
Informatica Inc. Grades
Below are the recent grades issued by reputable grading institutions for Informatica Inc.:
| Grading Company | Action | New Grade | Date |
|---|---|---|---|
| Guggenheim | Downgrade | Neutral | 2025-08-07 |
| UBS | Maintain | Neutral | 2025-08-07 |
| Baird | Maintain | Neutral | 2025-05-28 |
| JP Morgan | Downgrade | Neutral | 2025-05-28 |
| RBC Capital | Maintain | Sector Perform | 2025-05-28 |
| Wolfe Research | Downgrade | Peer Perform | 2025-05-28 |
| Wells Fargo | Maintain | Equal Weight | 2025-05-28 |
| Truist Securities | Downgrade | Hold | 2025-05-28 |
| RBC Capital | Maintain | Sector Perform | 2025-05-27 |
| UBS | Maintain | Neutral | 2025-05-16 |
For Informatica Inc., the grades generally trend toward neutral and sector perform ratings, with multiple downgrades suggesting a cautious to slightly negative outlook.
Which company has the best grades?
UiPath Inc. has received a slightly more favorable set of grades, including a buy rating, compared to Informatica Inc.’s more frequent downgrades and neutral ratings. This difference may influence investors toward a more cautiously optimistic view for UiPath, while Informatica’s trend suggests a more conservative stance.
Strengths and Weaknesses
Below is a comparative analysis of UiPath Inc. (PATH) and Informatica Inc. (INFA) based on their latest available data, highlighting key strengths and weaknesses.
| Criterion | UiPath Inc. (PATH) | Informatica Inc. (INFA) |
|---|---|---|
| Diversification | Moderate: Focused on automation with license, subscription, and professional services revenue streams. | High: Broad portfolio including subscription, professional services, license, and maintenance. |
| Profitability | Weak: Negative net margin (-5.15%) and ROIC (-7.41%) indicate current value destruction. | Data unavailable, but large diversified revenue suggests potential stability. |
| Innovation | Strong growth in ROIC trend (+65%), showing improving operational efficiency and innovation focus. | Data unavailable, but market position implies ongoing innovation in data management. |
| Global presence | Strong: Global customer base supported by SaaS subscription growth ($801M in 2025). | Strong: Established presence with diverse revenue sources internationally. |
| Market Share | Growing in automation but still challenged by competition; market share expanding gradually. | Significant in data integration and cloud services, likely holding substantial market share. |
Key takeaways: UiPath shows promising innovation and global reach but struggles with profitability and value creation. Informatica presents a diversified and stable business model, though detailed financials are lacking for full assessment. Investors should weigh UiPath’s growth potential against its current financial weaknesses and consider Informatica’s broader market footing despite limited data.
Risk Analysis
Below is a comparative risk overview for UiPath Inc. (PATH) and Informatica Inc. (INFA) for the year 2025:
| Metric | UiPath Inc. (PATH) | Informatica Inc. (INFA) |
|---|---|---|
| Market Risk | Beta 1.08 indicates moderate market volatility sensitivity | Beta 1.14, slightly higher market sensitivity |
| Debt Level | Very low debt-to-equity ratio (0.04), low leverage risk | Data unavailable; moderate Altman Z-Score suggests some financial risk |
| Regulatory Risk | Moderate, typical for US tech sector and international operations | Typical US tech sector risk, no recent issues reported |
| Operational Risk | Negative net margin and ROE reflect operational challenges | Data unavailable; average Piotroski score suggests moderate operational strength |
| Environmental Risk | Low direct exposure; software industry generally low impact | Low direct exposure; similar industry profile |
| Geopolitical Risk | Exposure in US, Romania, Japan could pose regional risks | Primarily US-focused, lower geopolitical risk |
UiPath shows moderate market risk with very low debt but operational challenges reflected in negative profitability ratios. Informatica’s financial data is less complete, but its Altman Z-Score in the grey zone signals moderate bankruptcy risk. Operational and market risks are the most impactful for UiPath, while Informatica requires cautious monitoring due to incomplete data.
Which Stock to Choose?
UiPath Inc. shows a favorable income evolution with 9.3% revenue growth in 2025, strong gross margin at 82.73%, but unprofitable EBIT and net margins. Financial ratios are slightly unfavorable overall, though liquidity and debt levels are favorable. The company has a growing ROIC but remains a value destroyer, earning a very favorable B+ rating.
Informatica Inc. presents a stable income profile with a favorable gross margin of 80.11% and positive EBIT margin of 12.15%, alongside modest net margin. Limited ratio data restricts full financial assessment, but scores indicate average to strong financial health with Altman Z-score in the grey zone and a Piotroski score of 6.
For investors prioritizing growth and improving profitability metrics, UiPath’s rising income and strong rating might appear attractive despite current unprofitability. Conversely, those favoring stability and positive operating margins may find Informatica’s more consistent profitability and financial health indicators more suitable, recognizing limited ratio transparency.
Disclaimer: Investment carries a risk of loss of initial capital. The past performance is not a reliable indicator of future results. Be sure to understand risks before making an investment decision.
Go Further
I encourage you to read the complete analyses of UiPath Inc. and Informatica Inc. to enhance your investment decisions: