Oracle Corporation and Informatica Inc. are two prominent players in the software infrastructure industry, each driving innovation in cloud computing and data management. Oracle, a long-established giant, offers comprehensive cloud and enterprise solutions, while Informatica focuses on AI-powered data integration and governance. Comparing these companies reveals contrasting strategies and growth potentials. Join me as we explore which company presents the most compelling investment opportunity in 2026.

Table of contents
Companies Overview
I will begin the comparison between Oracle Corporation and Informatica Inc. by providing an overview of these two companies and their main differences.
Oracle Overview
Oracle Corporation focuses on providing enterprise IT solutions worldwide, delivering a broad range of cloud software applications such as ERP, supply chain, and human capital management. It also offers infrastructure technologies including its database, Java platform, and middleware. With a market cap of 549B USD and 159K employees, Oracle is a major player in software infrastructure, serving industries, governments, and educational institutions.
Informatica Overview
Informatica Inc. specializes in AI-powered data management platforms that unify and govern data across multi-cloud and hybrid environments. Its suite includes data integration, API management, data quality, and governance products, aimed at delivering accurate and compliant data for enterprises. With a market cap of 7.5B USD and 5.2K employees, Informatica focuses on enabling data-driven business processes and regulatory compliance.
Key similarities and differences
Both companies operate in the software infrastructure sector, providing solutions that support enterprise data and IT environments. Oracle offers a broader portfolio including cloud applications, infrastructure, and hardware, while Informatica concentrates on data management and AI-driven integration platforms. Oracle’s scale and market presence far exceed Informatica’s, reflecting their different market positioning and product scope.
Income Statement Comparison
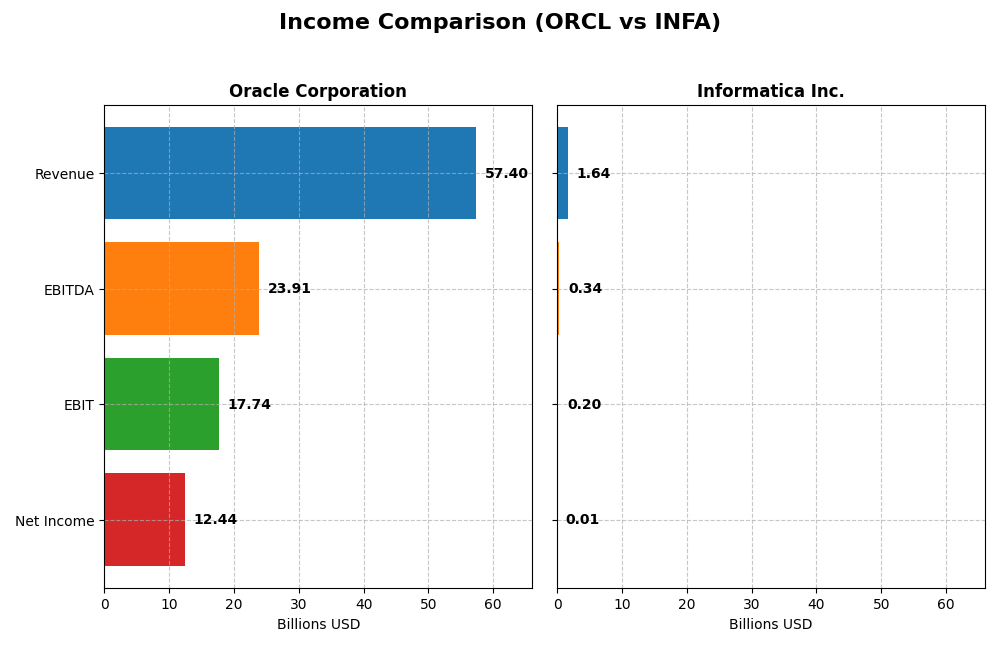
The table below presents a side-by-side comparison of key income statement metrics for Oracle Corporation and Informatica Inc. for their most recent fiscal years.
| Metric | Oracle Corporation | Informatica Inc. |
|---|---|---|
| Market Cap | 549B | 7.5B |
| Revenue | 57.4B | 1.64B |
| EBITDA | 23.9B | 339M |
| EBIT | 17.7B | 199M |
| Net Income | 12.4B | 9.9M |
| EPS | 4.46 | 0.033 |
| Fiscal Year | 2025 | 2024 |
Income Statement Interpretations
Oracle Corporation
Oracle’s revenue grew steadily from 40.5B in 2021 to 57.4B in 2025, marking a favorable 41.8% increase overall. Net income showed volatility, peaking at 13.7B in 2021 but declining to 12.4B in 2025. Gross and EBIT margins remained strong around 70.5% and 30.9%, respectively, with a positive net margin near 21.7%. The latest year showed solid revenue and EBIT growth, with net margin improvements indicating operational efficiency gains.
Informatica Inc.
Informatica’s revenue increased from 1.32B in 2020 to 1.64B in 2024, reflecting a favorable 23.95% growth over the period. Net income turned positive in 2024 at 9.9M, after several years of losses, showing a strong recovery. Gross margin was high at 80.1%, while EBIT margin and net margin were lower at 12.15% and 0.61%, respectively. The most recent year displayed modest revenue growth but significant improvements in EBIT and net margin, signaling enhanced profitability.
Which one has the stronger fundamentals?
Oracle demonstrates stronger fundamentals with substantial scale, robust margins, and consistent revenue growth, despite some net income fluctuations. Informatica shows promising improvement in profitability, recovering from losses with favorable margin expansions, yet operates at a much smaller scale and lower net margin. Oracle’s mature, stable income contrasts with Informatica’s emerging profitability and growth trajectory.
Financial Ratios Comparison
Below is a comparative overview of key financial ratios for Oracle Corporation and Informatica Inc. for their most recent fiscal years.
| Ratios | Oracle Corporation (2025) | Informatica Inc. (2024) |
|---|---|---|
| ROE | 60.8% | 0.43% |
| ROIC | 10.9% | 0.56% |
| P/E | 37.1 | 788.0 |
| P/B | 22.6 | 3.39 |
| Current Ratio | 0.75 | 1.82 |
| Quick Ratio | 0.75 | 1.82 |
| D/E (Debt-to-Equity) | 5.09 | 0.81 |
| Debt-to-Assets | 61.8% | 35.2% |
| Interest Coverage | 4.94 | 0.87 |
| Asset Turnover | 0.34 | 0.31 |
| Fixed Asset Turnover | 1.32 | 8.75 |
| Payout Ratio | 38.1% | 0.12% |
| Dividend Yield | 1.03% | 0.00015% |
Interpretation of the Ratios
Oracle Corporation
Oracle shows strong profitability ratios with a favorable net margin of 21.68% and a high return on equity of 60.84%, reflecting efficient capital use. However, liquidity ratios are weak, with a current ratio of 0.75 indicating potential short-term liquidity concerns. The dividend yield stands at 1.03%, supported by consistent payouts but with caution due to unfavorable leverage and valuation ratios.
Informatica Inc.
Informatica lacks available data on key financial ratios, key metrics, and income statements, making ratio analysis impossible. The company does not pay dividends, likely reflecting reinvestment priorities or a growth phase. Without ratio data, assessing profitability, liquidity, or shareholder returns remains inconclusive for investors.
Which one has the best ratios?
Based on available data, Oracle’s ratios provide a clearer, though mixed, financial profile with strong profitability but weaker liquidity and leverage. Informatica’s lack of data prevents ratio comparison. Therefore, Oracle currently presents the only measurable financial metrics, though some ratios indicate caution for risk management.
Strategic Positioning
This section compares the strategic positioning of Oracle Corporation and Informatica Inc. in terms of market position, key segments, and exposure to technological disruption:
Oracle Corporation
- Large market cap of $549B; faces competitive pressure in broad enterprise software market.
- Key segments include cloud and license business ($49B), hardware ($2.9B), and services ($5.2B).
- Exposure includes cloud computing, autonomous databases, IoT, blockchain, and middleware.
Informatica Inc.
- Smaller market cap of $7.5B; competes in specialized AI-powered data management platform space.
- Focused on subscription and professional services, with cloud-based data management products.
- Exposure centers on AI-powered data integration, API management, data quality, and governance.
Oracle Corporation vs Informatica Inc. Positioning
Oracle pursues a diversified approach with multiple business lines including cloud, hardware, and services, offering broad enterprise IT solutions. Informatica concentrates on AI-driven data management software and cloud subscriptions, focusing on data integration and governance. Oracle’s scale offers breadth, while Informatica’s specialization targets niche enterprise data needs.
Which has the best competitive advantage?
Based on MOAT evaluation, Oracle shows a slightly unfavorable moat with declining profitability and value shedding, while Informatica lacks sufficient data for MOAT assessment, making Oracle’s competitive advantage uncertain.
Stock Comparison
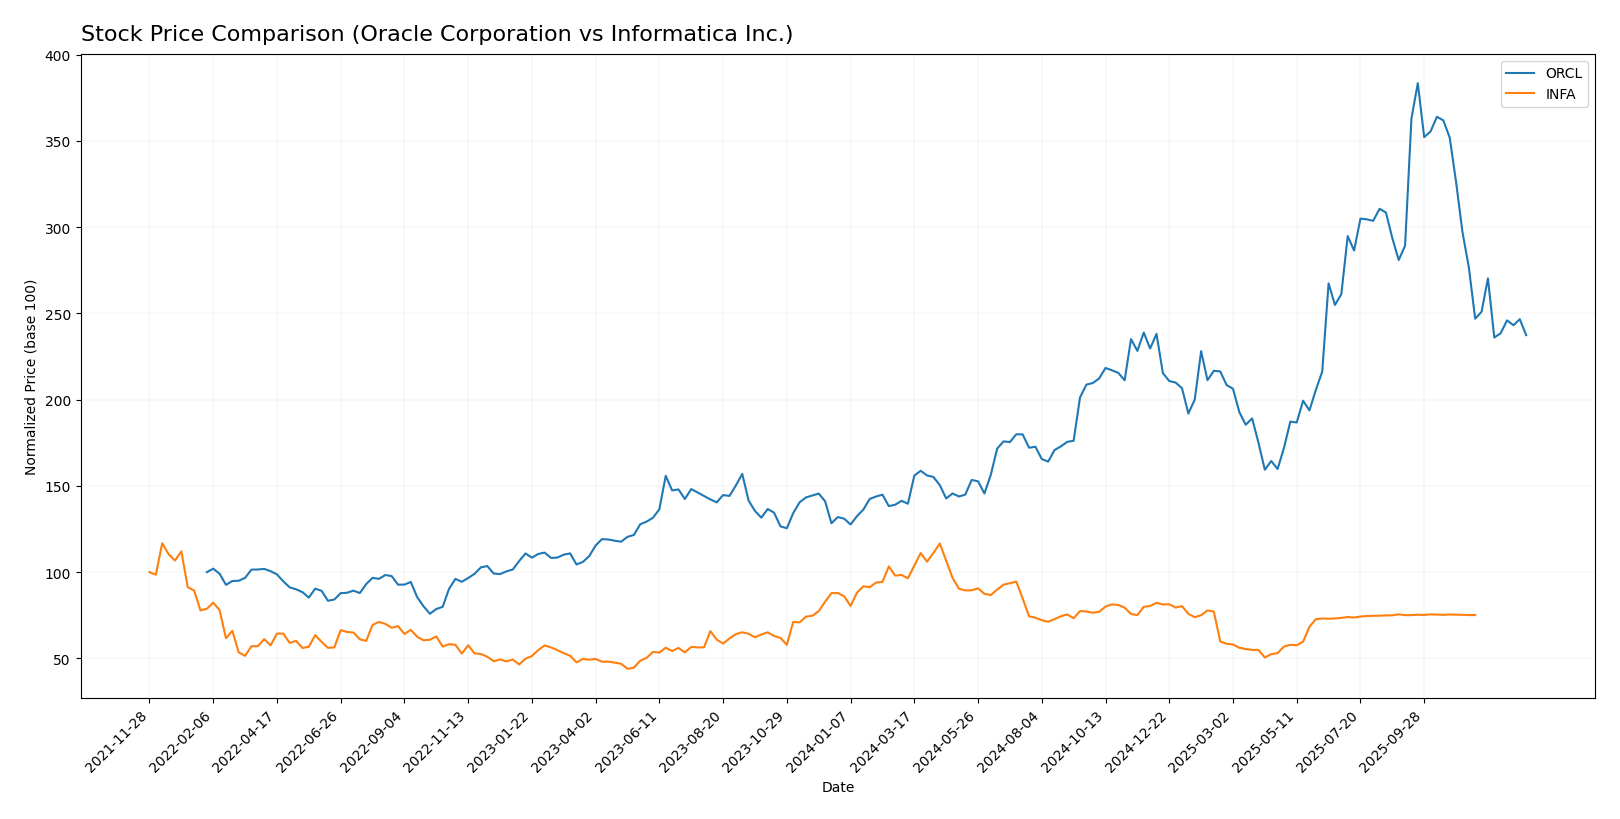
The stock price dynamics of Oracle Corporation and Informatica Inc. over the past 12 months reveal contrasting trajectories, with Oracle showing a strong overall rise despite recent weakness, while Informatica experienced a notable decline followed by stabilization.
Trend Analysis
Oracle Corporation’s stock exhibited a bullish trend over the past year, with a 70.69% price increase, though recent months showed a deceleration and a 27.23% drop, indicating short-term weakness amid high volatility (std dev 49.0). The stock reached a high of 308.66 and a low of 111.95.
Informatica Inc. displayed a bearish trend over the same period with a 12.68% decline and accelerating downward momentum. Recent data indicate near neutral movement (0.08% change) with minimal volatility (std dev 0.05), suggesting a pause in the downtrend. The highest and lowest prices were 38.48 and 16.67, respectively.
Comparing both, Oracle delivered the highest market performance with a substantial positive return, while Informatica’s stock trended downward overall, reflecting divergent investor sentiment and trading outcomes.
Target Prices
The target price consensus for Oracle Corporation and Informatica Inc. reflects analysts’ expectations of potential price movements.
| Company | Target High | Target Low | Consensus |
|---|---|---|---|
| Oracle Corporation | 400 | 175 | 314.08 |
| Informatica Inc. | 27 | 27 | 27 |
Oracle’s consensus target price of 314.08 indicates a significant upside potential compared to its current price of 191.09, suggesting robust analyst confidence. Informatica’s target price of 27 is close to its last price of 24.79, reflecting a more conservative outlook.
Analyst Opinions Comparison
This section compares analysts’ ratings and grades for Oracle Corporation and Informatica Inc.:
Rating Comparison
Oracle Corporation Rating
- Rating: B, categorized as Very Favorable
- Discounted Cash Flow Score: 3, indicating Moderate status
- ROE Score: 5, considered Very Favorable
- ROA Score: 4, classified as Favorable
- Debt To Equity Score: 1, marked Very Unfavorable
- Overall Score: 3, Moderate rating
Informatica Inc. Rating
- No rating data available
- No score data available
- No score data available
- No score data available
- No score data available
- No score data available
Which one is the best rated?
Oracle Corporation is better rated with a “B” rating and several financial scores, including very favorable ROE and favorable ROA. Informatica Inc. lacks any provided rating or score data for comparison.
Scores Comparison
Here is a comparison of Oracle and Informatica scores based on Altman Z-Score and Piotroski Score:
Oracle Scores
- Altman Z-Score: 2.43, indicating moderate bankruptcy risk in the grey zone.
- Piotroski Score: 5, showing average financial strength.
Informatica Scores
- Altman Z-Score: 1.94, also in the grey zone with moderate bankruptcy risk.
- Piotroski Score: 6, indicating slightly stronger average financial strength.
Which company has the best scores?
Informatica’s Altman Z-Score and Piotroski Score are both marginally better than Oracle’s, indicating a slightly stronger financial health profile based on these metrics. Both remain in the grey zone with average Piotroski scores.
Grades Comparison
Here is a comparison of the latest reliable grades for Oracle Corporation and Informatica Inc.:
Oracle Corporation Grades
The table below shows recent grades assigned by reputable financial institutions to Oracle Corporation:
| Grading Company | Action | New Grade | Date |
|---|---|---|---|
| UBS | Maintain | Buy | 2026-01-05 |
| RBC Capital | Maintain | Sector Perform | 2026-01-05 |
| Jefferies | Maintain | Buy | 2026-01-05 |
| Goldman Sachs | Maintain | Neutral | 2025-12-12 |
| Keybanc | Maintain | Overweight | 2025-12-11 |
| UBS | Maintain | Buy | 2025-12-11 |
| Citigroup | Maintain | Buy | 2025-12-11 |
| JP Morgan | Maintain | Neutral | 2025-12-11 |
| DA Davidson | Maintain | Neutral | 2025-12-11 |
| Scotiabank | Maintain | Sector Outperform | 2025-12-11 |
Oracle’s grades consistently indicate a positive outlook, with a majority of buy and sector outperform ratings maintained across multiple firms.
Informatica Inc. Grades
The table below summarizes recent grades from established grading companies for Informatica Inc.:
| Grading Company | Action | New Grade | Date |
|---|---|---|---|
| Guggenheim | Downgrade | Neutral | 2025-08-07 |
| UBS | Maintain | Neutral | 2025-08-07 |
| Baird | Maintain | Neutral | 2025-05-28 |
| JP Morgan | Downgrade | Neutral | 2025-05-28 |
| RBC Capital | Maintain | Sector Perform | 2025-05-28 |
| Wolfe Research | Downgrade | Peer Perform | 2025-05-28 |
| Wells Fargo | Maintain | Equal Weight | 2025-05-28 |
| Truist Securities | Downgrade | Hold | 2025-05-28 |
| RBC Capital | Maintain | Sector Perform | 2025-05-27 |
| UBS | Maintain | Neutral | 2025-05-16 |
Informatica’s grades show a clear trend of downgrades and neutral or hold ratings, indicating a less optimistic investor sentiment.
Which company has the best grades?
Oracle Corporation has received stronger and more consistent buy and outperform ratings compared to Informatica Inc., which faces multiple downgrades and neutral stances. This contrast may influence investors’ confidence and portfolio decisions regarding risk and growth potential.
Strengths and Weaknesses
The table below summarizes the key strengths and weaknesses of Oracle Corporation and Informatica Inc. based on the most recent available data.
| Criterion | Oracle Corporation (ORCL) | Informatica Inc. (INFA) |
|---|---|---|
| Diversification | Strong diversification with Cloud & License ($49.2B), Services ($5.2B), and Hardware ($2.9B) segments | Moderate diversification: primarily Subscription and Professional Services (~$1.1B total) |
| Profitability | High net margin (21.7%), strong ROE (60.8%), ROIC (10.9%) but declining ROIC trend and overall value shedding | Data unavailable for profitability ratios |
| Innovation | Significant investment in cloud technology and license solutions; market leader in enterprise software innovation | Innovation status unclear due to missing data |
| Global presence | Well-established global footprint with broad enterprise customer base | Global presence smaller and more niche-focused |
| Market Share | Large market share in enterprise software and cloud services sectors | Smaller market share; focused on data integration and management |
Key takeaways: Oracle demonstrates strong profitability and diversification with a broad global presence, although its declining ROIC signals caution. Informatica’s data gaps limit full assessment, but it operates in a specialized niche with moderate diversification. Investors should weigh Oracle’s scale against its profitability trend and seek more data on Informatica before investing.
Risk Analysis
Below is a comparative overview of the key risks for Oracle Corporation (ORCL) and Informatica Inc. (INFA) based on the most recent data from 2025-2026.
| Metric | Oracle Corporation (ORCL) | Informatica Inc. (INFA) |
|---|---|---|
| Market Risk | High beta (1.65) indicates higher sensitivity to market swings. | Moderate beta (1.14), lower volatility than Oracle. |
| Debt level | High debt-to-equity ratio (5.09) and 61.83% debt to assets pose financial leverage risk. | Data unavailable; risk assessment limited. |
| Regulatory Risk | Moderate; operates globally with complex compliance requirements, but no recent major issues. | Moderate; data privacy and cloud regulations may impact operations. |
| Operational Risk | Large scale operations with 159K employees increase complexity and operational risks. | Smaller scale with 5.2K employees; operational risks lower but still present. |
| Environmental Risk | Moderate; technology sector faces pressure on energy use and sustainability. | Moderate; similar sector pressures but smaller footprint. |
| Geopolitical Risk | Exposure to US-China tensions affecting tech supply chains and cloud markets. | Similar exposure but less global scale reduces impact. |
Oracle’s high financial leverage and market volatility represent the most significant risks, compounded by a moderate Altman Z-Score in the grey zone, indicating some financial uncertainty. Informatica’s risk profile is less clear due to missing financial data but appears moderate with average scores and lower market volatility. Investors should weigh Oracle’s strong profitability against its leverage risks and monitor geopolitical developments impacting tech infrastructure.
Which Stock to Choose?
Oracle Corporation (ORCL) shows a generally favorable income evolution with revenue growth of 8.38% in 2025 and strong profitability, reflected in a 21.68% net margin and a 60.84% ROE. However, many financial ratios are unfavorable, including a high debt-to-equity ratio (5.09) and low liquidity, leading to a slightly unfavorable moat rating and a very favorable overall rating B.
Informatica Inc. (INFA) displays favorable income statement growth over 2020–2024, with net income and EPS growing by over 100%, and a high gross margin of 80.11%. Yet, profitability ratios like ROE and ROA remain very low or negative, and financial ratios data are missing. The Altman Z-Score is in the grey zone, and Piotroski score is average, indicating moderate financial health.
Investors seeking growth might find Informatica’s rapid income growth appealing despite low profitability and limited financial data. Conversely, those prioritizing established profitability and higher credit ratings could view Oracle’s strong margins and favorable income evaluation as more attractive, although its financial ratios suggest caution.
Disclaimer: Investment carries a risk of loss of initial capital. The past performance is not a reliable indicator of future results. Be sure to understand risks before making an investment decision.
Go Further
I encourage you to read the complete analyses of Oracle Corporation and Informatica Inc. to enhance your investment decisions: