In the dynamic world of technology, Informatica Inc. and Oddity Tech Ltd. stand out with distinct approaches yet within overlapping sectors. Informatica excels in AI-powered data management platforms for enterprises, while Oddity Tech innovates in consumer-focused beauty and wellness tech. Both companies leverage cutting-edge technologies to transform their markets. This article will help you determine which company presents the most compelling investment opportunity in 2026.
Table of contents
Companies Overview
I will begin the comparison between Informatica Inc. and Oddity Tech Ltd. by providing an overview of these two companies and their main differences.
Informatica Inc. Overview
Informatica Inc. develops an AI-powered platform that connects, manages, and unifies data across multi-cloud and hybrid systems at enterprise scale in the US. Its suite includes data integration, API management, data quality, master data management, and governance products designed to provide accurate, consistent, and compliant business data. Founded in 1993, it operates in the software infrastructure industry with a market cap of 7.5B USD.
Oddity Tech Ltd. Overview
Oddity Tech Ltd. is a consumer-tech company based in Israel, focusing on beauty and wellness products through its PowerMatch technology. It builds digital-first brands to disrupt traditional offline markets, offering products under IL MAKIAGE and SpoiledChild brands. Incorporated in 2013, the company trades on NASDAQ with a market cap of 2B USD and operates in the software infrastructure sector with 489 employees.
Key similarities and differences
Both companies operate in the software infrastructure industry, leveraging technology to provide innovative solutions. Informatica focuses on enterprise data management with AI-driven platforms, while Oddity Tech targets consumer markets with beauty and wellness tech products. Informatica’s scale is significantly larger with over 5,200 employees and a 7.5B market cap, contrasting with Oddity’s smaller size and more volatile stock indicated by a higher beta of 3.18.
Income Statement Comparison
The table below compares the latest fiscal year income statement metrics for Informatica Inc. and Oddity Tech Ltd., highlighting key financial figures relevant to investors.
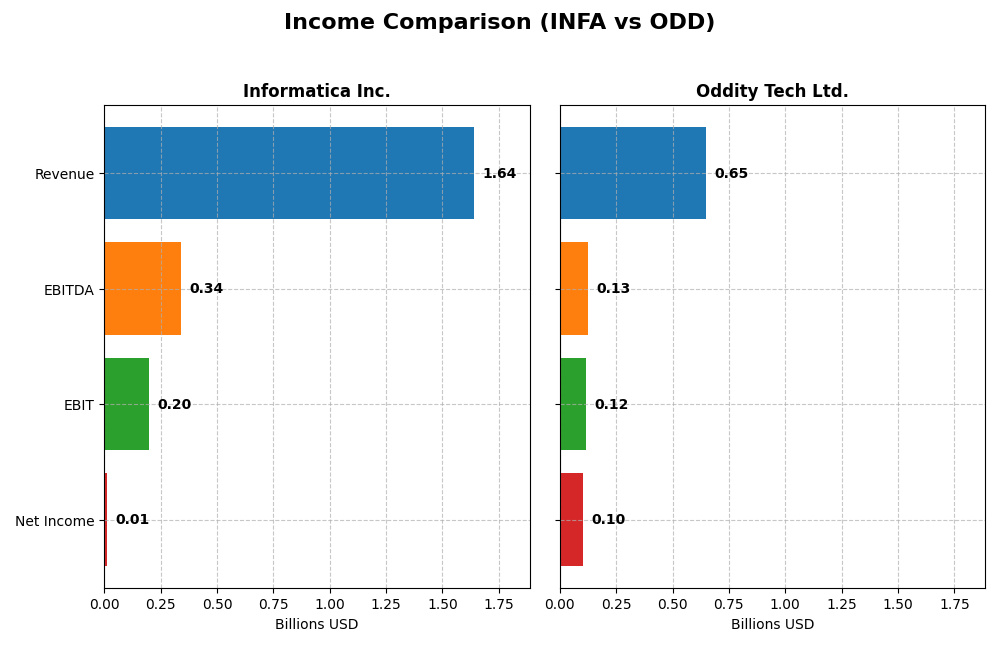
| Metric | Informatica Inc. (INFA) | Oddity Tech Ltd. (ODD) |
|---|---|---|
| Market Cap | 7.5B | 2.0B |
| Revenue | 1.64B | 647M |
| EBITDA | 339M | 125M |
| EBIT | 199M | 116M |
| Net Income | 9.9M | 101M |
| EPS | 0.03 | 1.78 |
| Fiscal Year | 2024 | 2024 |
Income Statement Interpretations
Informatica Inc.
Informatica Inc. showed steady revenue growth from $1.32B in 2020 to $1.64B in 2024, a 23.95% increase over five years. Net income turned positive in 2024 at $9.9M after years of losses, reflecting improved profitability. Gross margin remained strong at 80.11%, with a notable EBIT margin improvement to 12.15% in 2024, indicating better operational control despite slower recent revenue growth.
Oddity Tech Ltd.
Oddity Tech Ltd. experienced rapid revenue expansion from $111M in 2020 to $647M in 2024, an overall growth of 485%. Net income surged to $101M in 2024, up significantly from $12M in 2020. Margins are favorable, with a gross margin of 72.38% and a robust net margin of 15.69% in 2024. The company demonstrated strong earnings momentum, with notable EBIT margin expansion and consistent operational leverage.
Which one has the stronger fundamentals?
Oddity Tech Ltd. presents stronger fundamentals based on its rapid revenue and net income growth, alongside consistently favorable margin improvements and exceptionally high EPS growth. Informatica Inc. shows positive trends but at a slower pace, with a marginal net margin and some neutral evaluations. Oddity’s performance signals more dynamic profitability and operational efficiency over the period analyzed.
Financial Ratios Comparison
The table below compares key financial ratios for Informatica Inc. (INFA) and Oddity Tech Ltd. (ODD) based on their most recent fiscal year 2024 data.
| Ratios | Informatica Inc. (INFA) | Oddity Tech Ltd. (ODD) |
|---|---|---|
| ROE | 0.43% | 35.95% |
| ROIC | 0.56% | 28.56% |
| P/E | 788 | 23.75 |
| P/B | 3.39 | 8.54 |
| Current Ratio | 1.82 | 1.79 |
| Quick Ratio | 1.82 | 0.99 |
| D/E (Debt to Equity) | 0.81 | 0.08 |
| Debt-to-Assets | 35.2% | 5.2% |
| Interest Coverage | 0.87 | 1521 |
| Asset Turnover | 0.31 | 1.47 |
| Fixed Asset Turnover | 8.75 | 19.38 |
| Payout ratio | 0.12% | 0% |
| Dividend yield | 0.00015% | 0% |
Interpretation of the Ratios
Informatica Inc.
Informatica’s ratio data is incomplete, preventing a full assessment. However, available metrics suggest challenges with negative returns on equity and assets, elevated net debt to EBITDA, and negative free cash flow to equity. The company does not pay dividends, likely reflecting reinvestment priorities or growth focus, with no indication of share buybacks.
Oddity Tech Ltd.
Oddity Tech shows predominantly favorable ratios in 2024, including strong net margin (15.69%), ROE (35.95%), and ROIC (28.56%), alongside a solid current ratio (1.79) and low debt-to-assets (5.17%). Some concerns arise from an unfavorable WACC and high price-to-book ratio (8.54). Oddity pays no dividends, consistent with a growth or reinvestment strategy.
Which one has the best ratios?
Based on the available evaluations, Oddity Tech Ltd. presents a stronger financial profile with mostly favorable ratios, robust profitability, and low leverage. Informatica Inc.’s missing data and signs of financial stress limit confidence in its ratios. Hence, Oddity Tech currently exhibits the more favorable ratio set.
Strategic Positioning
This section compares the strategic positioning of Informatica Inc. and Oddity Tech Ltd., focusing on market position, key segments, and exposure to technological disruption:
Informatica Inc.
- Large market cap of 7.5B USD in software infrastructure, moderate competitive pressure.
- Focuses on enterprise AI-powered data management, subscription services driving revenue.
- Positioned in mature enterprise software with limited direct technological disruption risk.
Oddity Tech Ltd.
- Smaller market cap of 2.0B USD, higher beta indicating more volatile competition.
- Concentrates on consumer-tech beauty and wellness products, leveraging PowerMatch technology.
- Disrupts offline beauty industry using digital-first brands and technology innovation.
Informatica Inc. vs Oddity Tech Ltd. Positioning
Informatica’s approach is diversified within enterprise data software, offering multiple interoperable products, while Oddity Tech concentrates on niche consumer-tech beauty. Informatica benefits from scale and stable enterprise demand; Oddity Tech’s advantage lies in digital disruption in a specific consumer market.
Which has the best competitive advantage?
Oddity Tech demonstrates a very favorable moat with a growing ROIC exceeding its WACC, indicating durable competitive advantage and increasing profitability. Informatica’s moat evaluation data is unavailable for comparison.
Stock Comparison
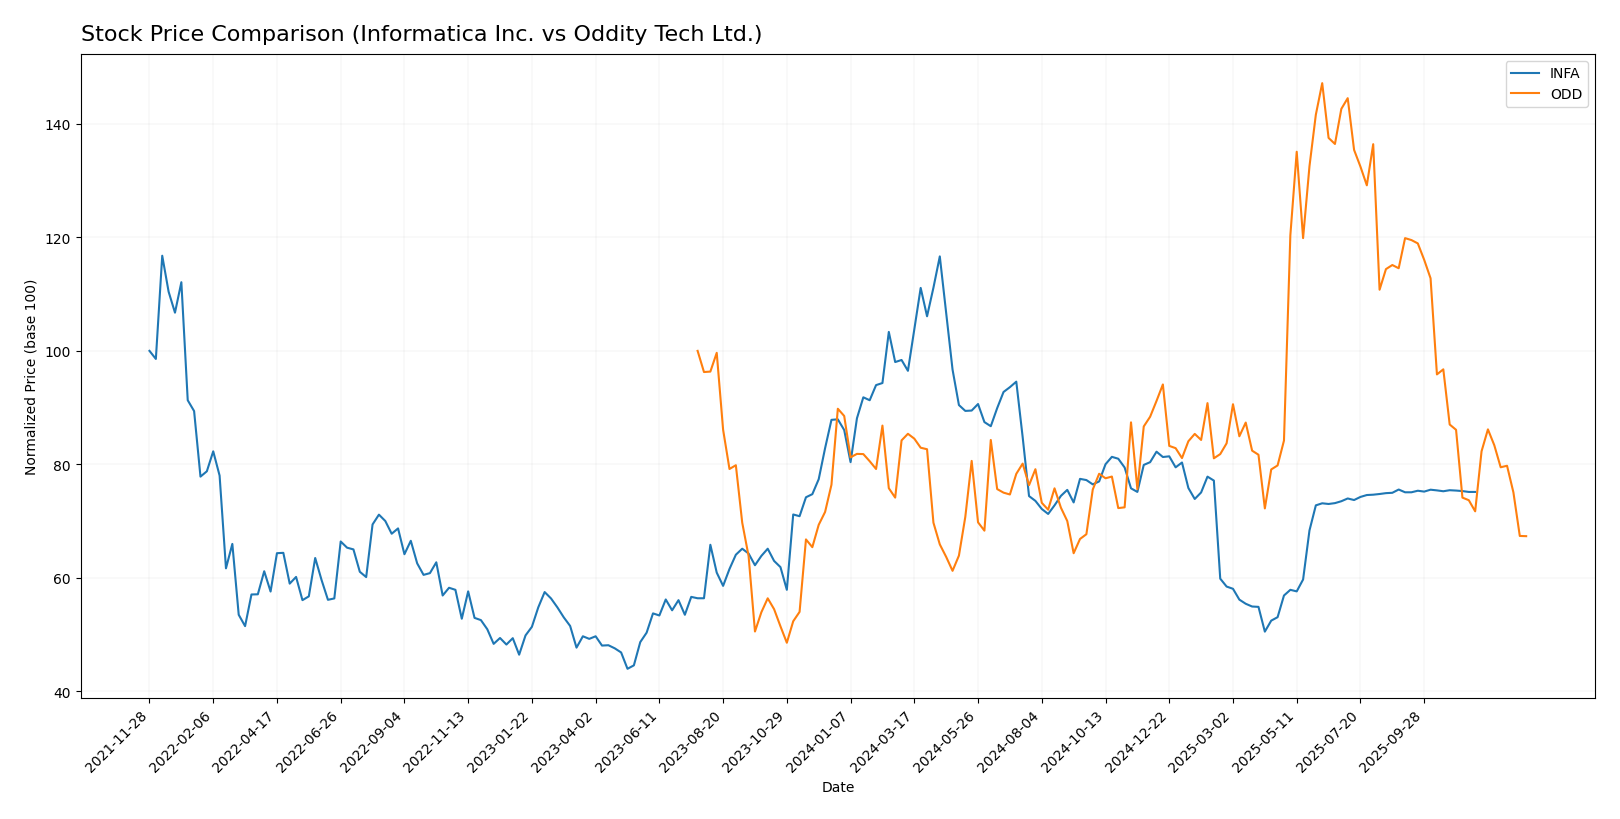
The past year revealed a clear bearish trend for both Informatica Inc. and Oddity Tech Ltd., marked by significant price declines and contrasting momentum dynamics in their recent trading periods.
Trend Analysis
Informatica Inc. experienced a 12.68% price decline over the past 12 months, confirming a bearish trend with accelerating downward momentum. The stock ranged between 16.67 and 38.48, with low recent volatility and a stable short-term trend.
Oddity Tech Ltd. also showed a bearish trend with a 9.16% drop over 12 months, but its decline is decelerating. The stock exhibited higher volatility, fluctuating from 32.19 to 77.35, and recently faced a sharp 21.77% fall with increased negative slope.
Comparing both, Informatica Inc. delivered the largest negative return over the year, while Oddity Tech Ltd. showed less overall loss but a more volatile and sharply declining recent trend.
Target Prices
The current target price consensus reflects a cautiously optimistic view from analysts.
| Company | Target High | Target Low | Consensus |
|---|---|---|---|
| Informatica Inc. | 27 | 27 | 27 |
| Oddity Tech Ltd. | 80 | 40 | 66.33 |
Analysts expect Informatica’s stock to modestly appreciate from its current price of $24.79 toward $27, while Oddity Tech shows a wider range but an average upside from $35.40 to about $66.33.
Analyst Opinions Comparison
This section compares analysts’ ratings and grades for Informatica Inc. and Oddity Tech Ltd.:
Rating Comparison
INFA Rating
- No rating data available
- No Discounted Cash Flow Score available
- No ROE Score available
- No ROA Score available
- No Debt To Equity Score available
- No Overall Score available
ODD Rating
- Rated B+ with a “Very Favorable” status reflecting strong analyst confidence.
- Discounted Cash Flow Score of 4 indicates a favorable valuation based on future cash flows.
- Return on Equity Score of 5 suggests very efficient profit generation from shareholders’ equity.
- Return on Assets Score of 4 shows favorable asset utilization to generate earnings.
- Debt To Equity Score of 3 indicates moderate financial risk with balanced debt levels.
- Overall Score of 3 denotes a moderate general financial assessment by analysts.
Which one is the best rated?
Based solely on the data provided, Oddity Tech Ltd. holds a comprehensive set of ratings and scores, including a B+ rating and favorable metrics, whereas Informatica Inc. has no rating data available for comparison.
Scores Comparison
Here is a comparison of the financial health scores for Informatica Inc. and Oddity Tech Ltd.:
INFA Scores
- Altman Z-Score: 1.94, indicating a grey zone with moderate bankruptcy risk.
- Piotroski Score: 6, classified as average financial strength.
ODD Scores
- Altman Z-Score: 3.78, indicating a safe zone with low bankruptcy risk.
- Piotroski Score: 6, classified as average financial strength.
Which company has the best scores?
Oddity Tech Ltd. has a stronger Altman Z-Score, placing it in the safe zone, compared to Informatica’s grey zone score. Both companies share the same average Piotroski Score of 6, indicating similar financial strength.
Grades Comparison
Here is a comparison of the recent grades assigned to Informatica Inc. and Oddity Tech Ltd.:
Informatica Inc. Grades
This table summarizes recent grades assigned by major grading companies to Informatica Inc.:
| Grading Company | Action | New Grade | Date |
|---|---|---|---|
| Guggenheim | Downgrade | Neutral | 2025-08-07 |
| UBS | Maintain | Neutral | 2025-08-07 |
| Baird | Maintain | Neutral | 2025-05-28 |
| JP Morgan | Downgrade | Neutral | 2025-05-28 |
| RBC Capital | Maintain | Sector Perform | 2025-05-28 |
| Wolfe Research | Downgrade | Peer Perform | 2025-05-28 |
| Wells Fargo | Maintain | Equal Weight | 2025-05-28 |
| Truist Securities | Downgrade | Hold | 2025-05-28 |
| RBC Capital | Maintain | Sector Perform | 2025-05-27 |
| UBS | Maintain | Neutral | 2025-05-16 |
Overall, Informatica Inc. has seen several downgrades with most grades converging around Neutral or Hold ratings.
Oddity Tech Ltd. Grades
Below are the recent grades issued by recognized grading companies for Oddity Tech Ltd.:
| Grading Company | Action | New Grade | Date |
|---|---|---|---|
| Keybanc | Maintain | Overweight | 2026-01-08 |
| JP Morgan | Maintain | Overweight | 2025-12-12 |
| JP Morgan | Maintain | Overweight | 2025-11-21 |
| Barclays | Maintain | Equal Weight | 2025-11-21 |
| Morgan Stanley | Maintain | Equal Weight | 2025-11-21 |
| Needham | Maintain | Buy | 2025-11-20 |
| Keybanc | Maintain | Overweight | 2025-10-08 |
| JMP Securities | Maintain | Market Outperform | 2025-09-23 |
| Morgan Stanley | Maintain | Equal Weight | 2025-08-06 |
| JMP Securities | Maintain | Market Outperform | 2025-08-05 |
Ratings for Oddity Tech Ltd. consistently reflect positive sentiment with multiple Overweight and Buy grades.
Which company has the best grades?
Oddity Tech Ltd. has received predominantly Buy and Overweight grades, indicating stronger analyst confidence than Informatica Inc., which mostly holds Neutral or Hold ratings. This disparity may influence investor perception of growth potential and risk.
Strengths and Weaknesses
Below is a comparison table summarizing the key strengths and weaknesses of Informatica Inc. (INFA) and Oddity Tech Ltd. (ODD) based on the most recent available data.
| Criterion | Informatica Inc. (INFA) | Oddity Tech Ltd. (ODD) |
|---|---|---|
| Diversification | Moderate: Revenue mainly from subscription and professional services; limited product range diversification. | Limited data on product segmentation; focus implied on core tech offerings. |
| Profitability | Data unavailable; difficult to assess current profitability. | Strong profitability with 15.7% net margin and high ROE of 36%. |
| Innovation | Data limited; historical presence in data management solutions. | Very favorable: Demonstrates durable competitive advantage with growing ROIC. |
| Global presence | Established global footprint as a data management company. | Not explicitly detailed but implied technology firm with growing market presence. |
| Market Share | Significant in data integration and cloud services but no recent metrics available. | Data insufficient but strong financial performance suggests increasing market share. |
Key takeaways: Oddity Tech Ltd. shows a very favorable financial profile with strong profitability and a durable competitive moat, making it attractive for investors focused on value creation. Informatica Inc. lacks updated financial data, limiting confident evaluation and requiring caution before investment.
Risk Analysis
Below is a comparative table of key risks for Informatica Inc. (INFA) and Oddity Tech Ltd. (ODD) based on the latest available data from 2024 and company profiles.
| Metric | Informatica Inc. (INFA) | Oddity Tech Ltd. (ODD) |
|---|---|---|
| Market Risk | Moderate beta 1.14; tech sector volatility | High beta 3.18; high share price volatility |
| Debt level | Data unavailable; Altman Z-score in grey zone indicates moderate financial stress | Low debt-to-equity 0.08; Altman Z-score in safe zone 3.78 |
| Regulatory Risk | US tech regulations; data privacy compliance critical | Exposure to global regulations; Israeli base with EU/US market risks |
| Operational Risk | Large enterprise platform complexity; 5,200 employees | Smaller scale (489 employees); supply chain and scaling risks |
| Environmental Risk | Moderate; data centers energy consumption | Moderate; consumer tech product sustainability concerns |
| Geopolitical Risk | US-based, relatively lower risk | Higher due to Israel location and geopolitical tensions |
The most likely and impactful risks center on market volatility and regulatory developments. Oddity Tech’s high beta reflects elevated market risk, while Informatica’s grey-zone Altman Z-score suggests caution on financial stability. Regulatory compliance and geopolitical exposure remain critical for both, with Oddity Tech facing added geopolitical uncertainty.
Which Stock to Choose?
Informatica Inc. shows a generally favorable income evolution with a 23.95% revenue growth over 2020-2024 and strong EBIT and net margin improvements. Its profitability ratios remain low, with a return on equity near 0.4%, and it carries moderate debt with a net debt to EBITDA around 2.8. Rating data is unavailable for this company.
Oddity Tech Ltd. presents robust income growth, including a 484.83% revenue increase over the period and favorable profitability metrics such as a 35.95% return on equity and an 18.87% EBIT margin. Its debt level is low, supported by a very favorable debt-to-equity ratio of 0.08. The company holds a very favorable overall rating of B+.
Considering the ratings and financial evaluations, Oddity Tech Ltd. might appear more favorable for investors seeking strong profitability and a durable competitive advantage, while Informatica Inc.’s improving income statement could be interpreted as suitable for those focused on growth potential amid moderate financial leverage. The choice may depend on the investor’s risk tolerance and investment strategy.
Disclaimer: Investment carries a risk of loss of initial capital. The past performance is not a reliable indicator of future results. Be sure to understand risks before making an investment decision.
Go Further
I encourage you to read the complete analyses of Informatica Inc. and Oddity Tech Ltd. to enhance your investment decisions: