In today’s fast-evolving technology sector, Nutanix, Inc. and Informatica Inc. stand out as leaders in software infrastructure, each driving innovation in cloud and data management. Nutanix focuses on enterprise cloud platforms and hybrid cloud orchestration, while Informatica specializes in AI-powered data integration and governance solutions. Given their overlapping markets and strategic approaches, this article will explore which company presents a more compelling investment opportunity for your portfolio.
Table of contents
Companies Overview
I will begin the comparison between Nutanix and Informatica by providing an overview of these two companies and their main differences.
Nutanix Overview
Nutanix, Inc. operates as an enterprise cloud platform provider, serving customers across North America, Europe, Asia Pacific, Middle East, Latin America, and Africa. The company offers a comprehensive suite of virtualization, storage, networking, and cloud management solutions designed to simplify hybrid and multi-cloud environments. Founded in 2009 and headquartered in San Jose, California, Nutanix focuses on infrastructure software to streamline cloud-native operations for diverse industries.
Informatica Overview
Informatica Inc. develops an AI-powered platform that unifies and manages data across multi-cloud and hybrid systems at an enterprise scale, primarily in the United States. Its offerings include data integration, API management, data quality, master data management, and governance products that support accurate and compliant data usage. Founded in 1993 and based in Redwood City, California, Informatica emphasizes data connectivity and governance to enable comprehensive insights and operational efficiency.
Key similarities and differences
Both Nutanix and Informatica operate in the Software – Infrastructure industry, focusing on enabling enterprise-scale cloud and data solutions. Nutanix specializes in cloud infrastructure and virtualization, while Informatica centers on data management and AI-powered data integration. Nutanix serves a global market with hybrid cloud orchestration, whereas Informatica targets primarily U.S. enterprises with data governance and integration platforms. Both companies provide professional services, but their core business models address distinct aspects of the cloud technology stack.
Income Statement Comparison
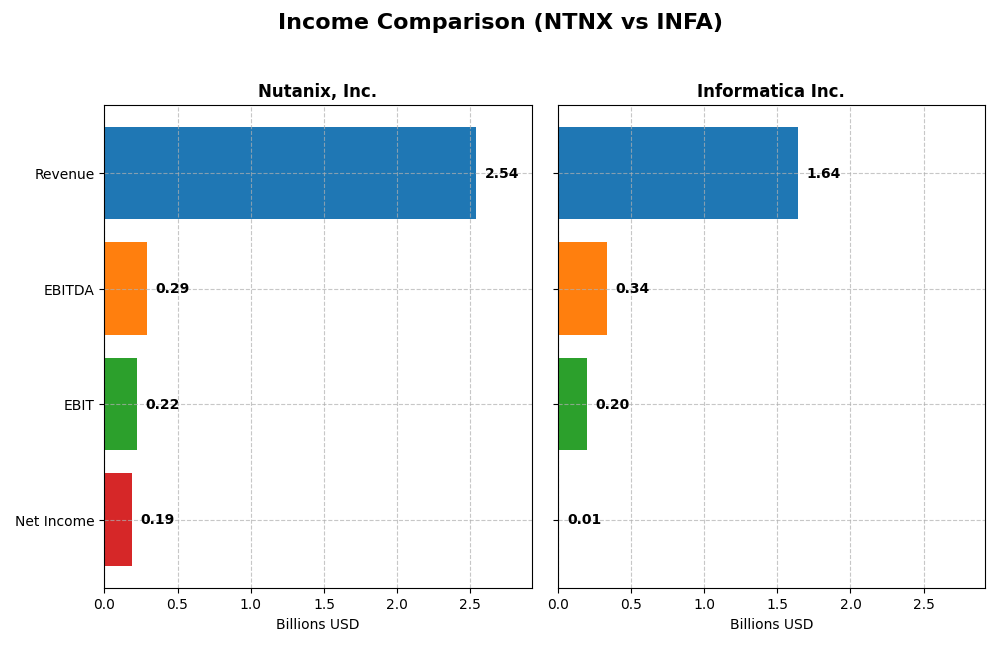
The table below presents a side-by-side comparison of the most recent fiscal year income statement metrics for Nutanix, Inc. and Informatica Inc., providing a snapshot of their financial performance.
| Metric | Nutanix, Inc. (NTNX) | Informatica Inc. (INFA) |
|---|---|---|
| Market Cap | 12.4B | 7.5B |
| Revenue | 2.54B | 1.64B |
| EBITDA | 293M | 339M |
| EBIT | 220M | 199M |
| Net Income | 188M | 10M |
| EPS | 0.70 | 0.033 |
| Fiscal Year | 2025 | 2024 |
Income Statement Interpretations
Nutanix, Inc.
Nutanix’s revenue grew significantly from $1.39B in 2021 to $2.54B in 2025, with net income improving from a loss of $1.03B to a profit of $188M. Gross margins remained strong near 87%, while net margin expanded to 7.4%. The latest year showed accelerated growth, with an 18% revenue increase and 228% net margin improvement, signaling a positive turnaround.
Informatica Inc.
Informatica’s revenue increased steadily from $1.32B in 2020 to $1.64B in 2024, with net income fluctuating but ending slightly positive at $9.9M. Gross margin remained favorable at 80%, and EBIT margin improved to 12%. However, revenue growth slowed to 2.8% in the latest year, while net margin stayed low at 0.6%, indicating modest profitability gains.
Which one has the stronger fundamentals?
Nutanix demonstrates stronger fundamentals with robust revenue and net income growth, higher margins, and a marked recent profitability turnaround. Informatica shows consistent but slower revenue growth and very slim net margins. Nutanix’s favorable income statement metrics and growth rates suggest a more dynamic financial performance compared to Informatica’s moderate improvements.
Financial Ratios Comparison
The table below presents the most recent key financial ratios for Nutanix, Inc. and Informatica Inc., providing a snapshot of their profitability, liquidity, valuation, and leverage metrics for informed comparison.
| Ratios | Nutanix, Inc. (NTNX) FY 2025 | Informatica Inc. (INFA) FY 2024 |
|---|---|---|
| ROE | -27.1% | 0.43% |
| ROIC | 8.1% | 0.56% |
| P/E | 106.7 | 787.9 |
| P/B | -29.0 | 3.39 |
| Current Ratio | 1.72 | 1.82 |
| Quick Ratio | 1.72 | 1.82 |
| D/E (Debt-to-Equity) | -2.14 | 0.81 |
| Debt-to-Assets | 45.2% | 35.2% |
| Interest Coverage | 8.75 | 0.87 |
| Asset Turnover | 0.77 | 0.31 |
| Fixed Asset Turnover | 9.15 | 8.75 |
| Payout Ratio | 0 | 0.12% |
| Dividend Yield | 0 | 0.00015% |
Interpretation of the Ratios
Nutanix, Inc.
Nutanix shows a mix of strengths and weaknesses in its financial ratios. The company has favorable liquidity and solvency metrics, including a current ratio of 1.72 and strong interest coverage of 11.15, indicating good short-term financial health and debt servicing capacity. However, a negative return on equity at -27.12% and a high price-to-earnings ratio of 106.74 raise concerns about profitability and valuation. Nutanix does not pay dividends, reflecting either reinvestment priorities or growth strategies.
Informatica Inc.
No financial ratios or key metrics data are available for Informatica, preventing a detailed ratio analysis. This lack of information limits the ability to evaluate its financial health, profitability, or capital structure. Additionally, Informatica does not pay dividends, which may suggest a focus on reinvestment, growth, or other strategic uses of cash, but the absence of data restricts further insight into shareholder returns.
Which one has the best ratios?
Based solely on the available data, Nutanix presents a balanced profile with half of its ratios favorable and about 21% unfavorable, resulting in a slightly favorable overall ratio assessment. Informatica’s missing data makes direct comparison impossible. Therefore, Nutanix currently provides a clearer, though mixed, financial picture, while Informatica’s ratio quality remains indeterminate.
Strategic Positioning
This section compares the strategic positioning of Nutanix and Informatica, focusing on market position, key segments, and exposure to technological disruption:
Nutanix, Inc.
- Market leader in enterprise cloud infrastructure with moderate competitive pressure, global presence.
- Key drivers are subscription cloud services, professional services, and enterprise virtualization products.
- Invests in cloud-native environments and hybrid cloud orchestration, adapting to virtualization and Kubernetes trends.
Informatica Inc.
- Strong presence in AI-powered data management, facing intense competition in cloud data integration.
- Focus on AI-driven data integration, API management, and governance across multi-cloud and hybrid systems.
- Exposed to rapid AI and cloud evolution, emphasizing data quality, master data management, and regulatory compliance.
Nutanix vs Informatica Positioning
Nutanix adopts a diversified approach centered on cloud infrastructure and hybrid cloud orchestration, leveraging strong subscription revenue. Informatica concentrates on AI-powered data management and integration solutions, focusing on data governance and compliance. Nutanix’s broad industry coverage contrasts with Informatica’s specialized platform emphasis.
Which has the best competitive advantage?
Based on available MOAT data, Nutanix demonstrates a very favorable durable competitive advantage with growing ROIC above WACC, indicating efficient capital use and increasing profitability. Informatica lacks sufficient data for MOAT evaluation.
Stock Comparison
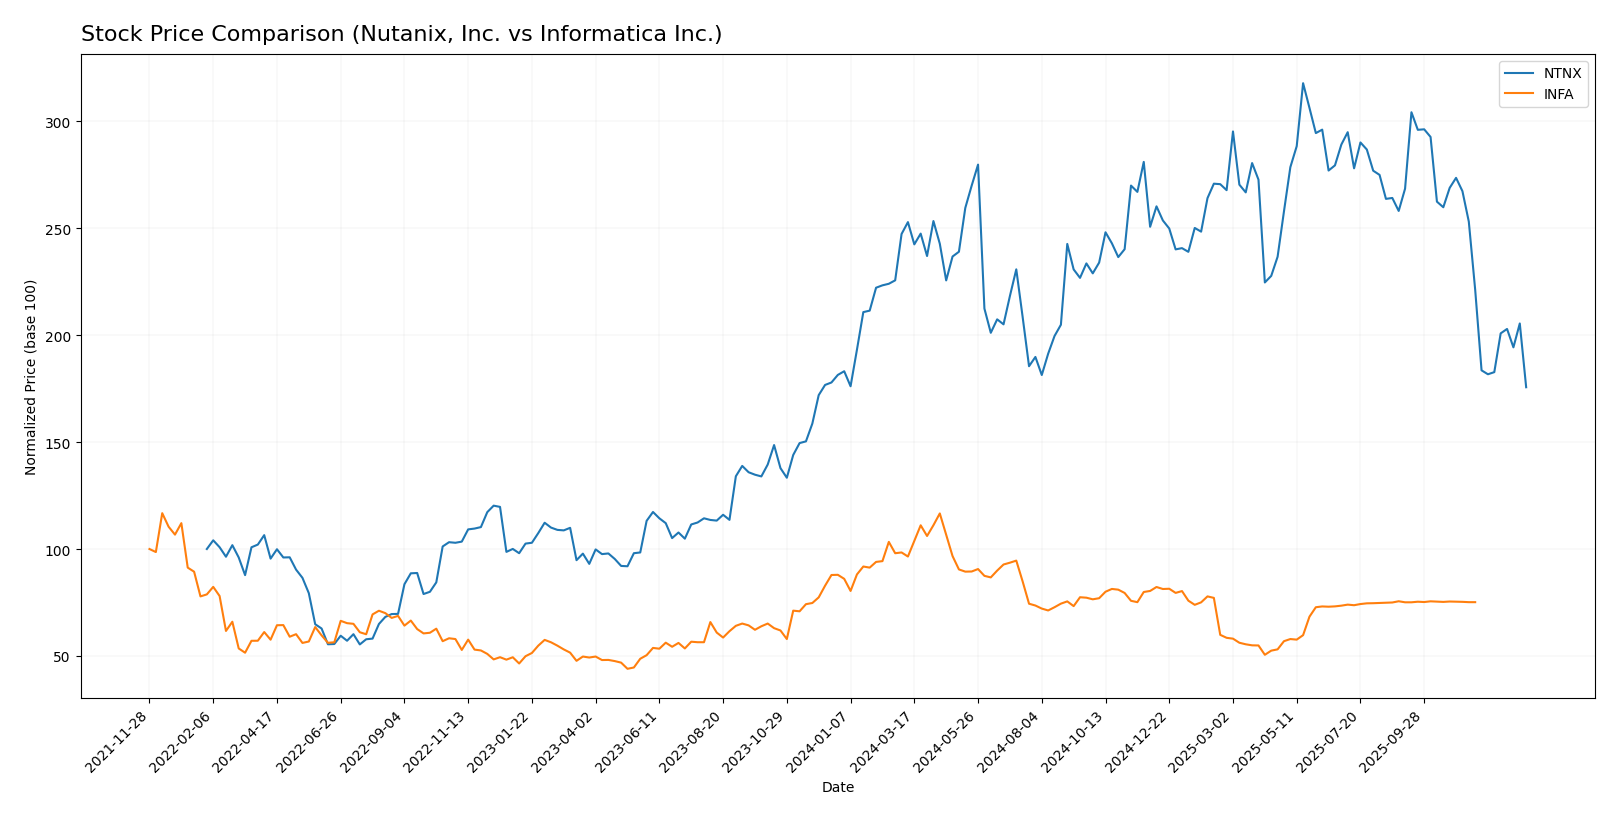
The stock prices of Nutanix, Inc. (NTNX) and Informatica Inc. (INFA) have experienced notable declines over the past 12 months, with distinct trading volume dynamics and recent shifts in trend momentum.
Trend Analysis
Nutanix, Inc. (NTNX) exhibited a bearish trend with a -22.16% price decline over the past year, accompanied by deceleration in the downtrend and a high volatility level, as shown by an 8.67 std deviation. Its highest and lowest prices were 82.77 and 45.74 respectively.
Informatica Inc. (INFA) also showed a bearish trend over 12 months with a price drop of -12.68%, but the decline accelerated. Volatility was lower at a 4.46 std deviation, with prices ranging between 38.48 and 16.67. The recent short-term trend was neutral.
Comparing both, Nutanix’s stock showed a more pronounced bearish trend and higher volatility than Informatica, which delivered the better market performance despite its own decline.
Target Prices
Analysts present a clear consensus on target prices for Nutanix, Inc. and Informatica Inc.
| Company | Target High | Target Low | Consensus |
|---|---|---|---|
| Nutanix, Inc. | 90 | 53 | 64.67 |
| Informatica Inc. | 27 | 27 | 27 |
The target consensus for Nutanix suggests a potential upside from its current $45.74 price, while Informatica’s consensus target of $27 is slightly above its current $24.79 price, indicating modest growth expectations.
Analyst Opinions Comparison
This section compares analysts’ ratings and grades for Nutanix, Inc. and Informatica Inc.:
Rating Comparison
Nutanix, Inc. Rating
- Rating: C+, evaluated as very favorable.
- Discounted Cash Flow Score: 4, favorable score.
- ROE Score: 1, very unfavorable rating.
- ROA Score: 4, favorable rating.
- Debt To Equity Score: 1, very unfavorable score.
- Overall Score: 2, moderate rating overall.
Informatica Inc. Rating
- No rating data available.
- No discounted cash flow score provided.
- No ROE score available.
- No ROA score available.
- No debt to equity score available.
- No overall score data available.
Which one is the best rated?
Based on the provided data, Nutanix holds a C+ rating with detailed scores, showing a mix of favorable and very unfavorable metrics. Informatica has no available rating or scores, making Nutanix the only company with an analyst rating to consider here.
Scores Comparison
Here is a comparison of the Altman Z-Score and Piotroski Score for Nutanix, Inc. and Informatica Inc.:
Nutanix Scores
- Altman Z-Score of 1.48, indicating financial distress zone
- Piotroski Score of 6, reflecting average financial strength
Informatica Scores
- Altman Z-Score of 1.94, placing it in the grey zone
- Piotroski Score of 6, also indicating average strength
Which company has the best scores?
Informatica holds a slightly better Altman Z-Score in the grey zone, suggesting lower bankruptcy risk than Nutanix in distress zone. Both share the same average Piotroski Score of 6, indicating comparable financial strength.
Grades Comparison
Here is a comparison of the recent grades assigned by reputable grading companies for Nutanix, Inc. and Informatica Inc.:
Nutanix, Inc. Grades
The following table shows recent grades from well-known financial institutions for Nutanix, Inc.:
| Grading Company | Action | New Grade | Date |
|---|---|---|---|
| Barclays | Downgrade | Equal Weight | 2026-01-15 |
| Morgan Stanley | Downgrade | Equal Weight | 2026-01-12 |
| RBC Capital | Maintain | Outperform | 2026-01-05 |
| Goldman Sachs | Maintain | Buy | 2025-11-28 |
| JP Morgan | Maintain | Overweight | 2025-11-26 |
| Needham | Maintain | Buy | 2025-11-26 |
| Wells Fargo | Maintain | Equal Weight | 2025-11-26 |
| Morgan Stanley | Maintain | Overweight | 2025-11-26 |
| Keybanc | Maintain | Overweight | 2025-11-26 |
| Piper Sandler | Maintain | Overweight | 2025-11-26 |
Nutanix shows a generally positive trend, with most institutions maintaining overweight or buy ratings, though a few recent downgrades to equal weight indicate some caution.
Informatica Inc. Grades
The following table presents the grading updates for Informatica Inc. from established grading firms:
| Grading Company | Action | New Grade | Date |
|---|---|---|---|
| Guggenheim | Downgrade | Neutral | 2025-08-07 |
| UBS | Maintain | Neutral | 2025-08-07 |
| Baird | Maintain | Neutral | 2025-05-28 |
| JP Morgan | Downgrade | Neutral | 2025-05-28 |
| RBC Capital | Maintain | Sector Perform | 2025-05-28 |
| Wolfe Research | Downgrade | Peer Perform | 2025-05-28 |
| Wells Fargo | Maintain | Equal Weight | 2025-05-28 |
| Truist Securities | Downgrade | Hold | 2025-05-28 |
| RBC Capital | Maintain | Sector Perform | 2025-05-27 |
| UBS | Maintain | Neutral | 2025-05-16 |
Informatica’s grades predominantly reflect neutral to hold ratings, with several downgrades suggesting a more cautious outlook.
Which company has the best grades?
Nutanix, Inc. has received predominantly buy and overweight grades, reflecting stronger analyst confidence compared to Informatica Inc., which holds mostly neutral and hold ratings. This difference may influence investors seeking growth potential versus stability.
Strengths and Weaknesses
Below is a comparison of key strengths and weaknesses for Nutanix, Inc. (NTNX) and Informatica Inc. (INFA) based on the most recent available data.
| Criterion | Nutanix, Inc. (NTNX) | Informatica Inc. (INFA) |
|---|---|---|
| Diversification | Strong subscription-based revenue with growing professional services segment; well-balanced product and service mix | Subscription-focused with significant license and maintenance revenues; less data on diversification |
| Profitability | Neutral net margin (7.42%), negative ROE (-27.12%), moderate ROIC (8.11%) | Data missing, unable to evaluate profitability |
| Innovation | Demonstrates durable competitive advantage with growing ROIC and increasing profitability | Data insufficient to assess innovation level |
| Global presence | Established global footprint with professional services and subscriptions worldwide | Global presence implied by diversified revenue streams but details unavailable |
| Market Share | Competitive in cloud software and infrastructure with increasing subscription revenue | Market share unclear due to missing data |
Key takeaways: Nutanix shows a durable competitive advantage with growing returns and a subscription-driven business model, despite some profitability challenges. Informatica lacks sufficient recent financial data for a full evaluation, limiting comparative insights and investment decisiveness.
Risk Analysis
Below is a comparison of key risk factors for Nutanix, Inc. (NTNX) and Informatica Inc. (INFA) as of the most recent fiscal year 2025.
| Metric | Nutanix, Inc. (NTNX) | Informatica Inc. (INFA) |
|---|---|---|
| Market Risk | Moderate (Beta 0.49, relatively low volatility) | Higher (Beta 1.135, more sensitive to market swings) |
| Debt level | Neutral (Debt to assets 45.16%, interest coverage strong at 11.15) | Data unavailable |
| Regulatory Risk | Moderate (operates globally, subject to multi-jurisdiction regulations) | Moderate (US-based, cloud data regulations evolving) |
| Operational Risk | Moderate (complex cloud platform, multiple product lines) | Moderate (AI-powered multi-cloud platform with integration complexity) |
| Environmental Risk | Low (software sector with limited direct environmental impact) | Low (software sector with limited direct environmental impact) |
| Geopolitical Risk | Moderate (global presence including emerging markets) | Moderate (primarily US-centric but exposed to global cloud trends) |
Nutanix shows moderate market and operational risks but benefits from strong interest coverage and liquidity ratios. Its Altman Z-score in the distress zone signals financial vulnerability, requiring caution. Informatica carries higher market risk due to its beta but lacks detailed financial risk data, though its Altman Z-score places it in a grey zone, indicating moderate financial risk. Overall, Nutanix’s financial distress risk and high P/E ratio are the most impactful concerns, while Informatica’s market sensitivity and evolving regulatory environment warrant attention.
Which Stock to Choose?
Nutanix, Inc. (NTNX) shows a strong income evolution with 18.11% revenue growth in 2025 and favorable profitability metrics including a 7.42% net margin. Financial ratios are slightly favorable overall, supported by a very favorable MOAT due to ROIC exceeding WACC, but the company carries moderate net debt and a mixed rating profile with some unfavorable valuation scores.
Informatica Inc. (INFA) presents a more modest income evolution, with 2.81% revenue growth in 2024 and neutral to favorable profitability indicators like an 80.11% gross margin and 12.15% EBIT margin. However, key financial ratios and ratings data are incomplete, though scores indicate a grey zone for bankruptcy risk and average financial strength.
For investors, Nutanix’s strong income growth and very favorable moat suggest potential appeal for growth-focused profiles, while Informatica’s stable profitability and moderate risk profile might be more suitable for those seeking steadiness amid incomplete data. The choice could depend on whether an investor prioritizes growth dynamics or prefers a company with a steadier income statement and average financial scores.
Disclaimer: Investment carries a risk of loss of initial capital. The past performance is not a reliable indicator of future results. Be sure to understand risks before making an investment decision.
Go Further
I encourage you to read the complete analyses of Nutanix, Inc. and Informatica Inc. to enhance your investment decisions: