Informatica Inc. and Elastic N.V. are two prominent players in the technology sector, each excelling in data management and software solutions. Informatica specializes in AI-powered data integration and governance, while Elastic focuses on real-time search and analytics platforms. Their shared emphasis on innovation and multi-cloud environments makes them compelling subjects for comparison. In this article, I will help you identify which company offers the most promising opportunity for your investment portfolio.
Table of contents
Companies Overview
I will begin the comparison between Informatica Inc. and Elastic N.V. by providing an overview of these two companies and their main differences.
Informatica Inc. Overview
Informatica Inc. develops an AI-powered platform that connects, manages, and unifies data across multi-cloud and hybrid systems at enterprise scale. Its product suite includes data integration, API management, data quality, master data management, customer 360, data catalog, and governance solutions. Founded in 1993 and headquartered in Redwood City, CA, Informatica serves the software infrastructure sector with a market cap of approximately 7.5B USD.
Elastic N.V. Overview
Elastic N.V. delivers search technology solutions designed for public and private cloud environments. Its flagship Elastic Stack includes Elasticsearch, Kibana, Beats, Elastic Agent, and Logstash, enabling data ingestion, search, analysis, and visualization. Incorporated in 2012 and based in Mountain View, CA, Elastic operates in the software application sector with a market cap near 7.6B USD, focusing on multi-cloud data management.
Key similarities and differences
Both companies operate in the technology sector with a focus on software solutions for data management, though Informatica emphasizes infrastructure-level AI-driven data integration and governance. In contrast, Elastic specializes in application-level search and analytics with its Elastic Stack. While Informatica targets enterprise-scale multi-cloud and hybrid environments, Elastic serves multi-cloud setups with a focus on real-time data search and visualization. Their market caps and U.S. headquarters are comparable, but their product scopes differ significantly.
Income Statement Comparison
This table presents a side-by-side comparison of key income statement metrics for Informatica Inc. and Elastic N.V. based on their most recent fiscal year data.
| Metric | Informatica Inc. (INFA) | Elastic N.V. (ESTC) |
|---|---|---|
| Market Cap | 7.5B | 7.6B |
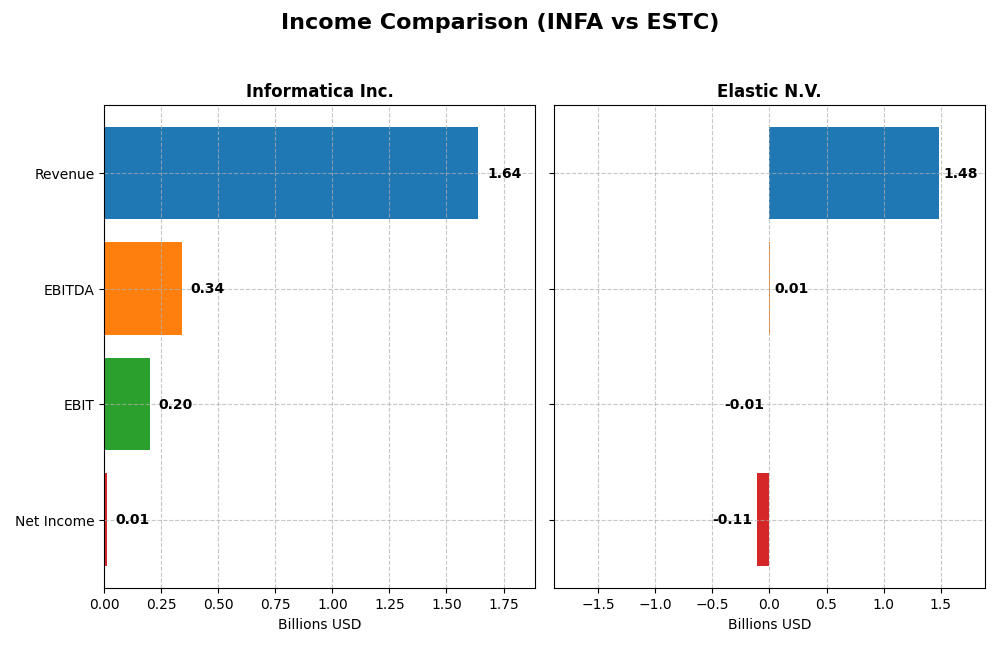
| Revenue | 1.64B | 1.48B |
| EBITDA | 339M | 6.1M |
| EBIT | 199M | -6.3M |
| Net Income | 9.9M | -108M |
| EPS | 0.03 | -1.04 |
| Fiscal Year | 2024 | 2025 |
Income Statement Interpretations
Informatica Inc.
Informatica Inc. showed steady revenue growth from $1.32B in 2020 to $1.64B in 2024, with net income turning positive in 2024 at $9.9M after consistent losses. Gross margins remained favorable above 80%, with EBIT margin improving to 12.15%. The latest year reflected slower revenue growth at 2.81%, but significant EBIT and net margin improvements indicate operational progress.
Elastic N.V.
Elastic N.V. exhibited strong revenue growth from $608M in 2021 to $1.48B in 2025, accompanied by fluctuating net income and a $108M loss in 2025. Gross margin stayed favorable near 74%, though EBIT margin remained negative at -0.42%. The recent year showed a robust 17% revenue increase, but net margin and EPS declined sharply, reflecting profitability challenges despite growth.
Which one has the stronger fundamentals?
Both companies have favorable gross margins and growth in revenue over the periods analyzed. Informatica’s recent shift to positive net income and improving EBIT margin contrasts with Elastic’s continued net losses and negative EBIT margin, despite higher revenue growth. Informatica’s stability and margin enhancements suggest comparatively stronger fundamentals, while Elastic shows robust top-line expansion but ongoing profitability risks.
Financial Ratios Comparison
The following table presents a side-by-side comparison of key financial ratios for Informatica Inc. (INFA) and Elastic N.V. (ESTC), based on their most recent fiscal year data.
| Ratios | Informatica Inc. (INFA) 2024 | Elastic N.V. (ESTC) 2025 |
|---|---|---|
| ROE | 0.43% | -11.66% |
| ROIC | 0.56% | -11.80% |
| P/E | 788 | -82.65 |
| P/B | 3.39 | 9.64 |
| Current Ratio | 1.82 | 1.92 |
| Quick Ratio | 1.82 | 1.92 |
| D/E (Debt-to-Equity) | 0.81 | 0.64 |
| Debt-to-Assets | 35.2% | 22.9% |
| Interest Coverage | 0.87 | -2.17 |
| Asset Turnover | 0.31 | 0.57 |
| Fixed Asset Turnover | 8.75 | 51.28 |
| Payout Ratio | 0.12% | 0% |
| Dividend Yield | 0.00015% | 0% |
Interpretation of the Ratios
Informatica Inc.
The available data for Informatica Inc. shows mixed ratio signals with moderate leverage (netDebtToEBITDA about 2.8 in 2024) and a current ratio near 1.8 indicating decent short-term liquidity. Profitability ratios such as return on equity and assets remain very low, close to zero, while free cash flow to equity is negative, suggesting cash generation challenges. Informatica does not pay dividends, likely reflecting reinvestment priorities or growth phase.
Elastic N.V.
Elastic N.V.’s 2025 ratios reveal a challenging profitability landscape, with negative net margin (-7.29%) and return on equity (-11.66%), both unfavorable. Liquidity appears solid with a current ratio of 1.92, and debt metrics are generally favorable. The company does not pay dividends, consistent with its financial profile and possible focus on R&D and expansion, supported by a modest debt-to-equity ratio of 0.64.
Which one has the best ratios?
Elastic N.V. and Informatica Inc. both face profitability weaknesses, but Elastic displays stronger liquidity and lower leverage risks. Informatica’s negative free cash flow and near-zero returns contrast with Elastic’s mixed but more balanced financial structure. Overall, Elastic’s ratios suggest a more stable short-term position despite ongoing profitability challenges.
Strategic Positioning
This section compares the strategic positioning of Informatica Inc. and Elastic N.V., including market position, key segments, and exposure to technological disruption:
Informatica Inc.
- Established software infrastructure player with a $7.54B market cap and moderate competitive pressure.
- Focus on AI-powered data management, integration, governance, and cloud subscription services.
- Exposure to cloud and AI technologies in multi-cloud and hybrid data environments.
Elastic N.V.
- Application software provider with $7.65B market cap, facing competitive pressure in search technology.
- Specializes in Elastic Stack products for search, data ingestion, analytics, and visualization.
- Relies on cloud-native Elastic Stack, addressing multi-cloud data search and analytics disruption.
Informatica Inc. vs Elastic N.V. Positioning
Informatica has a diversified platform covering data integration, governance, and quality, while Elastic concentrates on search and analytics software. Informatica’s broad enterprise data management contrasts with Elastic’s specialized cloud-native stack focus.
Which has the best competitive advantage?
Elastic shows a slightly unfavorable moat, currently destroying value but improving profitability. Informatica’s moat evaluation data is missing, preventing a direct competitive advantage comparison based on MOAT metrics.
Stock Comparison
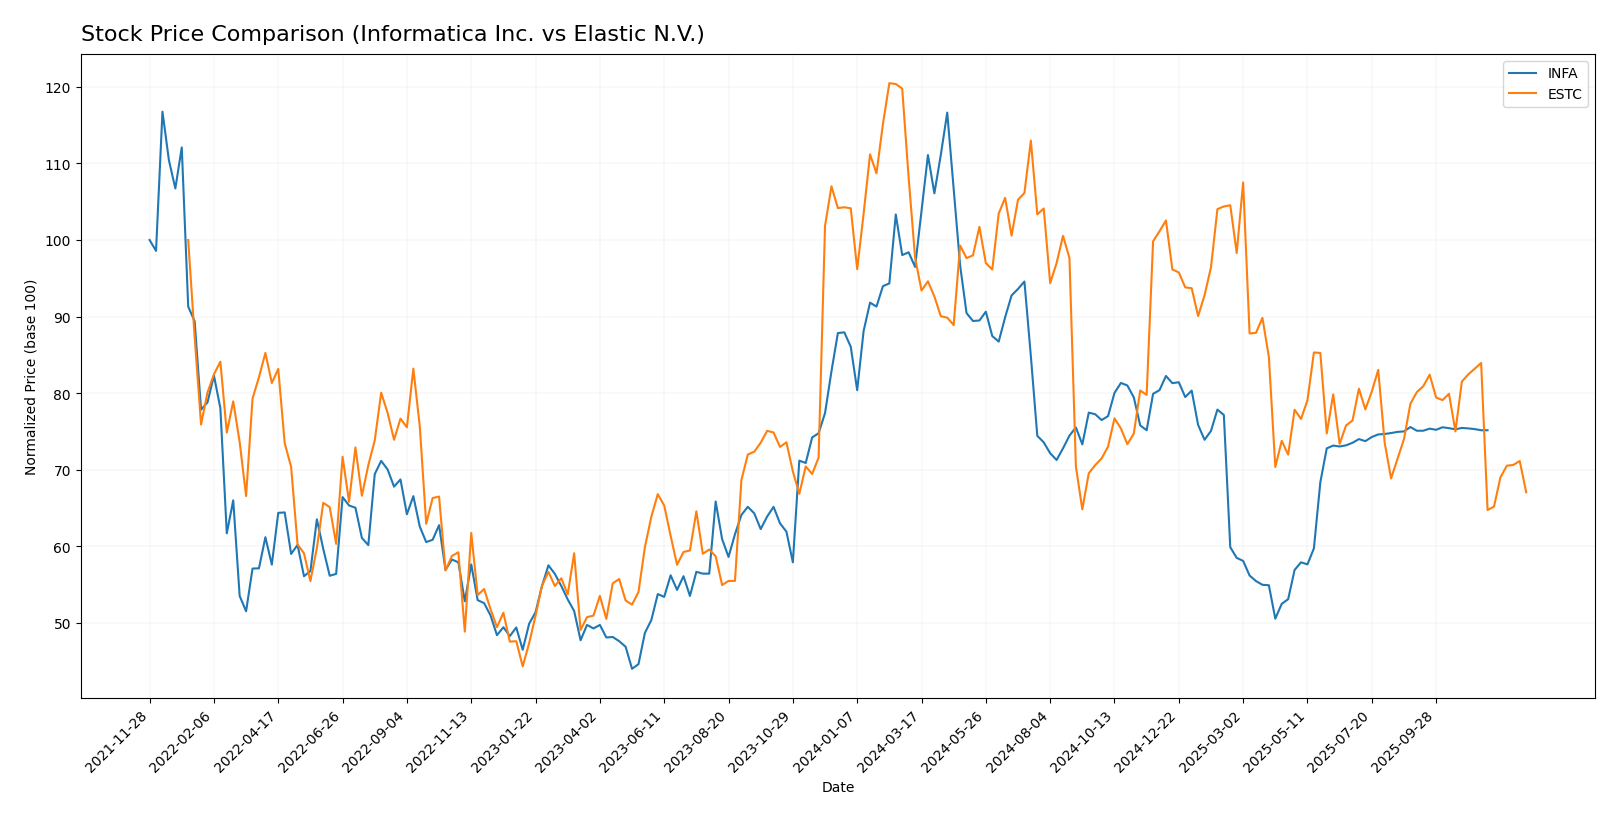
The past year has seen Informatica Inc. (INFA) and Elastic N.V. (ESTC) both experience bearish trends, with notable price declines and differing recent trading dynamics.
Trend Analysis
Informatica Inc. (INFA) recorded a 12.68% price decline over the past 12 months, marking a bearish trend with accelerating downward momentum. The stock ranged between $16.67 and $38.48, showing moderate volatility with a standard deviation of 4.46.
Elastic N.V. (ESTC) faced a steeper 44.35% price drop over the same period, reflecting a bearish trend with deceleration in the decline. Volatility was higher, with a standard deviation of 14.77, and prices fluctuated between $70.04 and $130.39.
Comparing both stocks, INFA’s decline was less severe than ESTC’s, indicating a relatively better market performance over the last year despite both showing bearish trends.
Target Prices
Analysts provide clear target price guidance for Informatica Inc. and Elastic N.V., reflecting varied expectations for each stock.
| Company | Target High | Target Low | Consensus |
|---|---|---|---|
| Informatica Inc. | 27 | 27 | 27 |
| Elastic N.V. | 134 | 76 | 108 |
Informatica’s target consensus at $27 is modestly above its current price of $24.79, indicating limited upside. Elastic’s consensus target of $108 suggests significant potential growth from its $72.56 market price, reflecting stronger analyst optimism.
Analyst Opinions Comparison
This section compares analysts’ ratings and grades for Informatica Inc. and Elastic N.V.:
Rating Comparison
Informatica Inc. Rating
- No rating data available for Informatica Inc.
- Discounted Cash Flow Score: No data available
- ROE Score: No data available
- ROA Score: No data available
- Debt To Equity Score: No data available
- Overall Score: No data available
Elastic N.V. Rating
- Rating: C-, evaluated as Very Favorable overall by analysts.
- Discounted Cash Flow Score is 3, indicating a moderate valuation based on future cash flow projections.
- Return on Equity Score is 1, reflecting very unfavorable efficiency at generating profit from equity.
- Return on Assets Score is 1, showing very unfavorable asset utilization in generating earnings.
- Debt To Equity Score is 1, signaling very unfavorable financial risk with high reliance on debt.
- Overall Score is 1, considered very unfavorable by the analysts’ evaluation.
Which one is the best rated?
Based on the available data, Elastic N.V. is the only company with an analyst rating and detailed scores. Although its overall score and financial metrics are rated very unfavorable, it holds a C- rating classified as very favorable overall. Informatica Inc. lacks any rating data for comparison.
Scores Comparison
Here is a comparison of the financial scores for Informatica Inc. and Elastic N.V.:
INFA Scores
- Altman Z-Score: 1.94, in the grey zone indicating moderate bankruptcy risk.
- Piotroski Score: 6, classified as average financial strength.
ESTC Scores
- Altman Z-Score: 3.23, in the safe zone indicating low bankruptcy risk.
- Piotroski Score: 4, classified as average financial strength.
Which company has the best scores?
Based on the data, ESTC has a better Altman Z-Score indicating stronger financial stability, while both companies share average Piotroski Scores, with INFA scoring slightly higher. Overall, ESTC’s scores suggest a lower bankruptcy risk.
Grades Comparison
The following presents a detailed comparison of the recent grades assigned to Informatica Inc. and Elastic N.V.:
Informatica Inc. Grades
This table summarizes recent grading actions from recognized financial institutions for Informatica Inc.:
| Grading Company | Action | New Grade | Date |
|---|---|---|---|
| Guggenheim | Downgrade | Neutral | 2025-08-07 |
| UBS | Maintain | Neutral | 2025-08-07 |
| Baird | Maintain | Neutral | 2025-05-28 |
| JP Morgan | Downgrade | Neutral | 2025-05-28 |
| RBC Capital | Maintain | Sector Perform | 2025-05-28 |
| Wolfe Research | Downgrade | Peer Perform | 2025-05-28 |
| Wells Fargo | Maintain | Equal Weight | 2025-05-28 |
| Truist Securities | Downgrade | Hold | 2025-05-28 |
| RBC Capital | Maintain | Sector Perform | 2025-05-27 |
| UBS | Maintain | Neutral | 2025-05-16 |
Informatica’s grades show a clear trend toward more cautious ratings, with multiple downgrades from Buy/Outperform to Neutral/Hold and consistent maintenance of Sector Perform or Neutral ratings.
Elastic N.V. Grades
This table provides the latest grades and actions from recognized grading companies for Elastic N.V.:
| Grading Company | Action | New Grade | Date |
|---|---|---|---|
| Citigroup | Maintain | Buy | 2025-11-24 |
| Cantor Fitzgerald | Maintain | Neutral | 2025-11-21 |
| Stifel | Maintain | Buy | 2025-11-21 |
| B of A Securities | Maintain | Neutral | 2025-11-21 |
| DA Davidson | Maintain | Neutral | 2025-11-21 |
| Scotiabank | Maintain | Sector Perform | 2025-11-21 |
| Piper Sandler | Maintain | Overweight | 2025-11-21 |
| Jefferies | Maintain | Buy | 2025-11-21 |
| Wedbush | Maintain | Outperform | 2025-11-21 |
| Guggenheim | Maintain | Buy | 2025-11-21 |
Elastic N.V. has maintained generally positive ratings, with multiple firms holding Buy, Overweight, and Outperform grades, and no recent downgrades noted.
Which company has the best grades?
Elastic N.V. clearly holds stronger and more stable grades compared to Informatica Inc., which has experienced several downgrades. For investors, this suggests Elastic may be viewed more favorably in terms of growth potential or risk profile by financial analysts.
Strengths and Weaknesses
Below is a comparison of key strengths and weaknesses of Informatica Inc. (INFA) and Elastic N.V. (ESTC) based on the latest available data.
| Criterion | Informatica Inc. (INFA) | Elastic N.V. (ESTC) |
|---|---|---|
| Diversification | Strong subscription revenue (~$1.1B in 2024); mix of professional services and licenses | High subscription revenue growth ($1.38B in 2025); growing professional services but less diversified beyond core offerings |
| Profitability | Data unavailable for detailed profitability analysis | Negative net margin (-7.29%) and ROIC (-11.8%) indicate unprofitable operations |
| Innovation | No recent data on innovation metrics | Showing growing ROIC trend, indicating improving operational efficiency despite current losses |
| Global presence | Established, but detailed data missing | Global presence supported by increasing revenues and subscription growth |
| Market Share | Data not available | Market share not quantified; high valuation metrics (P/B 9.64) suggest premium positioning but risk |
Key takeaways: Informatica benefits from a solid subscription base and diversified revenue streams, but lacks recent financial data for full assessment. Elastic shows strong subscription growth and improving operational trends, yet struggles with current profitability and value destruction. Investors should weigh growth potential against profitability risks.
Risk Analysis
The table below summarizes key risk metrics for Informatica Inc. (INFA) and Elastic N.V. (ESTC) based on the most recent data from 2025 and 2026.
| Metric | Informatica Inc. (INFA) | Elastic N.V. (ESTC) |
|---|---|---|
| Market Risk | Beta 1.14 (moderate) | Beta 0.97 (lower volatility) |
| Debt level | Data not available | Debt-to-Equity 0.64 (neutral) |
| Regulatory Risk | US-based, moderate | US-based, moderate |
| Operational Risk | Established, 5200 staff | Smaller scale, 3400 staff |
| Environmental Risk | Moderate, tech sector | Moderate, tech sector |
| Geopolitical Risk | US focus, moderate | US focus, moderate |
Informatica shows moderate market risk with limited financial data, posing some uncertainty. Elastic’s financials reveal neutral debt levels but unfavorable profitability and coverage ratios, increasing financial risk. Market volatility and operational scale differences are the primary risks to monitor closely.
Which Stock to Choose?
Informatica Inc. (INFA) shows a favorable income statement with strong gross and EBIT margins, modest revenue growth, and improving profitability. Its financial ratios indicate moderate debt levels with a current ratio near 1.8, and its Altman Z-Score places it in the grey zone, suggesting moderate financial risk.
Elastic N.V. (ESTC) presents a favorable income trend with high revenue growth but struggles with negative net margins and returns. Its financial ratios are mixed—about 43% favorable and 43% unfavorable—with a very favorable rating but signs of value destruction. The Altman Z-Score in the safe zone indicates lower bankruptcy risk despite profitability challenges.
For investors, ESTC’s strong revenue growth and improving ROIC might appeal to those pursuing growth strategies despite risks, whereas INFA’s stable profitability and moderate risk could be more suitable for investors seeking a balance between growth and financial stability. The choice may depend on individual risk tolerance and investment focus.
Disclaimer: Investment carries a risk of loss of initial capital. The past performance is not a reliable indicator of future results. Be sure to understand risks before making an investment decision.
Go Further
I encourage you to read the complete analyses of Informatica Inc. and Elastic N.V. to enhance your investment decisions: