Informatica Inc. and Domo, Inc. are two prominent players in the data software industry, each offering innovative platforms that empower businesses to harness data effectively. While Informatica focuses on enterprise-scale data integration and management across multi-cloud environments, Domo specializes in cloud-based business intelligence and real-time data access. This comparison will help investors understand which company presents a more compelling opportunity in the evolving data technology landscape. Let’s explore which stock could best enhance your portfolio.
Table of contents
Companies Overview
I will begin the comparison between Informatica Inc. and Domo, Inc. by providing an overview of these two companies and their main differences.
Informatica Inc. Overview
Informatica Inc. develops an AI-powered platform that unifies and manages data across multi-cloud and hybrid systems at enterprise scale. Its suite includes data integration, API management, data quality, master data management, and governance products designed to deliver accurate, comprehensive data for analytics and compliance. Founded in 1993, Informatica is a major player in the software infrastructure industry, headquartered in Redwood City, CA, with a market cap of $7.5B.
Domo, Inc. Overview
Domo, Inc. operates a cloud-based business intelligence platform that connects all organizational levels with real-time data and insights accessible via smartphones. Serving clients in the US, Japan, and internationally, Domo focuses on application software to enhance business management through data. Founded in 2010 and based in American Fork, UT, it has a smaller market cap of $334M and employs under 1,000 people.
Key similarities and differences
Both companies operate in the technology sector but target different niches: Informatica specializes in infrastructure software centered on data integration and management for enterprises, while Domo provides application software focused on business intelligence and real-time data access. Informatica has a significantly larger market capitalization and workforce, reflecting a broader enterprise focus, whereas Domo emphasizes cloud-based, user-accessible analytics solutions with a lighter organizational scale.
Income Statement Comparison
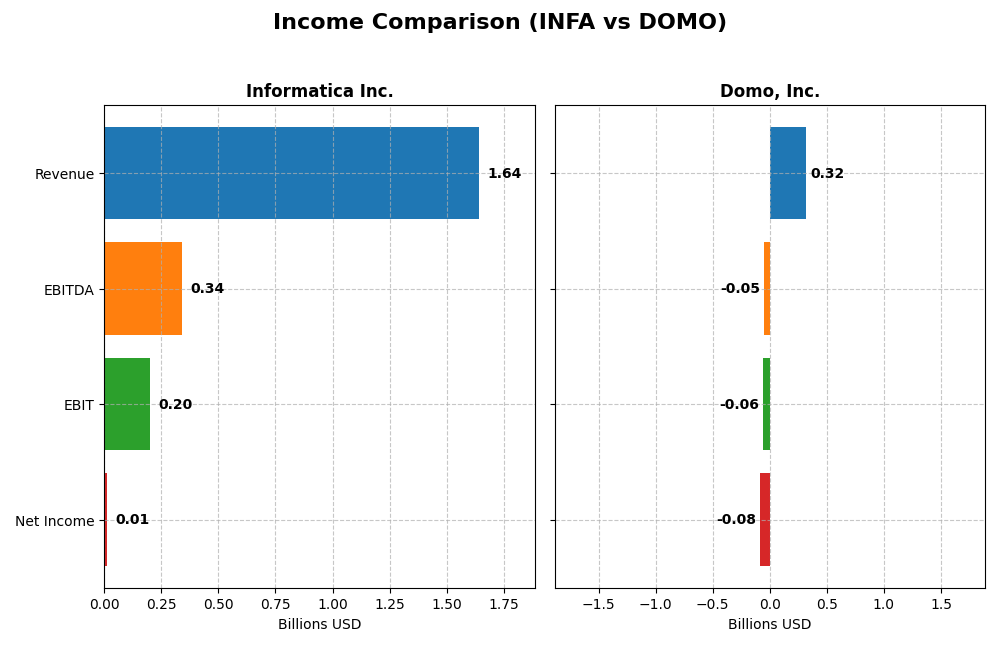
The table below compares key income statement metrics for Informatica Inc. and Domo, Inc. for their most recent fiscal year, highlighting differences in revenue, profitability, and earnings per share.
| Metric | Informatica Inc. (INFA) | Domo, Inc. (DOMO) |
|---|---|---|
| Market Cap | 7.5B | 334M |
| Revenue | 1.64B | 317M |
| EBITDA | 339M | -50M |
| EBIT | 199M | -59M |
| Net Income | 9.9M | -82M |
| EPS | 0.033 | -2.13 |
| Fiscal Year | 2024 | 2025 |
Income Statement Interpretations
Informatica Inc.
Informatica’s revenue grew steadily from 1.32B in 2020 to 1.64B in 2024, reflecting a 23.95% overall increase. Net income improved markedly from a loss of 168M in 2020 to a positive 9.9M in 2024. Gross and EBIT margins remained favorable around 80% and 12%, respectively, with net margin improving to 0.61%. The latest year showed slower revenue growth but significant EBIT and net margin gains.
Domo, Inc.
Domo’s revenue increased from 210M in 2021 to about 317M in 2025, a 50.84% rise over the period. Despite this, net income remained negative, with a loss of 82M in 2025, slightly improved from prior years. Gross margin held favorably at 74.45%, but EBIT and net margins remained unfavorable at -18.7% and -25.84%, respectively. The most recent year saw a slight revenue decline and worsening profitability metrics.
Which one has the stronger fundamentals?
Informatica exhibits stronger fundamentals with consistent revenue growth, positive turn to net income, and improving margins, supported by favorable income statement evaluations. Domo, while growing revenue impressively, struggles with persistent losses and unfavorable EBIT and net margins. Overall, Informatica’s income statement reflects more stability and profitability compared to Domo’s ongoing challenges.
Financial Ratios Comparison
The table below presents a comparison of key financial ratios for Informatica Inc. and Domo, Inc. based on their most recent fiscal year data, reflecting profitability, liquidity, leverage, efficiency, and dividend metrics.
| Ratios | Informatica Inc. (2024) | Domo, Inc. (2025) |
|---|---|---|
| ROE | 0.43% | 46.23% |
| ROIC | 0.56% | 197.65% |
| P/E | 788 | -3.98 |
| P/B | 3.39 | -1.84 |
| Current Ratio | 1.82 | 0.56 |
| Quick Ratio | 1.82 | 0.56 |
| D/E | 0.81 | -0.76 |
| Debt-to-Assets | 35.2% | 63.2% |
| Interest Coverage | 0.87 | -2.99 |
| Asset Turnover | 0.31 | 1.48 |
| Fixed Asset Turnover | 8.75 | 8.17 |
| Payout ratio | 0.12% | 0% |
| Dividend yield | 0.00015% | 0% |
Interpretation of the Ratios
Informatica Inc.
Informatica shows mixed financial health with a current ratio of 1.82, indicating reasonable short-term liquidity, but very low returns on assets (0.19%) and equity (0.43%) suggest weak profitability. The company’s free cash flow to equity remains negative, signaling potential cash flow concerns. Informatica does not pay dividends, likely reflecting a reinvestment focus or ongoing growth strategy.
Domo, Inc.
Domo exhibits strong return metrics such as a 46.23% ROE and a 197.65% ROIC, but suffers from a negative net margin of -25.84%, indicating unprofitable operations. Liquidity ratios are weak, with a current ratio of 0.56, and interest coverage is negative, raising solvency concerns. Domo pays no dividends, consistent with its high growth phase and prioritization of reinvestment.
Which one has the best ratios?
Domo presents a polarized profile with robust profitability ratios but weak liquidity and negative margins, while Informatica shows modest liquidity but very low profitability and negative free cash flow. Both companies do not distribute dividends and face distinct challenges, resulting in a neutral overall ratio assessment.
Strategic Positioning
This section compares the strategic positioning of Informatica Inc. and Domo, Inc., focusing on market position, key segments, and exposure to technological disruption:
Informatica Inc.
- Large market cap around 7.5B USD with moderate beta, operating in software infrastructure on NYSE.
- Key business drivers are enterprise-scale AI-powered data management and integration, with strong subscription revenue exceeding 1B USD.
- Platform integrates multiple interoperable data management products, likely reducing disruption risk via diversified AI and governance tools.
Domo, Inc.
- Smaller market cap near 334M USD, higher beta, focusing on software applications listed on NASDAQ.
- Cloud-based business intelligence platform with subscription revenue around 286M USD, serving global markets.
- Focused on real-time data insights and mobile management, exposed to fast-evolving cloud BI technology trends.
Informatica Inc. vs Domo, Inc. Positioning
Informatica leverages a diversified, AI-driven data management platform targeting enterprise clients, offering stability from broad service suites. Domo concentrates on cloud BI with a mobile-first approach, providing agility but with narrower business scope and smaller scale.
Which has the best competitive advantage?
Domo’s MOAT evaluation reveals a very favorable durable competitive advantage with a growing ROIC significantly above WACC, indicating efficient capital use and increasing profitability. Informatica’s MOAT data is unavailable for comparison.
Stock Comparison
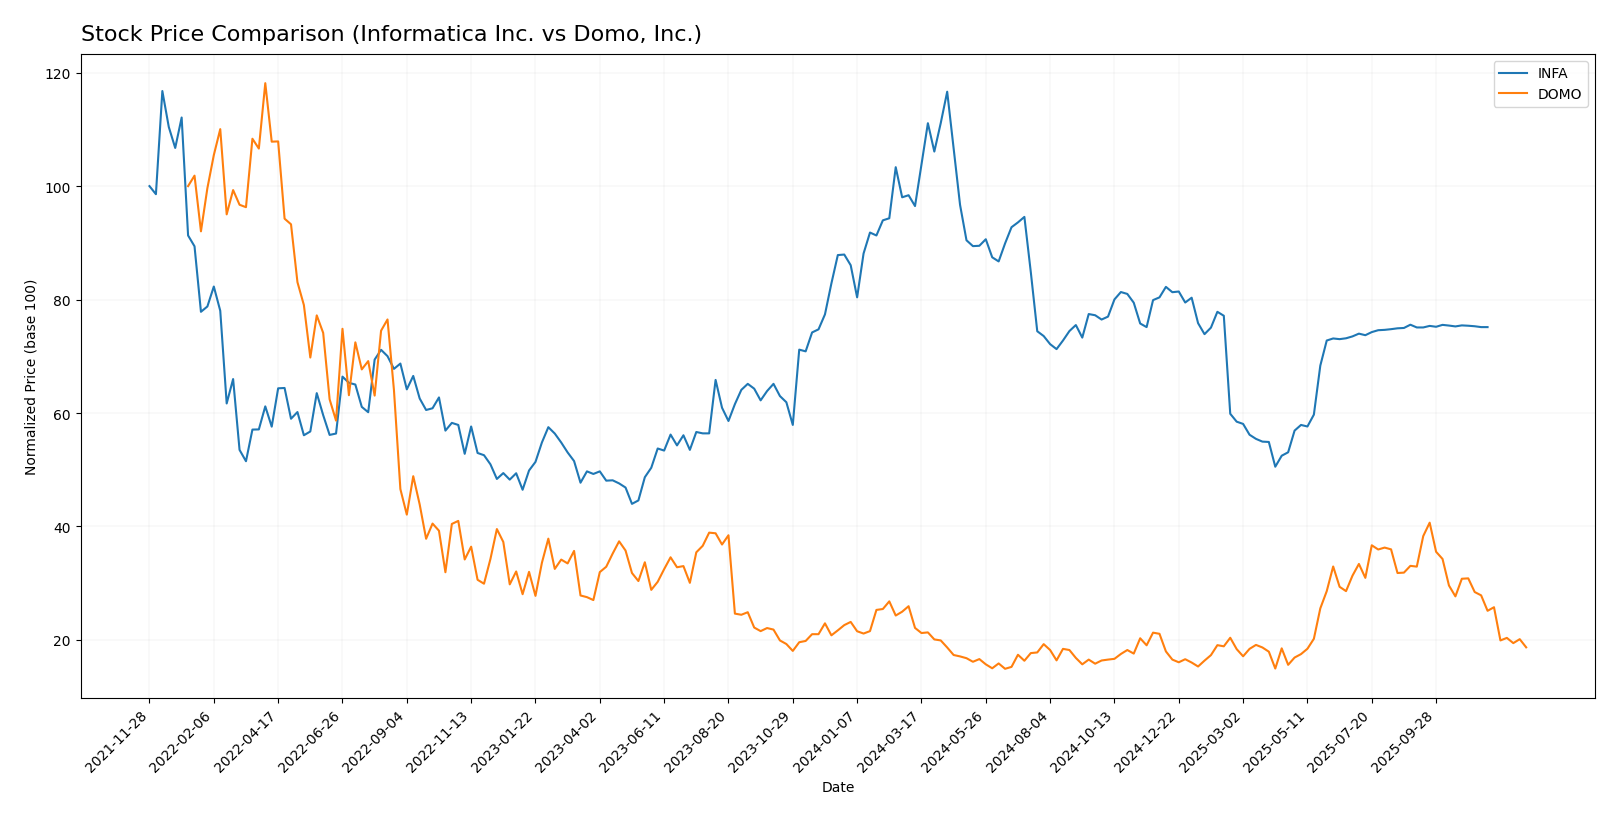
The stock price movements over the past 12 months reveal distinct bearish trends for both Informatica Inc. and Domo, Inc., with differing acceleration patterns and volatility profiles that highlight varying trading dynamics.
Trend Analysis
Informatica Inc. exhibited a 12.68% price decline over the past year, indicating a bearish trend with accelerating downward momentum. The stock showed notable volatility with a standard deviation of 4.46, ranging from a high of 38.48 to a low of 16.67.
Domo, Inc. experienced a sharper 30.25% price decrease over the same period, confirming a bearish trend accompanied by deceleration. Its price fluctuated between 18.06 and 6.62 with a standard deviation of 2.99, reflecting lower volatility than Informatica.
Comparing the two, Informatica delivered a less severe decline, thus outperforming Domo in market performance over the last 12 months despite both showing bearish trends.
Target Prices
The current analyst consensus suggests clear target prices for both Informatica Inc. and Domo, Inc.
| Company | Target High | Target Low | Consensus |
|---|---|---|---|
| Informatica Inc. | 27 | 27 | 27 |
| Domo, Inc. | 13 | 10 | 11.5 |
Analysts expect Informatica’s stock to hold steady around $27, slightly above its current $24.79 price, indicating moderate upside potential. Domo’s target consensus of $11.5 suggests a significant increase from the current $8.30, reflecting optimism despite higher volatility risk.
Analyst Opinions Comparison
This section compares analysts’ ratings and grades for Informatica Inc. and Domo, Inc.:
Rating Comparison
Informatica Inc. Rating
- No rating data available.
- No Discounted Cash Flow Score available.
- No Return on Equity Score available.
- No Return on Assets Score available.
- No Debt To Equity Score available.
- No Overall Score available.
Domo, Inc. Rating
- Rated C, considered very favorable overall.
- Discounted Cash Flow Score is 1, very unfavorable.
- Return on Equity Score is 5, very favorable.
- Return on Assets Score is 1, very unfavorable.
- Debt To Equity Score is 1, very unfavorable.
- Overall Score is 2, moderate.
Which one is the best rated?
Based solely on the available data, Domo has a defined rating of C with a very favorable overall rating status, while Informatica lacks rating information. Despite some unfavorable scores, Domo is better rated due to the presence of evaluative data.
Scores Comparison
The company scores comparison between Informatica Inc. and Domo, Inc. is as follows:
INFA Scores
- Altman Z-Score: 1.94, indicating a grey zone risk level.
- Piotroski Score: 6, reflecting average financial strength.
DOMO Scores
- Altman Z-Score: -10.04, indicating a distress zone risk.
- Piotroski Score: 3, indicating very weak financial health.
Which company has the best scores?
Based on the provided data, Informatica Inc. has better scores with a grey zone Altman Z-Score and an average Piotroski Score, while Domo shows distress zone risk and very weak Piotroski Score.
Grades Comparison
Here is a comparison of the recent grades assigned to Informatica Inc. and Domo, Inc.:
Informatica Inc. Grades
The following table summarizes recent grades from verified grading companies for Informatica Inc.:
| Grading Company | Action | New Grade | Date |
|---|---|---|---|
| Guggenheim | Downgrade | Neutral | 2025-08-07 |
| UBS | Maintain | Neutral | 2025-08-07 |
| Baird | Maintain | Neutral | 2025-05-28 |
| JP Morgan | Downgrade | Neutral | 2025-05-28 |
| RBC Capital | Maintain | Sector Perform | 2025-05-28 |
| Wolfe Research | Downgrade | Peer Perform | 2025-05-28 |
| Wells Fargo | Maintain | Equal Weight | 2025-05-28 |
| Truist Securities | Downgrade | Hold | 2025-05-28 |
| RBC Capital | Maintain | Sector Perform | 2025-05-27 |
| UBS | Maintain | Neutral | 2025-05-16 |
Informatica’s grades show a pattern of downgrades from previously higher ratings to neutral or hold, with several firms maintaining a neutral or sector perform stance.
Domo, Inc. Grades
The following table presents recent grades from verified grading companies for Domo, Inc.:
| Grading Company | Action | New Grade | Date |
|---|---|---|---|
| DA Davidson | Maintain | Neutral | 2025-12-05 |
| TD Cowen | Maintain | Buy | 2025-12-05 |
| Lake Street | Maintain | Hold | 2025-12-05 |
| DA Davidson | Maintain | Neutral | 2025-12-01 |
| JMP Securities | Maintain | Market Outperform | 2025-09-10 |
| DA Davidson | Maintain | Neutral | 2025-08-28 |
| Cantor Fitzgerald | Maintain | Overweight | 2025-08-28 |
| TD Cowen | Upgrade | Buy | 2025-08-26 |
| JMP Securities | Maintain | Market Outperform | 2025-06-25 |
| Cantor Fitzgerald | Maintain | Overweight | 2025-06-25 |
Domo, Inc.’s grades reflect stability with mostly maintained ratings and some upgrades, including consistent market outperform and buy ratings.
Which company has the best grades?
Domo, Inc. has generally received better grades than Informatica Inc., with more buy and outperform ratings and fewer downgrades. This suggests a relatively more positive analyst outlook, which may influence investor sentiment and portfolio positioning.
Strengths and Weaknesses
Below is a comparison of the key strengths and weaknesses of Informatica Inc. and Domo, Inc. based on their latest available financial and strategic data.
| Criterion | Informatica Inc. (INFA) | Domo, Inc. (DOMO) |
|---|---|---|
| Diversification | Strong subscription revenue base (over $1.1B in 2024) with professional services complementing; diverse product offerings in cloud and on-premise | Mainly subscription-based with smaller professional services; less diversified product range |
| Profitability | Data unavailable for precise profitability metrics | ROIC very high at 198%, ROE favorable at 46%, but net margin negative (-25.8%) indicating current operating losses |
| Innovation | Established player with broad enterprise data management solutions | Demonstrates durable competitive advantage and growing profitability potential, indicating strong innovation focus |
| Global presence | Historically global, but recent data limited | Global footprint supported by subscription growth and market presence |
| Market Share | Significant due to long-standing industry position | Smaller market share relative to industry giants but rapidly growing subscription revenues |
Key takeaways: Informatica shows strong diversification and market presence but lacks recent financial data for thorough profitability analysis. Domo excels in innovation and efficient capital use with a very favorable competitive moat, though it currently struggles with profitability and liquidity ratios. Investors should weigh Domo’s growth potential against its short-term financial risks.
Risk Analysis
Below is a comparison table highlighting key risk factors for Informatica Inc. (INFA) and Domo, Inc. (DOMO) based on the most recent available data in 2026.
| Metric | Informatica Inc. (INFA) | Domo, Inc. (DOMO) |
|---|---|---|
| Market Risk | Moderate beta 1.135, stable market cap 7.5B | Higher beta 1.774, smaller cap 334M, more volatile |
| Debt level | Data unavailable for 2025 | High debt to assets 63.23%, poor interest coverage (-2.99) |
| Regulatory Risk | Standard technology sector risks | Standard technology sector risks |
| Operational Risk | Large scale, 5200 employees, stable platform | Smaller scale, 888 employees, higher operational leverage |
| Environmental Risk | Typical for software infrastructure | Typical for software application |
| Geopolitical Risk | US-based with some international exposure | US-based with international operations |
Informatica’s risks are moderate with a stable market presence but lack recent detailed financial ratio data. Domo presents significant financial distress signals with a very low Altman Z-score (distress zone) and weak Piotroski score, indicating high bankruptcy risk. Its market volatility and high leverage are the most impactful risks to consider in investment decisions.
Which Stock to Choose?
Informatica Inc. (INFA) shows a generally favorable income statement with improving profitability, including a gross margin above 80% and a 107% net margin growth over five years. Its financial stability is moderate, with a current ratio near 1.8 and a net debt to EBITDA of 2.8, while scores place it in a grey zone for bankruptcy risk and an average Piotroski score.
Domo, Inc. (DOMO) displays an unfavorable income statement with a negative net margin of -25.84% and declining recent revenue growth, despite strong returns on equity and invested capital. Financial ratios are mixed, with half favorable and half unfavorable, a low current ratio of 0.56, and a distress zone Altman Z-score coupled with a very weak Piotroski score.
Investors focused on growth and competitive advantage might view DOMO’s very favorable moat and high ROIC as attractive, while those prioritizing income statement strength and moderate financial risk could find INFA’s improving profitability and balanced financials more aligned with their profile.
Disclaimer: Investment carries a risk of loss of initial capital. The past performance is not a reliable indicator of future results. Be sure to understand risks before making an investment decision.
Go Further
I encourage you to read the complete analyses of Informatica Inc. and Domo, Inc. to enhance your investment decisions: