In today’s dynamic tech landscape, indie Semiconductor, Inc. (INDI) and Ouster, Inc. (OUST) stand out as innovators driving advancements in automotive and sensing technologies. Both companies operate in overlapping markets focused on cutting-edge hardware and software solutions, from automotive semiconductors to high-resolution lidar sensors. This comparison will help you understand which company presents the most compelling investment opportunity in 2026. Let’s dive into their strengths and growth potential.
Table of contents
Companies Overview
I will begin the comparison between indie Semiconductor and Ouster by providing an overview of these two companies and their main differences.
indie Semiconductor Overview
indie Semiconductor, Inc. focuses on automotive semiconductors and software solutions, specializing in advanced driver assistance systems, connected car technologies, and electrification applications. The company serves diverse automotive needs including parking assistance, infotainment, and telematics. Founded in 2007, indie Semiconductor is headquartered in Aliso Viejo, California, and operates with about 920 employees in the technology sector.
Ouster Overview
Ouster, Inc. designs and manufactures high-resolution digital lidar sensors and related software that provide 3D vision capabilities for machinery, vehicles, robots, and infrastructure. Its product lineup includes scanning and solid-state flash sensors. Established more recently, Ouster is based in San Francisco, California, employs approximately 292 staff, and operates within the hardware, equipment, and parts industry of the technology sector.
Key similarities and differences
Both indie Semiconductor and Ouster operate in the US technology sector with a focus on innovative hardware and software solutions. While indie Semiconductor targets automotive semiconductor applications and connectivity, Ouster specializes in lidar sensor technology for 3D vision. The companies differ in scale, with indie Semiconductor employing roughly three times as many people and operating in semiconductors, whereas Ouster’s narrower focus is on hardware sensors and equipment.
Income Statement Comparison
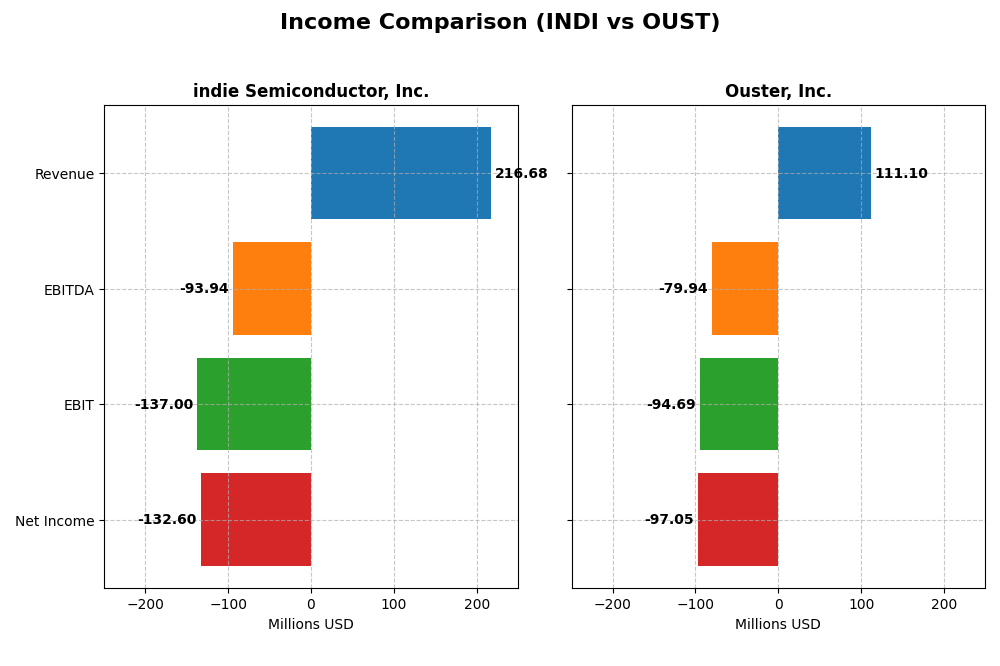
This table presents a side-by-side comparison of key income statement metrics for indie Semiconductor, Inc. and Ouster, Inc. for the fiscal year 2024.
| Metric | indie Semiconductor, Inc. | Ouster, Inc. |
|---|---|---|
| Market Cap | 750M | 1.4B |
| Revenue | 217M | 111M |
| EBITDA | -94M | -80M |
| EBIT | -137M | -95M |
| Net Income | -133M | -97M |
| EPS | -0.76 | -2.08 |
| Fiscal Year | 2024 | 2024 |
Income Statement Interpretations
indie Semiconductor, Inc.
indie Semiconductor’s revenue grew significantly over 2020-2024, reaching $217M in 2024, though it slightly declined by 2.9% in the latest year. Net income remained negative throughout, at -$133M in 2024, with net margins at -61.2%. Gross margin improved favorably to 41.7%, yet EBIT and net margins showed continued losses, indicating ongoing operational challenges despite some margin progress.
Ouster, Inc.
Ouster reported steady revenue growth, reaching $111M in 2024, with a strong 33.4% increase year-over-year. Net losses narrowed to -$97M in 2024, improving net margin to -87.4%. The gross margin remained solid at 36.4%, and EBIT losses decreased substantially. Overall, Ouster’s margins and profitability showed marked improvement, reflecting operational scaling and expense management progress.
Which one has the stronger fundamentals?
Comparing fundamentals, Ouster presents a more favorable income statement profile, with higher year-over-year growth rates across revenue, gross profit, and net income, alongside margin improvements. indie Semiconductor shows robust revenue growth over the longer term but struggles with persistent losses and unfavorable EBIT and net margins. Ouster’s stronger margin recovery and growth momentum suggest relatively healthier fundamentals.
Financial Ratios Comparison
The table below compares the most recent financial ratios for indie Semiconductor, Inc. (INDI) and Ouster, Inc. (OUST) as of fiscal year 2024.
| Ratios | indie Semiconductor, Inc. (INDI) | Ouster, Inc. (OUST) |
|---|---|---|
| ROE | -31.7% | -53.6% |
| ROIC | -19.3% | -50.8% |
| P/E | -5.35 | -5.87 |
| P/B | 1.70 | 3.15 |
| Current Ratio | 4.82 | 2.80 |
| Quick Ratio | 4.23 | 2.59 |
| D/E | 0.95 | 0.11 |
| Debt-to-Assets | 42.3% | 7.33% |
| Interest Coverage | -18.4 | -57.1 |
| Asset Turnover | 0.23 | 0.40 |
| Fixed Asset Turnover | 4.30 | 4.54 |
| Payout ratio | 0 | 0 |
| Dividend yield | 0 | 0 |
Interpretation of the Ratios
indie Semiconductor, Inc.
indie Semiconductor shows mostly unfavorable ratios, including a negative net margin of -61.2% and a return on equity of -31.73%, indicating weak profitability and returns. The company has a high current ratio of 4.82 but this is considered unfavorable, suggesting inefficient asset use. No dividends are paid, reflecting either reinvestment priorities or lack of earnings for distributions.
Ouster, Inc.
Ouster’s ratios also reveal significant challenges with a net margin of -87.35% and a return on equity at -53.64%, both unfavorable. However, its liquidity ratios are favorable, such as a current ratio of 2.8 and low debt levels, reflecting better short-term financial health. The firm does not pay dividends, likely due to ongoing investment needs or losses.
Which one has the best ratios?
Neither company demonstrates strong overall financial health, as both have unfavorable profitability and return ratios. Ouster holds a slight edge in liquidity and leverage metrics, while indie Semiconductor has a marginally better price-to-earnings ratio. Overall, both present high risks from a ratio perspective in 2024.
Strategic Positioning
This section compares the strategic positioning of indie Semiconductor, Inc. and Ouster, Inc. focusing on market position, key segments, and exposure to technological disruption:
indie Semiconductor, Inc.
- Competes in semiconductors with NASDAQ listing; faces high competitive pressure
- Focuses on automotive semiconductors and software for advanced driver assistance and connected car applications
- Exposure through photonic components and advanced automotive applications; innovation critical
Ouster, Inc.
- Operates in hardware and equipment with higher market cap; also NASDAQ listed
- Specializes in high-resolution digital lidar sensors and enabling software for 3D vision
- Exposure via advanced lidar sensor technology and software integration for various machinery
indie Semiconductor, Inc. vs Ouster, Inc. Positioning
indie Semiconductor has a diversified focus on automotive semiconductor products and services, whereas Ouster concentrates on high-resolution lidar sensor hardware and software. indie’s broader application range contrasts with Ouster’s specialized product portfolio.
Which has the best competitive advantage?
Both companies are shedding value with ROIC below WACC; indie’s ROIC is declining sharply, while Ouster shows improving profitability despite still unfavorable returns. Ouster’s growing ROIC trend suggests a slightly better competitive position.
Stock Comparison
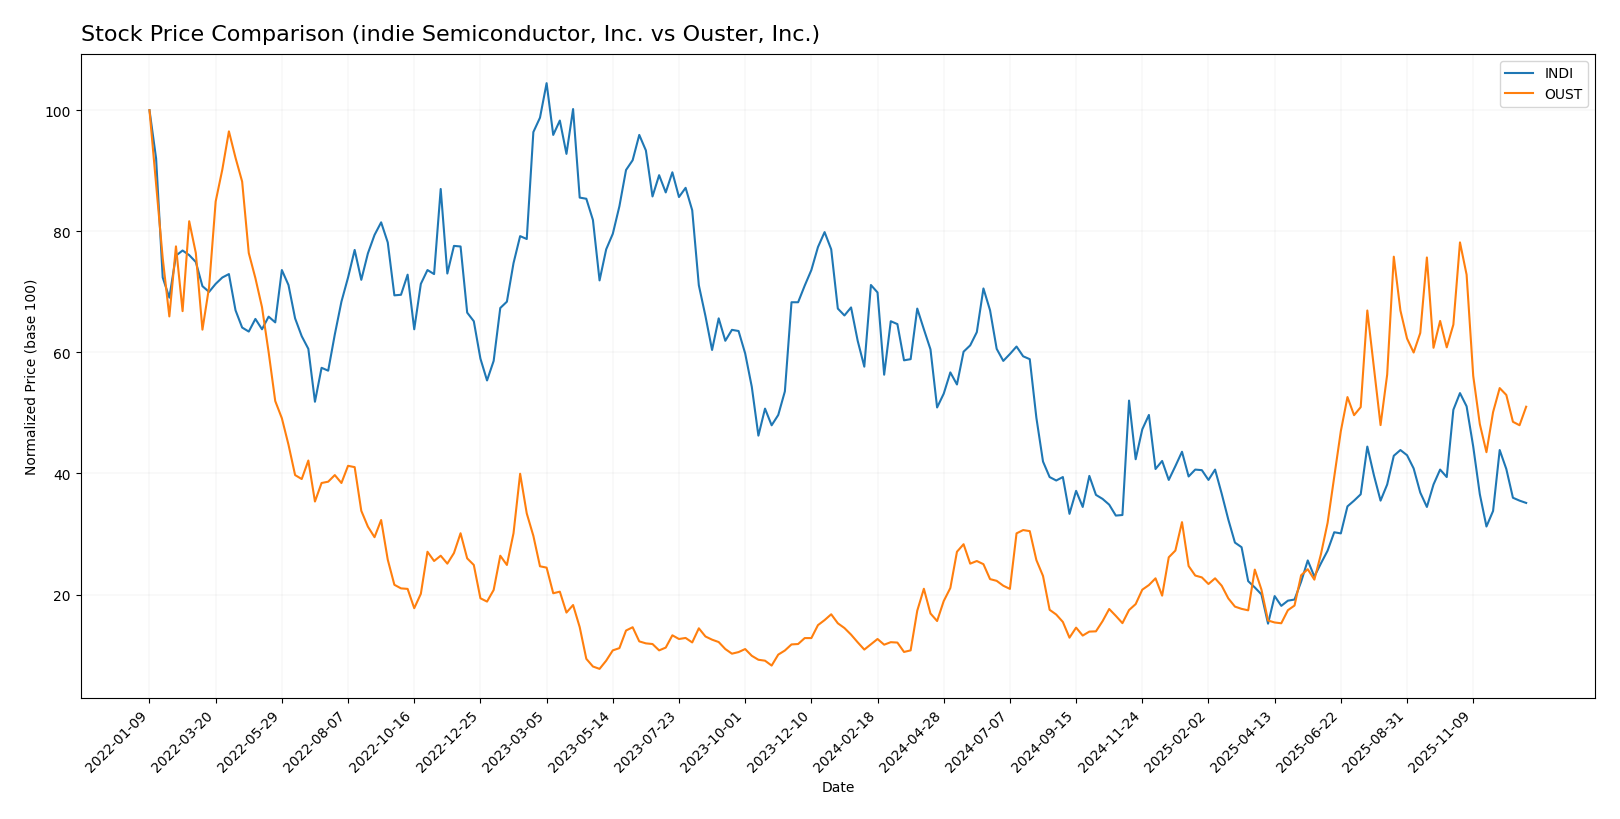
The stock price movements of indie Semiconductor, Inc. (INDI) and Ouster, Inc. (OUST) over the past year reveal contrasting trading dynamics, with INDI experiencing a marked decline while OUST posted strong gains before recent setbacks.
Trend Analysis
indie Semiconductor, Inc. (INDI) shows a bearish trend with a -50.6% price change over the past 12 months, accompanied by deceleration and a moderate volatility level (std deviation 1.42). The stock peaked at 7.49 and bottomed at 1.6.
Ouster, Inc. (OUST) experienced a bullish trend with a 332.78% price increase over the same period, despite deceleration and higher volatility (std deviation 8.51). The stock’s price ranged from a low of 4.82 to a high of 35.8.
Comparing both, OUST delivered the highest market performance with a significant positive gain, whereas INDI showed substantial depreciation over the analyzed 12-month period.
Target Prices
Analyst consensus target prices indicate moderate upside potential for both indie Semiconductor, Inc. and Ouster, Inc.
| Company | Target High | Target Low | Consensus |
|---|---|---|---|
| indie Semiconductor, Inc. | 8 | 8 | 8 |
| Ouster, Inc. | 39 | 33 | 36.67 |
The consensus target prices for indie Semiconductor, Inc. at $8 suggest a strong upside from the current $3.7 stock price. Ouster, Inc.’s targets between $33 and $39 also imply significant growth potential above its current $23.37 price.
Analyst Opinions Comparison
This section compares analysts’ ratings and grades for indie Semiconductor, Inc. and Ouster, Inc.:
Rating Comparison
INDI Rating
- Rating: C, considered very favorable by analysts.
- Discounted Cash Flow Score: 1, very unfavorable.
- ROE Score: 1, very unfavorable efficiency.
- ROA Score: 1, very unfavorable asset utilization.
- Debt To Equity Score: 3, moderate financial risk.
- Overall Score: 2, moderate overall financial health.
OUST Rating
- Rating: C-, also considered very favorable.
- Discounted Cash Flow Score: 1, very unfavorable.
- ROE Score: 1, very unfavorable efficiency.
- ROA Score: 1, very unfavorable asset utilization.
- Debt To Equity Score: 3, moderate financial risk.
- Overall Score: 1, very unfavorable financial health.
Which one is the best rated?
Based strictly on the provided data, indie Semiconductor, Inc. holds a higher overall score (2) compared to Ouster, Inc. (1), indicating a relatively better financial standing despite both having very unfavorable operational efficiency scores.
Scores Comparison
The comparison of scores for indie Semiconductor and Ouster highlights their financial stability and strength:
indie Semiconductor Scores
- Altman Z-Score: 0.14, in distress zone, high bankruptcy risk
- Piotroski Score: 3, very weak financial strength
Ouster Scores
- Altman Z-Score: 3.66, in safe zone, low bankruptcy risk
- Piotroski Score: 4, average financial strength
Which company has the best scores?
Based on the provided data, Ouster has significantly better scores than indie Semiconductor, with a safe-zone Altman Z-Score and average Piotroski Score versus indie’s distress-zone Altman Z-Score and very weak Piotroski Score.
Grades Comparison
Here is a comparison of the recent grades assigned to indie Semiconductor, Inc. and Ouster, Inc.:
indie Semiconductor, Inc. Grades
The table below shows recent grades from established grading companies for indie Semiconductor, Inc.:
| Grading Company | Action | New Grade | Date |
|---|---|---|---|
| UBS | Maintain | Neutral | 2025-11-10 |
| Benchmark | Maintain | Buy | 2025-06-25 |
| Benchmark | Maintain | Buy | 2025-06-11 |
| Benchmark | Maintain | Buy | 2025-05-21 |
| Benchmark | Maintain | Buy | 2025-05-13 |
| Craig-Hallum | Maintain | Buy | 2025-05-13 |
| Keybanc | Maintain | Overweight | 2025-05-13 |
| Benchmark | Maintain | Buy | 2025-04-09 |
| Benchmark | Maintain | Buy | 2025-02-21 |
| Keybanc | Maintain | Overweight | 2025-02-21 |
Overall, indie Semiconductor has consistently received Buy and Overweight ratings, with one Neutral from UBS, indicating generally positive market sentiment.
Ouster, Inc. Grades
The table below shows recent grades from established grading companies for Ouster, Inc.:
| Grading Company | Action | New Grade | Date |
|---|---|---|---|
| Cantor Fitzgerald | Upgrade | Overweight | 2025-11-07 |
| Cantor Fitzgerald | Upgrade | Overweight | 2025-11-06 |
| WestPark Capital | Maintain | Buy | 2025-11-05 |
| Rosenblatt | Maintain | Buy | 2025-11-05 |
| WestPark Capital | Upgrade | Buy | 2025-08-13 |
| Oppenheimer | Maintain | Outperform | 2025-07-16 |
| WestPark Capital | Downgrade | Hold | 2025-06-12 |
| WestPark Capital | Upgrade | Buy | 2025-05-09 |
| Rosenblatt | Maintain | Buy | 2025-03-21 |
| Cantor Fitzgerald | Maintain | Overweight | 2025-03-21 |
Ouster’s grades show a positive trend with several upgrades to Overweight and Buy, alongside a consistent Outperform rating, reflecting improving analyst sentiment.
Which company has the best grades?
Ouster, Inc. has received more upgrades and a wider range of positive ratings including Outperform and Overweight, suggesting stronger analyst confidence compared to indie Semiconductor’s steady Buy and Overweight grades. This divergence could influence investor perception of growth potential and risk profiles.
Strengths and Weaknesses
Below is a comparative overview of key strengths and weaknesses for indie Semiconductor, Inc. (INDI) and Ouster, Inc. (OUST), based on their latest financial and operational data.
| Criterion | indie Semiconductor, Inc. (INDI) | Ouster, Inc. (OUST) |
|---|---|---|
| Diversification | Moderate: Revenue split between Product ($203M) and Service ($14M) | Low: Revenue primarily from Product segment ($111M in 2024) |
| Profitability | Very unfavorable: Negative net margin (-61.2%), ROIC (-19.25%), and declining value creation | Unfavorable: More negative margins (-87.35%), ROIC (-50.84%), but improving profitability trend |
| Innovation | Moderate: Fixed asset turnover favorable (4.3), but declining ROIC signals challenges in value creation | Moderate: Favorable fixed asset turnover (4.54) and growing ROIC trend indicate improving innovation impact |
| Global presence | Limited data; moderate current ratio (4.82) suggests liquidity but operational inefficiencies | Limited data; better liquidity ratios (current ratio 2.8) and lower debt to assets (7.33%) |
| Market Share | Small to moderate, with product revenue growth but overall value destruction | Small market share with revenue growth, but financial losses persist |
Key takeaways: Both companies face significant profitability challenges, with INDI showing severe value destruction and declining returns, while OUST, despite heavier losses, demonstrates signs of improving profitability. Investors should weigh OUST’s recovery potential against INDI’s ongoing financial struggles, considering their modest diversification and innovation capabilities.
Risk Analysis
Below is a comparison of key risks facing indie Semiconductor, Inc. (INDI) and Ouster, Inc. (OUST) based on the most recent data available for 2024:
| Metric | indie Semiconductor, Inc. (INDI) | Ouster, Inc. (OUST) |
|---|---|---|
| Market Risk | High beta (2.59) indicates high volatility and sensitivity to market fluctuations. | Even higher beta (2.99), signaling very high market volatility risk. |
| Debt Level | Moderate debt-to-equity ratio (0.95), neutral risk profile with 42% debt-to-assets. | Low debt-to-equity ratio (0.11), low leverage and financial risk. |
| Regulatory Risk | Moderate, operating in semiconductors with compliance needs in automotive tech. | Moderate, lidar sensors face regulatory scrutiny related to safety and export controls. |
| Operational Risk | Unfavorable profitability and return ratios indicate operational inefficiencies and high costs. | Similar operational risk with deep losses and negative margins, requiring careful cost management. |
| Environmental Risk | Moderate exposure due to semiconductor manufacturing processes and supply chain. | Moderate, given hardware production but less intensive than semiconductor manufacturing. |
| Geopolitical Risk | Medium, U.S.-based but supply chain may involve global components sensitive to trade tensions. | Medium, U.S.-based with potential impact from global trade policies affecting hardware exports. |
The most impactful risks for both companies stem from their negative profitability and operational inefficiencies, which challenge their path to sustainable profitability. INDI’s higher leverage contrasts with OUST’s low debt but both have high market volatility exposure. Investors must carefully consider these financial and market risks before investing.
Which Stock to Choose?
Indie Semiconductor, Inc. (INDI) shows a mixed income evolution with a favorable gross margin of 41.68% but an unfavorable net margin of -61.2%. Its financial ratios are mostly unfavorable, including a negative return on equity of -31.73% and weak interest coverage, while its current ratio is high at 4.82. The company has moderate debt levels and holds a very favorable overall rating despite challenges in profitability and value creation.
Ouster, Inc. (OUST) exhibits favorable income growth with a 33.41% revenue increase and a gross margin of 36.42%, though it suffers from a negative net margin of -87.35%. Its financial ratios present a split picture: favorable liquidity and low debt, but poor profitability metrics such as a return on equity of -53.64%. The company’s rating is also very favorable, but it faces significant value destruction despite an improving ROIC trend.
Considering the ratings and overall financial evaluations, INDI’s moderate rating and very unfavorable value creation contrast with OUST’s very unfavorable rating but improving profitability. Investors with a risk-tolerant or growth-focused approach may find OUST’s improving income growth and ROIC trend more appealing, whereas those seeking moderate stability might view INDI’s mixed but steadier financial profile as more appropriate.
Disclaimer: Investment carries a risk of loss of initial capital. The past performance is not a reliable indicator of future results. Be sure to understand risks before making an investment decision.
Go Further
I encourage you to read the complete analyses of indie Semiconductor, Inc. and Ouster, Inc. to enhance your investment decisions: