Home > Comparison > Healthcare > VRTX vs INCY
The strategic rivalry between Vertex Pharmaceuticals and Incyte Corporation shapes the biotechnology sector’s innovation frontier. Vertex operates as a capital-intensive biotech leader focused on cystic fibrosis therapies, while Incyte pursues a diversified biopharmaceutical model targeting oncology and rare diseases. This head-to-head reflects a clash between specialized pipeline depth and broader therapeutic reach. This analysis aims to identify which company offers superior risk-adjusted returns for a diversified healthcare portfolio in 2026.
Table of contents
Companies Overview
Vertex Pharmaceuticals and Incyte Corporation shape critical niches within biotechnology, driving innovation in specialty therapies.
Vertex Pharmaceuticals Incorporated: Leader in Cystic Fibrosis Therapies
Vertex dominates cystic fibrosis treatment, generating revenue primarily through branded therapies like TRIKAFTA and ORKAMBI. Its strategic focus in 2026 centers on advancing a diversified clinical pipeline, including treatments for kidney diseases and diabetes. Vertex’s specialty pharmacy distribution model underpins its strong market position and high-margin revenue streams.
Incyte Corporation: Specialist in Oncology and Immune Disorders
Incyte excels as a biopharmaceutical developer focused on proprietary oncology and immunology drugs such as JAKAFI and PEMAZYRE. Its 2026 strategy emphasizes expanding clinical trials for next-generation therapies targeting cancers and graft-versus-host disease. Incyte’s collaboration network supports its growth in niche, high-need therapeutic areas.
Strategic Collision: Similarities & Divergences
Both companies invest heavily in innovative drug pipelines with a focus on specialty and rare diseases. Vertex leans into a concentrated franchise for cystic fibrosis, while Incyte pursues a broader oncology and immunology portfolio. Their primary battleground is specialty drug innovation and market penetration. Vertex offers a more stable revenue base; Incyte presents higher clinical-risk, higher-reward investment characteristics.
Income Statement Comparison
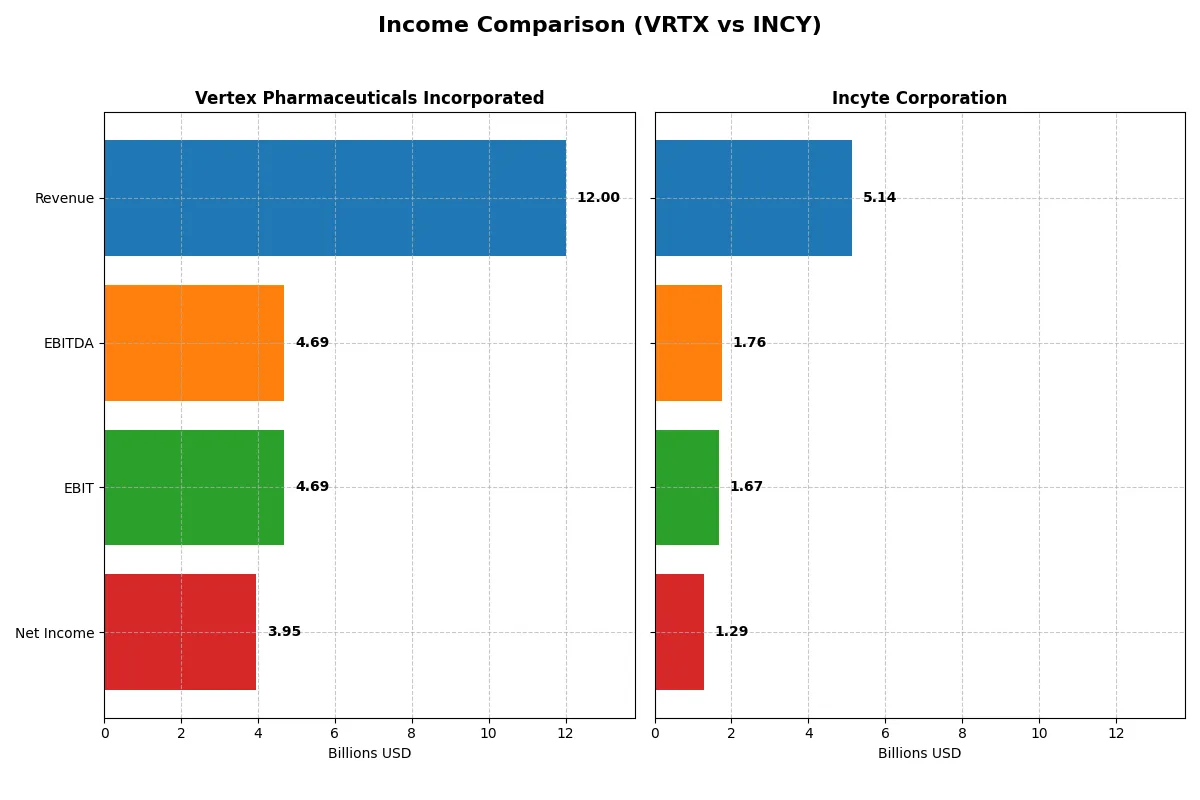
This data dissects the core profitability and scalability of both corporate engines to reveal who dominates the bottom line:
| Metric | Vertex Pharmaceuticals Incorporated (VRTX) | Incyte Corporation (INCY) |
|---|---|---|
| Revenue | 12B | 5.14B |
| Cost of Revenue | 1.63B | 439M |
| Operating Expenses | 5.68B | 3.36B |
| Gross Profit | 10.35B | 4.7B |
| EBITDA | 4.69B | 1.76B |
| EBIT | 4.69B | 1.67B |
| Interest Expense | 13.3M | 2.43M |
| Net Income | 3.95B | 1.29B |
| EPS | 15.46 | 6.59 |
| Fiscal Year | 2025 | 2025 |
Income Statement Analysis: The Bottom-Line Duel
This income statement comparison reveals which company manages its resources most efficiently to generate sustainable profits and shareholder value.
Vertex Pharmaceuticals Incorporated Analysis
Vertex’s revenue rose steadily from 7.6B in 2021 to 12B in 2025, reflecting robust growth. Net income surged from 2.3B in 2021 to 3.95B in 2025, showing strong profitability momentum. The company maintains healthy gross (86%) and net margins (33%), signaling excellent cost control and operational efficiency in 2025.
Incyte Corporation Analysis
Incyte’s revenue expanded sharply from 3B in 2021 to 5.1B in 2025, marking impressive top-line growth. Net income improved from 948M in 2021 to 1.29B in 2025, but net margin dropped to 25%, indicating some margin pressure. Despite a favorable gross margin (91%), rising expenses slightly constrained bottom-line efficiency in the latest year.
Margin Power vs. Revenue Scale
Vertex leads with superior margin stability and larger net income, benefiting from strong operational leverage. Incyte shows faster revenue growth but struggles to maintain net margin strength. For investors prioritizing consistent profitability, Vertex’s profile offers a more attractive balance of scale and efficiency.
Financial Ratios Comparison
These vital ratios act as a diagnostic tool to expose the underlying fiscal health, valuation premiums, and capital efficiency of the companies compared:
| Ratios | Vertex Pharmaceuticals (VRTX) | Incyte Corporation (INCY) |
|---|---|---|
| ROE | 21.2% | 24.9% |
| ROIC | 18.3% | 20.6% |
| P/E | 29.3 | 15.0 |
| P/B | 6.21 | 3.73 |
| Current Ratio | 2.90 | 3.32 |
| Quick Ratio | 2.46 | 3.25 |
| D/E | 0.20 | 0.01 |
| Debt-to-Assets | 14.4% | 1.0% |
| Interest Coverage | 352.4 | 553.0 |
| Asset Turnover | 0.47 | 0.74 |
| Fixed Asset Turnover | 3.89 | 6.78 |
| Payout ratio | 0 | 0 |
| Dividend yield | 0 | 0 |
| Fiscal Year | 2025 | 2025 |
Efficiency & Valuation Duel: The Vital Signs
Ratios serve as the company’s DNA, unveiling hidden risks and operational excellence critical for investment decisions.
Vertex Pharmaceuticals Incorporated
Vertex delivers strong profitability with a 21.18% ROE and a robust 32.94% net margin, signaling operational efficiency. However, its P/E ratio of 29.32 suggests the stock trades at a premium, reflecting stretched valuation. Vertex reinvests heavily in R&D, supporting future growth but providing no dividend yield.
Incyte Corporation
Incyte shows impressive profitability, boasting a 24.9% ROE and a solid 25.03% net margin. Its P/E of 14.98 indicates a more reasonable valuation compared to Vertex. Incyte balances growth with financial discipline, also lacking dividends but maintaining strong cash flow to fuel R&D investments.
Valuation Discipline vs. Profitability Strength
Both companies exhibit favorable profitability and operational metrics, but Incyte’s lower P/E offers a better valuation cushion. Vertex’s premium price reflects confidence in innovation but increases risk. Incyte suits investors prioritizing balanced risk and reward, while Vertex attracts those betting on growth leadership.
Which one offers the Superior Shareholder Reward?
I compare Vertex Pharmaceuticals (VRTX) and Incyte Corporation (INCY) on distribution and buybacks. Neither pays dividends, emphasizing reinvestment over yield. VRTX’s free cash flow per share stands at $12.49 with zero dividend payout, signaling focus on growth and R&D. INCY’s free cash flow per share is $6.94, also without dividends, but its capital expenditure is substantially lower at $0.30 per share. Both companies execute buybacks, yet VRTX’s higher cash reserves ($45.7 vs. $18.3 per share) and strong operating margins (39% vs. 26%) suggest a more robust capacity for shareholder returns. VRTX’s price-to-free-cash-flow ratio of 36.3 contrasts with INCY’s 14.2, indicating VRTX trades at a premium but reflects higher quality cash generation. Given VRTX’s superior cash flow sustainability and reinvestment model, I find it offers a more attractive total return profile for 2026 investors.
Comparative Score Analysis: The Strategic Profile
The radar chart reveals the fundamental DNA and strategic trade-offs of Vertex Pharmaceuticals and Incyte Corporation, highlighting their financial strengths and valuation nuances:
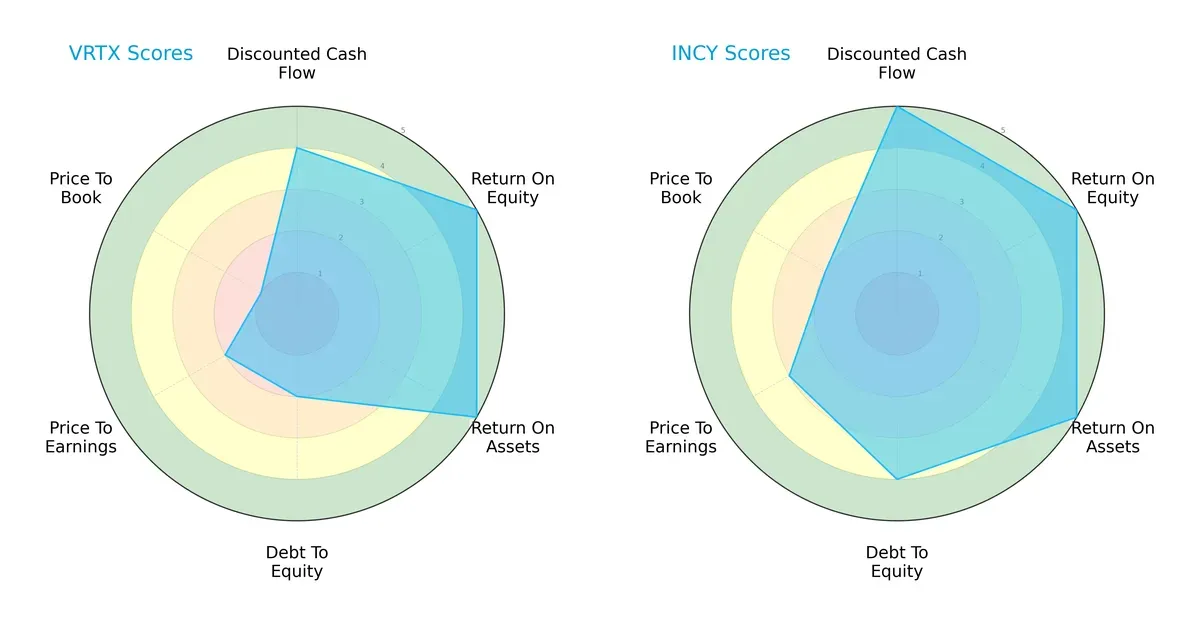
Incyte shows a more balanced profile with top scores across DCF, ROE, ROA, and a solid debt-to-equity position. Vertex excels in profitability metrics but lags materially in debt management and valuation, indicating a reliance on operational efficiency over financial conservatism.
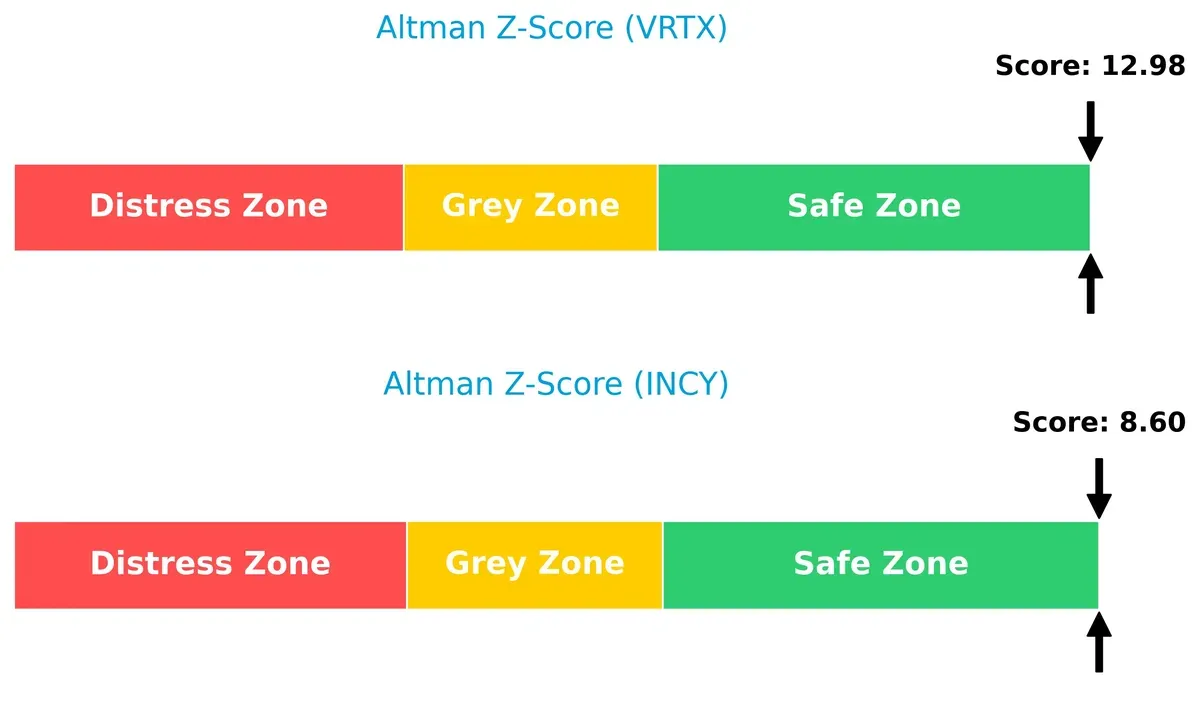
Bankruptcy Risk: Solvency Showdown
The Altman Z-Score gap favors Vertex’s stronger solvency buffer, signaling a safer long-term survival outlook in this volatile biotech cycle:
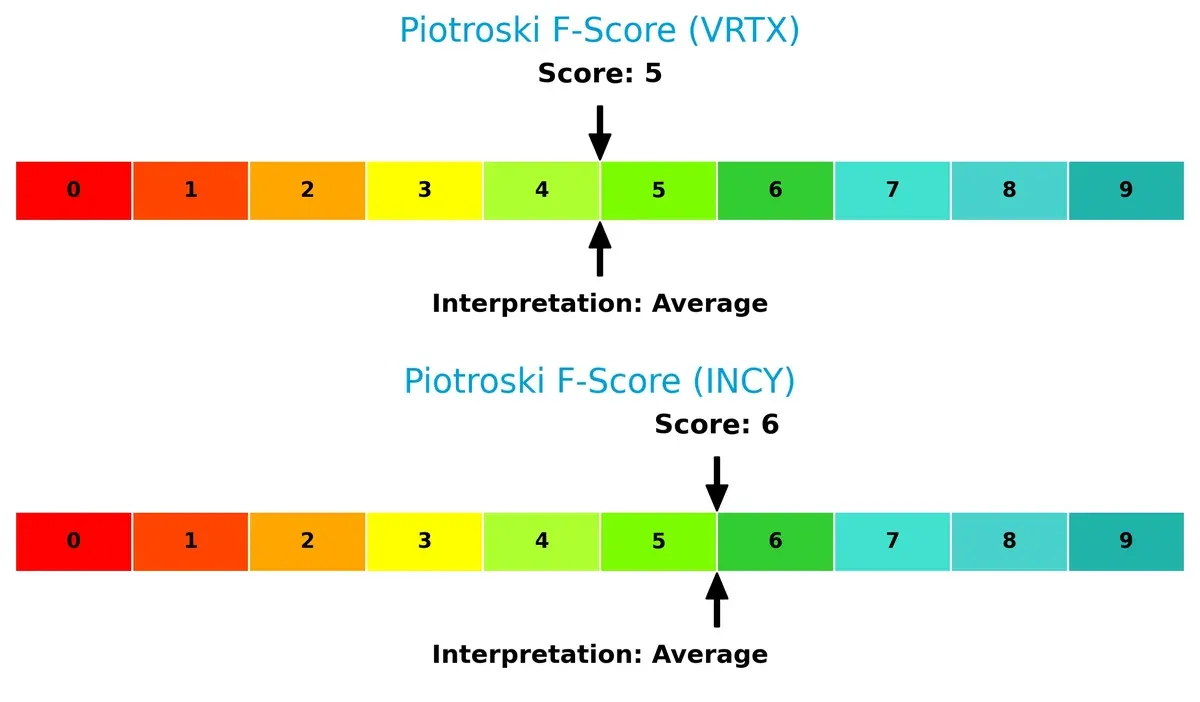
Financial Health: Quality of Operations
Both companies register average Piotroski F-Scores, with Incyte slightly ahead, suggesting marginally better internal financial health and fewer red flags in operational metrics:
How are the two companies positioned?
This section dissects the operational DNA of Vertex and Incyte by comparing their revenue distribution by segment and internal dynamics. The goal is to confront their economic moats and identify which model delivers the most resilient, sustainable competitive advantage today.
Revenue Segmentation: The Strategic Mix
This visual comparison dissects how Vertex Pharmaceuticals and Incyte Corporation diversify their income streams and where their primary sector bets lie:
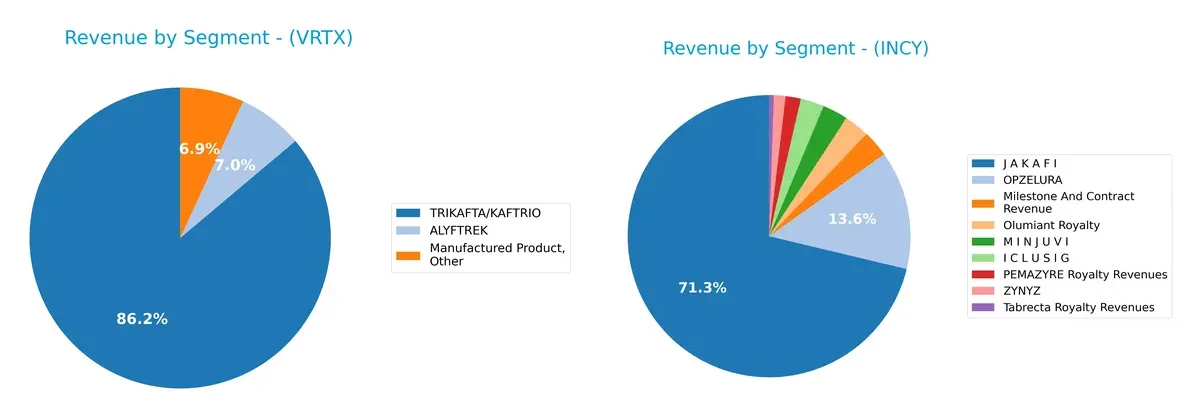
Vertex Pharmaceuticals anchors its 2025 revenue with TRIKAFTA/KAFTRIO at $10.3B, dwarfing ALYFTREK ($838M) and other manufactured products ($820M). This concentration signals heavy reliance on one flagship drug, exposing Vertex to product cycle risks but also demonstrating a moat through specialty innovation. In contrast, Incyte pivots around JAKAFI at $3.55B, but spreads revenue across OPZELURA ($678M), milestone contracts ($150M), and royalties, revealing a more diversified portfolio that cushions against single-segment volatility.
Strengths and Weaknesses Comparison
This table compares the strengths and weaknesses of Vertex Pharmaceuticals Incorporated and Incyte Corporation based on diversification, profitability, financial statements, innovation, global presence, and market share:
VRTX Strengths
- Strong product revenues led by TRIKAFTA/KAFTRIO at $10.3B
- Favorable profitability with 32.9% net margin and 21.2% ROE
- Solid liquidity ratios with current ratio of 2.9
- Diversified geographic sales, $7.5B US and $3.5B Europe
- Low leverage with 0.2 debt-to-equity ratio
- High interest coverage at 352
INCY Strengths
- Favorable ROIC of 20.6% above WACC at 7.6%
- Strong market share with JAKAFI revenue of $3.55B
- Robust interest coverage at 686
- Favorable net margin at 25% and ROE at 24.9%
- Very low debt-to-equity at 0.01
- Quick ratio of 3.25 signals strong short-term liquidity
VRTX Weaknesses
- High P/E at 29.3 and P/B at 6.21 suggests premium valuation
- Asset turnover low at 0.47 indicating less efficient asset use
- No dividend yield, limiting income appeal
- Product concentration risk with TRIKAFTA/KAFTRIO dominating revenue
- No significant diversification beyond key drugs
INCY Weaknesses
- Current ratio at 3.32 marked unfavorable, possible inventory or receivables issue
- P/B at 3.73 considered unfavorable relative to peers
- No dividend yield similar to VRTX
- Geographic sales heavily US-centric with limited Europe exposure
- Some revenue dependence on JAKAFI and OPZELURA products
Both companies exhibit strong profitability and liquidity, but VRTX has greater product concentration risk while INCY shows signs of less efficient balance sheet management. Geographic diversification favors VRTX, highlighting differing strategic focuses.
The Moat Duel: Analyzing Competitive Defensibility
A structural moat protects long-term profits from competition’s relentless erosion. Let’s dissect how these two biotech firms defend their turf:
Vertex Pharmaceuticals Incorporated: Intangible Assets Moat
Vertex’s moat stems from proprietary cystic fibrosis therapies and a robust drug pipeline. Its high ROIC (above WACC by 13.3%) and margin stability reflect this intangible asset strength. Pipeline innovations in rare diseases could deepen its moat, but declining ROIC signals caution in sustaining profitability.
Incyte Corporation: Growing Value Creation Moat
Incyte’s moat relies on innovative oncology drugs and expanding indications, with ROIC exceeding WACC by 13.0% and an improving trend. This contrasts Vertex’s declining ROIC, signaling Incyte’s stronger operational leverage and potential to disrupt markets through clinical-stage assets and collaborations.
Competitive Moats in Biotech: Intangible Assets vs. Dynamic Growth
Vertex holds a wider moat via established therapies, but Incyte’s rising ROIC signals a deeper moat built on growth and innovation. I see Incyte better equipped to defend and expand market share amid biotech competition in 2026.
Which stock offers better returns?
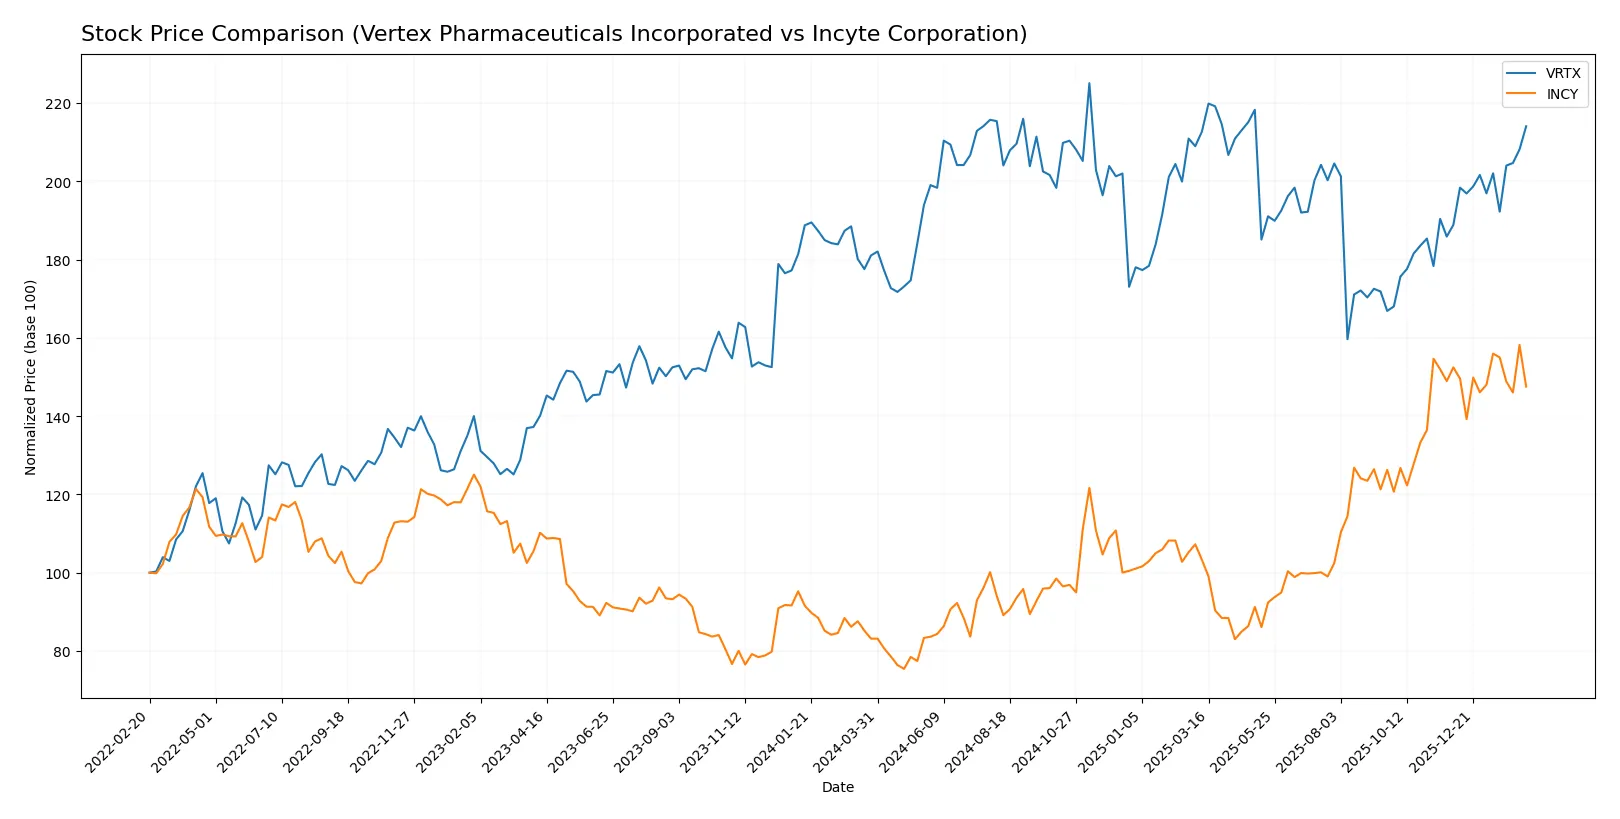
Over the past year, Vertex Pharmaceuticals and Incyte Corporation showed substantial price growth with contrasting trading volume trends and recent shifts in momentum.
Trend Comparison
Vertex Pharmaceuticals posted an 18.24% price increase over the past 12 months, signaling a bullish trend with accelerating momentum and high volatility. The stock price ranged between 366.54 and 516.74.
Incyte Corporation delivered a 77.43% rise in the same period, also bullish but with decelerating momentum and lower volatility. Its price fluctuated from 51.68 to 108.39.
Incyte outperformed Vertex in overall returns despite slowing recent gains, while Vertex’s accelerating trend and strong buyer dominance suggest sustained interest.
Target Prices
Analysts present a moderately bullish consensus on these biotech stocks, reflecting confidence in their pipelines and market positions.
| Company | Target Low | Target High | Consensus |
|---|---|---|---|
| Vertex Pharmaceuticals Incorporated | 466 | 606 | 547.82 |
| Incyte Corporation | 84 | 135 | 108.8 |
The target consensus for Vertex stands about 11% above its current price of 491.47, signaling upside potential. Incyte’s consensus target also suggests roughly 7.5% room for appreciation from 101.1.

Don’t Let Luck Decide Your Entry Point
Optimize your entry points with our advanced ProRealTime indicators. You’ll get efficient buy signals with precise price targets for maximum performance. Start outperforming now!
How do institutions grade them?
The following summarizes institutional grades for Vertex Pharmaceuticals Incorporated and Incyte Corporation:
Vertex Pharmaceuticals Incorporated Grades
Here are the latest grades assigned by notable financial institutions for Vertex Pharmaceuticals Incorporated:
| Grading Company | Action | New Grade | Date |
|---|---|---|---|
| RBC Capital | Maintain | Outperform | 2026-02-13 |
| Stifel | Maintain | Hold | 2026-02-13 |
| Scotiabank | Maintain | Sector Perform | 2026-02-13 |
| Oppenheimer | Upgrade | Outperform | 2026-02-13 |
| HC Wainwright & Co. | Maintain | Buy | 2026-02-13 |
| Barclays | Upgrade | Overweight | 2026-01-28 |
| UBS | Maintain | Buy | 2026-01-26 |
| Evercore ISI Group | Maintain | Outperform | 2026-01-23 |
| RBC Capital | Upgrade | Outperform | 2026-01-22 |
| Bernstein | Upgrade | Outperform | 2026-01-12 |
Incyte Corporation Grades
Below are the recent institutional grades assigned to Incyte Corporation by credible firms:
| Grading Company | Action | New Grade | Date |
|---|---|---|---|
| HC Wainwright & Co. | Maintain | Buy | 2026-02-11 |
| RBC Capital | Maintain | Sector Perform | 2026-02-11 |
| Stifel | Maintain | Buy | 2026-02-11 |
| Wells Fargo | Maintain | Equal Weight | 2026-02-11 |
| Piper Sandler | Maintain | Overweight | 2026-02-06 |
| Barclays | Maintain | Overweight | 2026-02-04 |
| Wells Fargo | Downgrade | Equal Weight | 2026-01-20 |
| TD Cowen | Maintain | Buy | 2026-01-13 |
| Morgan Stanley | Maintain | Equal Weight | 2026-01-06 |
| Wells Fargo | Maintain | Overweight | 2025-12-08 |
Which company has the best grades?
Vertex Pharmaceuticals consistently receives more upgrades and higher grades, including multiple “Outperform” ratings. In contrast, Incyte’s grades are stable but include some downgrades and more “Equal Weight” assessments. This difference may influence investor perception of growth potential and risk in their portfolios.
Risks specific to each company
The following categories identify critical pressure points and systemic threats facing both Vertex Pharmaceuticals and Incyte Corporation in the 2026 market environment:
1. Market & Competition
Vertex Pharmaceuticals Incorporated
- Faces intense competition in cystic fibrosis therapies but benefits from a strong pipeline and partnerships.
Incyte Corporation
- Operates in diverse oncology niches with multiple clinical trials, but competition in hematology-oncology is fierce.
2. Capital Structure & Debt
Vertex Pharmaceuticals Incorporated
- Maintains a conservative debt-to-equity ratio (0.2), signaling low financial risk.
Incyte Corporation
- Exhibits an extremely low debt level (0.01 D/E), reflecting a very strong balance sheet.
3. Stock Volatility
Vertex Pharmaceuticals Incorporated
- Beta at 0.319 indicates low market volatility, appealing for risk-averse investors.
Incyte Corporation
- Beta at 0.847 shows moderate volatility, exposing shareholders to greater market swings.
4. Regulatory & Legal
Vertex Pharmaceuticals Incorporated
- Subject to stringent FDA approvals and patent litigations typical in biotech.
Incyte Corporation
- Faces regulatory hurdles in oncology drug approvals and patent challenges.
5. Supply Chain & Operations
Vertex Pharmaceuticals Incorporated
- Relies heavily on specialty distributors, posing operational risks if disruptions occur.
Incyte Corporation
- Diverse product portfolio mitigates single-point supply risks but operational complexity rises.
6. ESG & Climate Transition
Vertex Pharmaceuticals Incorporated
- ESG disclosure improving; climate transition risks remain moderate given manufacturing footprint.
Incyte Corporation
- ESG initiatives evolving; exposure to sustainability pressures in biopharma manufacturing and clinical trials.
7. Geopolitical Exposure
Vertex Pharmaceuticals Incorporated
- Primarily US-based with some international sales; geopolitical risk is moderate.
Incyte Corporation
- Also US-centric but with growing international collaborations, increasing geopolitical complexity.
Which company shows a better risk-adjusted profile?
Vertex’s most impactful risk is its high valuation metrics (P/E 29.3, P/B 6.2) which may limit upside. Incyte’s key risk lies in moderate stock volatility and regulatory hurdles. Despite Vertex’s higher valuation risk, its low beta and strong operational metrics offer stability. Incyte’s diversified pipeline and stronger credit profile improve its risk-adjusted appeal. However, Vertex’s low beta (0.319) versus Incyte’s 0.847 confirms Vertex as a safer play amid market turbulence.
Final Verdict: Which stock to choose?
Vertex Pharmaceuticals’ superpower lies in its robust efficiency and consistent value creation, reflected in a high ROIC well above its cost of capital. Its point of vigilance is the declining ROIC trend, suggesting potential pressure on future profitability. It suits portfolios seeking aggressive growth with a tolerance for cyclical risks.
Incy Corporation boasts a strategic moat through its growing ROIC and strong capital efficiency, signaling a sustainable competitive advantage. It offers better financial stability than Vertex, with a lower debt load and attractive valuation multiples. Incy fits well in GARP portfolios balancing growth and reasonable pricing.
If you prioritize aggressive growth and are comfortable with some margin compression, Vertex outshines due to its operational strength and growth momentum. However, if you seek better stability and a proven moat with more conservative valuation, Incy provides a compelling alternative. Both present favorable scenarios but appeal to distinct investor profiles.
Disclaimer: Investment carries a risk of loss of initial capital. The past performance is not a reliable indicator of future results. Be sure to understand risks before making an investment decision.
Go Further
I encourage you to read the complete analyses of Vertex Pharmaceuticals Incorporated and Incyte Corporation to enhance your investment decisions: