Home > Comparison > Healthcare > REGN vs INCY
The competitive dynamic between Regeneron Pharmaceuticals and Incyte Corporation shapes the biotech industry’s innovation frontier. Regeneron operates as a diversified biotech powerhouse with a broad portfolio in rare and chronic diseases. Incyte leans on targeted oncology and immunology therapies, emphasizing clinical-stage innovation. This analysis pits Regeneron’s scale and stability against Incyte’s growth potential to reveal which offers the superior risk-adjusted return for diverse healthcare investors.
Table of contents
Companies Overview
Regeneron Pharmaceuticals and Incyte Corporation stand as influential players in the biotechnology sector, shaping healthcare innovation.
Regeneron Pharmaceuticals, Inc.: Biotechnology Powerhouse
Regeneron dominates as a biotechnology leader focused on discovering and commercializing medicines worldwide. Its revenue centers on blockbuster drugs like EYLEA for eye diseases and Dupixent for inflammatory conditions. In 2026, Regeneron emphasizes expanding its product pipeline and strategic collaborations with top pharmaceutical firms to sustain growth.
Incyte Corporation: Focused Biopharma Innovator
Incyte operates as a specialized biopharmaceutical company targeting oncologic and inflammatory diseases. It generates revenue through proprietary therapies such as JAKAFI and PEMAZYRE, addressing niche clinical needs. The company’s 2026 strategy prioritizes advancing clinical-stage candidates and expanding partnerships to accelerate drug development and market penetration.
Strategic Collision: Similarities & Divergences
Both companies leverage innovative drug development but differ in scale and scope. Regeneron pursues broad therapeutic areas with a diversified portfolio, while Incyte targets selective oncology and immune disorders. Their primary battle unfolds in specialty pharmaceuticals. Regeneron’s larger market cap and extensive collaborations contrast with Incyte’s focused pipeline and nimble approach, reflecting distinct risk and growth profiles for investors.
Income Statement Comparison
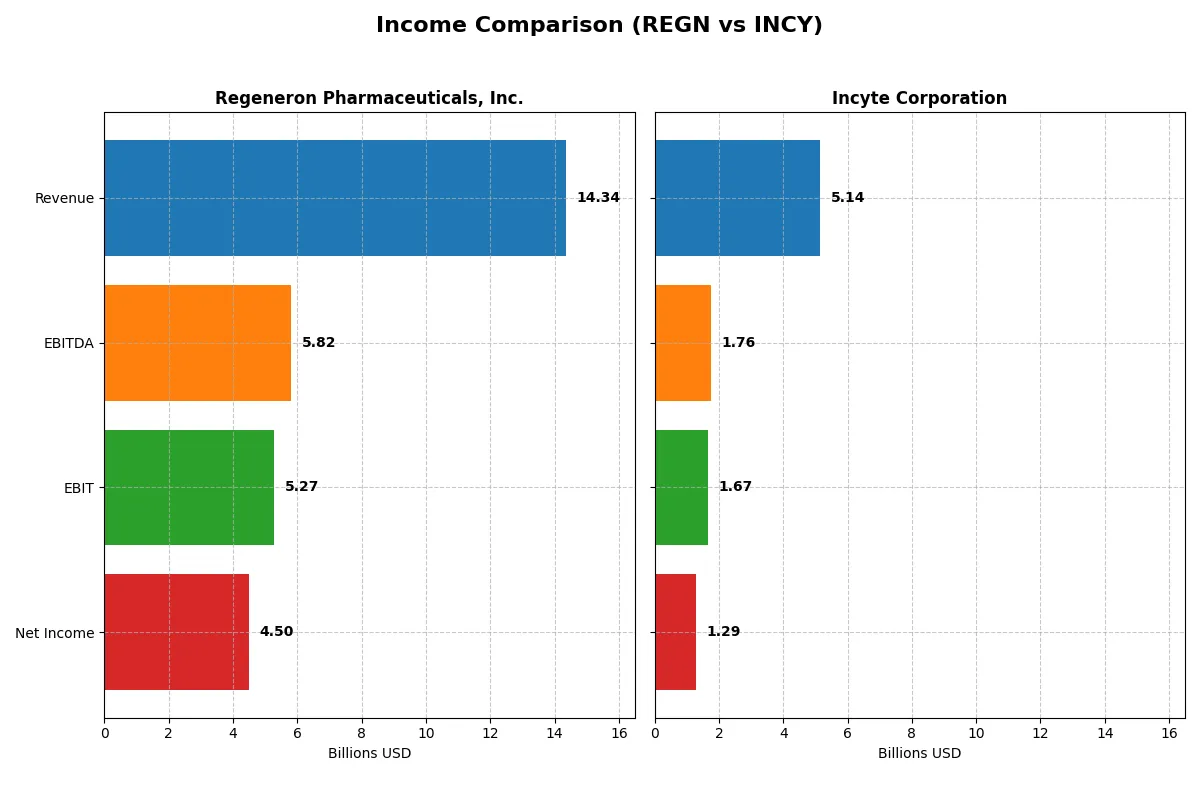
This table dissects the core profitability and scalability of both corporate engines to reveal who dominates the bottom line:
| Metric | Regeneron Pharmaceuticals, Inc. (REGN) | Incyte Corporation (INCY) |
|---|---|---|
| Revenue | 14.34B | 5.14B |
| Cost of Revenue | 2.10B | 439M |
| Operating Expenses | 8.66B | 3.36B |
| Gross Profit | 12.24B | 4.70B |
| EBITDA | 5.82B | 1.76B |
| EBIT | 5.27B | 1.67B |
| Interest Expense | 44M | 2.4M |
| Net Income | 4.50B | 1.29B |
| EPS | 43.07 | 6.59 |
| Fiscal Year | 2025 | 2025 |
Income Statement Analysis: The Bottom-Line Duel
The income statement comparison reveals which company runs a more efficient and profitable corporate engine under current market conditions.
Regeneron Pharmaceuticals, Inc. Analysis
Regeneron’s revenue held steady near $14.3B in 2025, but net income declined over five years to $4.5B. Its gross margin remains robust at 85.4%, supporting strong profitability. The 2025 EBIT margin of 36.8% and net margin of 31.4% reflect operational discipline despite modest revenue growth and rising expenses.
Incyte Corporation Analysis
Incyte delivered dynamic growth, with revenue jumping 21% to $5.1B in 2025 and net income surging to $1.3B. Its gross margin of 91.5% outpaces Regeneron’s, though net margin at 25% trails slightly. Exceptional EBIT growth (423%) and net margin expansion signal improving efficiency and strong momentum in its business model.
Margin Strength vs. Growth Trajectory
Regeneron excels in margin strength and steady profitability, while Incyte outshines with rapid revenue and earnings growth. Regeneron’s higher net margin and operational scale dominate the income statement, but Incyte’s accelerating momentum offers a compelling growth profile. Investors seeking stability may favor Regeneron; those targeting expansion might prefer Incyte’s trajectory.
Financial Ratios Comparison
These vital ratios act as a diagnostic tool to expose the underlying fiscal health, valuation premiums, and capital efficiency of the companies compared below:
| Ratios | Regeneron Pharmaceuticals, Inc. (REGN) | Incyte Corporation (INCY) |
|---|---|---|
| ROE | 14.4% | 24.9% |
| ROIC | 8.5% | 20.6% |
| P/E | 17.9 | 15.0 |
| P/B | 2.58 | 3.73 |
| Current Ratio | 4.13 | 3.32 |
| Quick Ratio | 3.39 | 3.25 |
| D/E | 0.087 | 0.013 |
| Debt-to-Assets | 6.7% | 1.0% |
| Interest Coverage | 81.7 | 553.0 |
| Asset Turnover | 0.35 | 0.74 |
| Fixed Asset Turnover | 2.80 | 6.78 |
| Payout ratio | 8.2% | 0% |
| Dividend yield | 0.46% | 0% |
| Fiscal Year | 2025 | 2025 |
Efficiency & Valuation Duel: The Vital Signs
Financial ratios serve as a company’s DNA, uncovering hidden risks and revealing operational strengths few other metrics capture.
Regeneron Pharmaceuticals, Inc.
Regeneron posts a solid 14.4% ROE with a strong 31.4% net margin, signaling healthy profitability. Its P/E ratio of 17.9 suggests a fairly valued stock, neither cheap nor stretched. Shareholder returns are modest, with a low 0.46% dividend yield, implying reinvestments focus heavily on R&D, fueling long-term growth.
Incyte Corporation
Incyte impresses with a robust 24.9% ROE and a 25% net margin, delivering superior profitability. Its P/E of 15.0 shows the stock trades at a discount relative to Regeneron, indicating better valuation efficiency despite an unfavorable 3.7 PB ratio. Incyte pays no dividend, signaling reinvestment into research and growth initiatives.
Balanced Profitability Meets Valuation Discipline
Incyte outperforms Regeneron in ROE and valuation metrics, reflecting stronger operational efficiency and growth potential. Regeneron offers stability with steady margins and a dividend, fitting investors seeking modest income. Incyte’s profile suits growth-focused investors comfortable with reinvestment over income.
Which one offers the Superior Shareholder Reward?
I see Regeneron (REGN) pays a modest 0.46% dividend yield with an 8.2% payout ratio, well covered by strong free cash flow of $39/share in 2025. In contrast, Incyte (INCY) pays no dividend but retains cash for growth. Regeneron also pursues buybacks aggressively, enhancing shareholder returns sustainably. Incyte’s buyback intensity is less visible but its free cash flow per share of $6.9 is much smaller, limiting buyback scale. I conclude Regeneron offers a superior total return profile in 2026 due to its balanced, sustainable payout and capital return strategy.
Comparative Score Analysis: The Strategic Profile
The radar chart reveals the fundamental DNA and trade-offs of Regeneron Pharmaceuticals and Incyte Corporation, highlighting their financial strengths and vulnerabilities:
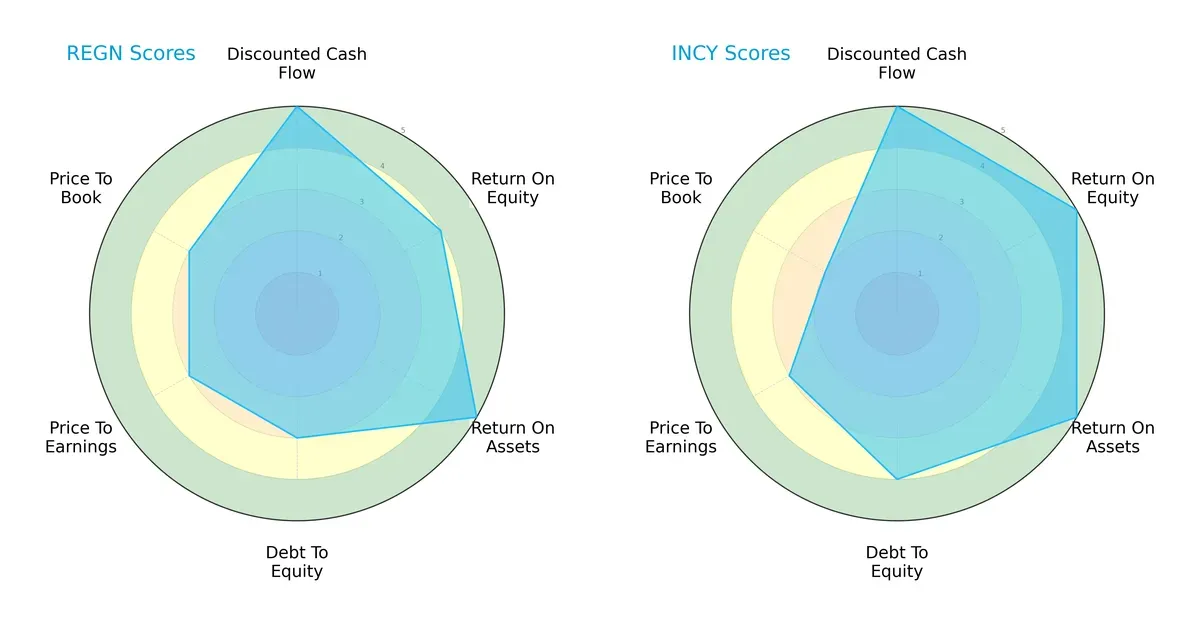
Both firms score perfectly on discounted cash flow, signaling strong valuation models. Incyte edges Regeneron on return on equity and assets, reflecting superior operational efficiency. Regeneron’s moderate debt-to-equity contrasts with Incyte’s more conservative leverage, enhancing Incyte’s financial stability. Valuation metrics show Regeneron as moderately priced, while Incyte’s price-to-book score flags potential overvaluation. Overall, Incyte presents a slightly more balanced profile, while Regeneron relies on robust asset utilization.
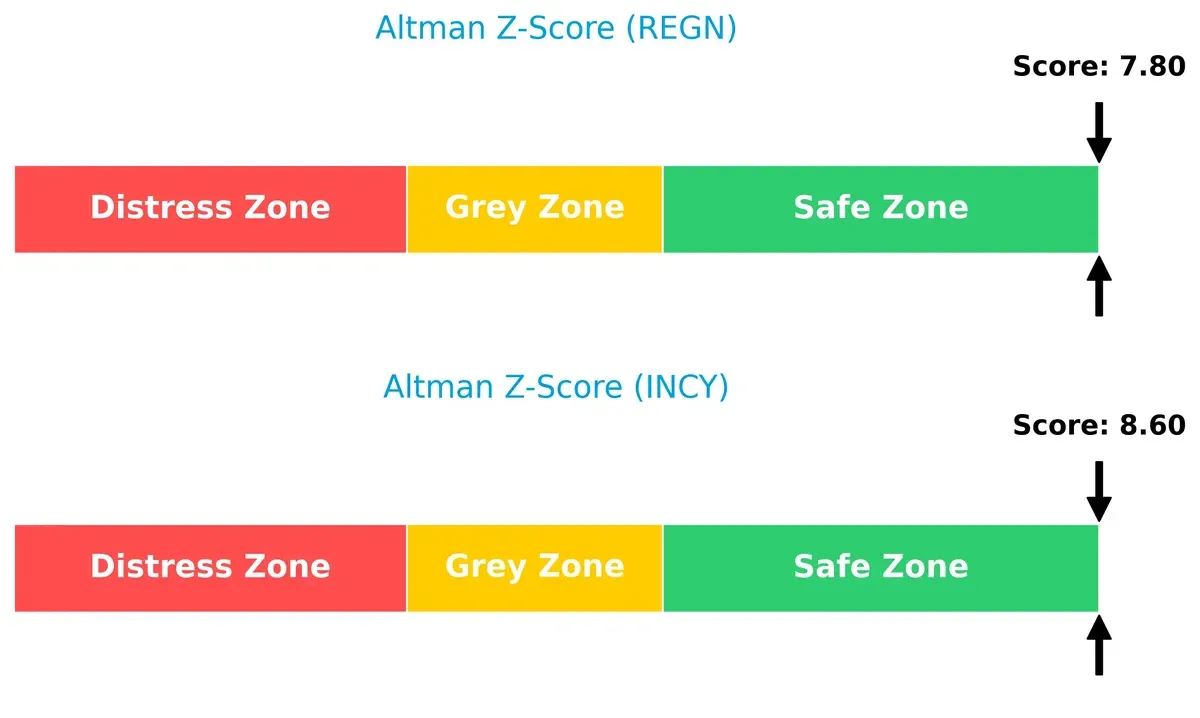
Bankruptcy Risk: Solvency Showdown
The Altman Z-Score comparison indicates both companies reside comfortably in the safe zone, suggesting solid solvency and low bankruptcy risk in this cycle:
Financial Health: Quality of Operations
Piotroski F-Scores place both firms in the average category, with Incyte at 6 and Regeneron at 5, implying steady but not peak financial health:
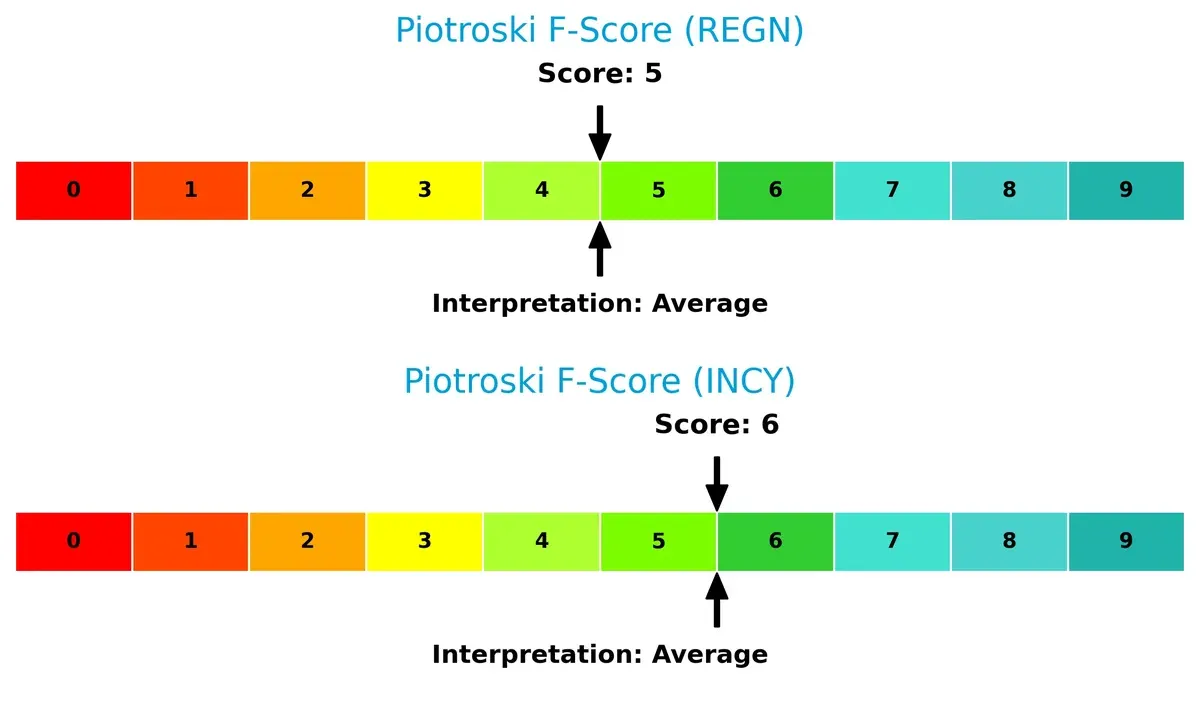
Neither company shows immediate red flags, but investors should monitor internal metrics for any emerging weaknesses.
How are the two companies positioned?
This section dissects REGN and INCY’s operational DNA by comparing their revenue distribution and internal dynamics. The goal is to confront their economic moats to identify which model offers the most resilient, sustainable competitive advantage today.
Revenue Segmentation: The Strategic Mix
This visual comparison dissects how Regeneron Pharmaceuticals and Incyte Corporation diversify their income streams and where their primary sector bets lie:
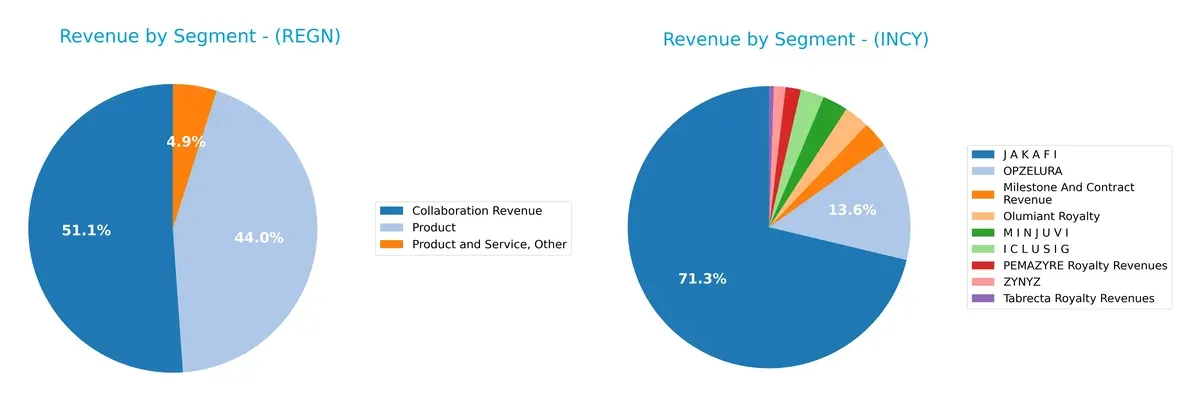
Regeneron anchors revenue in two robust streams: $7.3B collaboration and $6.3B product sales in 2025, reflecting a balanced biotech ecosystem approach. Incyte pivots heavily on Jakafi with $3.55B, while other segments remain under $700M, signaling concentration risk but strong market dominance. Regeneron’s diversified portfolio mitigates volatility, whereas Incyte’s reliance on one blockbuster demands vigilant pipeline innovation.
Strengths and Weaknesses Comparison
This table compares the strengths and weaknesses of Regeneron Pharmaceuticals, Inc. and Incyte Corporation based on key financial and business metrics:
Regeneron Strengths
- High net margin of 31.41%
- Favorable WACC at 5.49%
- Low debt-to-assets ratio of 6.67%
- Strong interest coverage of 120.42
- Significant collaboration revenue of 7.33B in 2025
- Large U.S. revenue base at 4.38B
Incyte Strengths
- Higher ROE at 24.9%
- Strong ROIC of 20.58%
- Favorable PE ratio at 14.98
- Very low debt-to-assets at 1.0%
- Exceptional interest coverage at 686.52
- Diverse product revenue including 3.55B from JAKAFI
- Growing European presence at 324M
Regeneron Weaknesses
- Unfavorable current ratio of 4.13 indicating liquidity concerns
- Unfavorable asset turnover at 0.35
- Low dividend yield at 0.46%
- Neutral ROE and ROIC ratios
- Limited geographic diversification, mostly U.S. and 0.51B Rest of World revenue
- Product revenue showed decline from 7.63B in 2024 to 6.31B in 2025
Incyte Weaknesses
- Unfavorable current ratio of 3.32
- Unfavorable PB ratio at 3.73
- No dividend yield
- Lower diversification outside JAKAFI
- Geographic revenue concentrated mostly in U.S. and Europe
- Asset turnover neutral at 0.74
Both companies show strong financial health and core product revenues, but Regeneron’s liquidity ratios and asset efficiency lag slightly. Incyte’s high profitability and low leverage contrast with its limited diversification and lack of dividend, influencing strategic focus areas.
The Moat Duel: Analyzing Competitive Defensibility
A structural moat is the only reliable shield preserving long-term profits from relentless competitive pressure and market disruption:
Regeneron Pharmaceuticals, Inc.: Innovation-Driven Intangible Assets
Regeneron leverages its strong R&D pipeline and collaboration network as an intangible asset moat. It shows high ROIC above WACC but suffers a declining profitability trend. New drug launches in eye and inflammatory diseases could stabilize this in 2026.
Incyte Corporation: Operational Efficiency and Growth Momentum
Incyte’s moat centers on operational efficiency and robust revenue growth, reflected in its soaring ROIC exceeding WACC with an improving trajectory. Unlike Regeneron, Incyte’s expanding clinical portfolio and geographic diversification energize its competitive position for 2026.
Innovation Endurance vs. Growth Velocity
Incyte commands a deeper moat with a rising ROIC and accelerating revenue growth, while Regeneron’s moat weakens amid declining returns. I see Incyte better positioned to defend and expand its market share through sustained value creation.
Which stock offers better returns?
The past year shows divergent price movements: Regeneron Pharmaceuticals faces a sharp decline with recent recovery signs, while Incyte Corporation enjoys strong gains despite recent mild weakness.
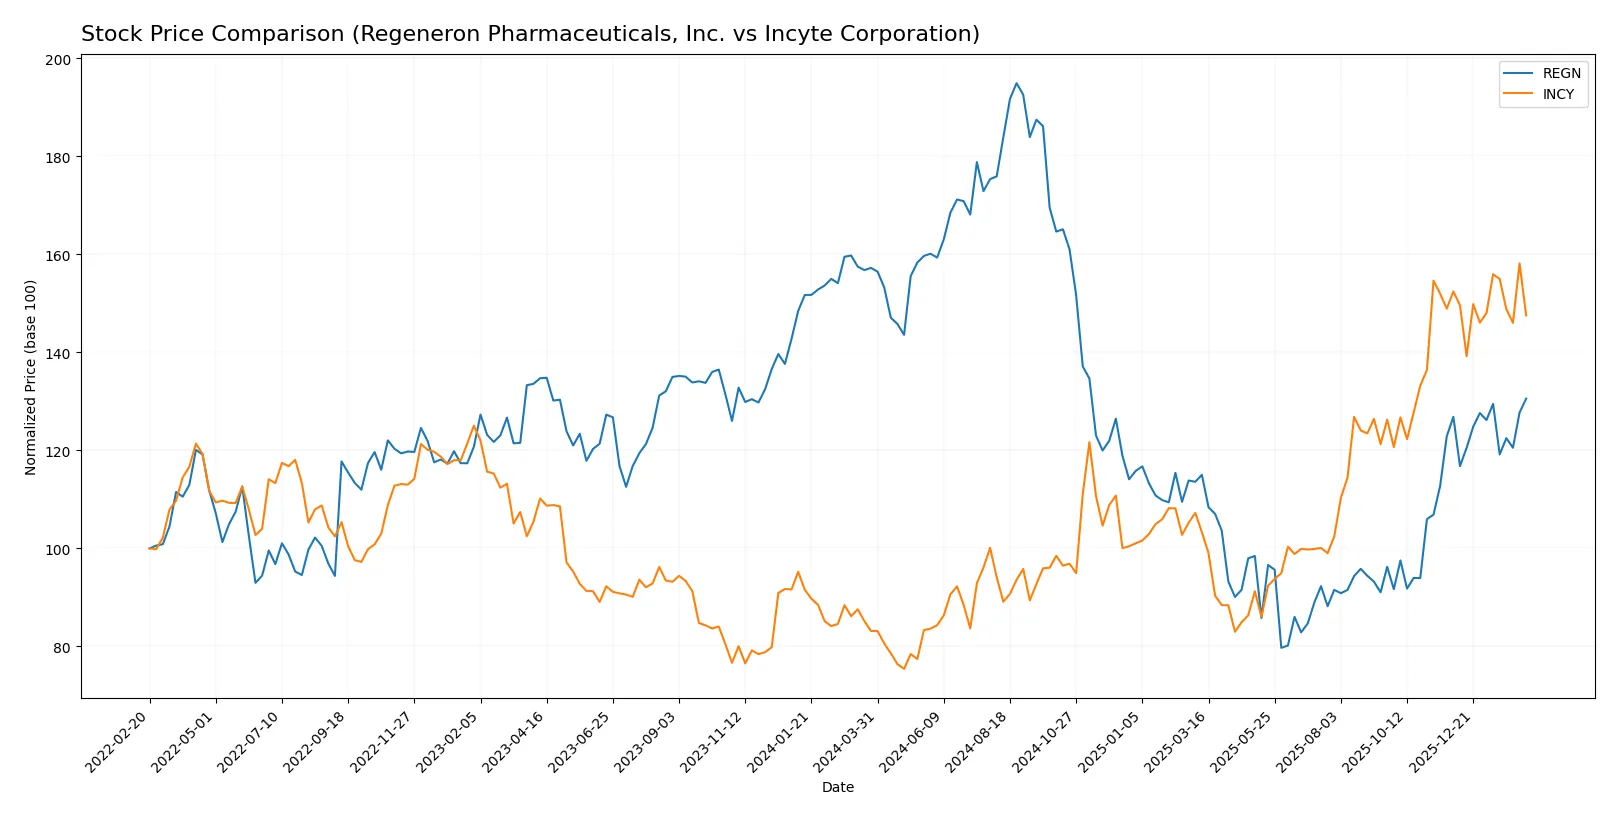
Trend Comparison
Regeneron’s stock fell 16.96% over the past 12 months, marking a bearish trend with accelerating decline. It hit a high of 1199.12 and a low of 490.28, showing significant volatility.
Incyte’s stock rose 77.43% over the past year, reflecting a bullish trend with decelerating gains. Its price ranged from 51.68 to 108.39, displaying lower volatility than Regeneron.
Incyte outperformed Regeneron with a markedly higher overall return despite its recent slight downward trend, delivering superior market performance over the analyzed period.
Target Prices
Analysts present a mixed but generally positive target consensus for Regeneron Pharmaceuticals and Incyte Corporation.
| Company | Target Low | Target High | Consensus |
|---|---|---|---|
| Regeneron Pharmaceuticals, Inc. | 700 | 1,057 | 857.17 |
| Incyte Corporation | 84 | 135 | 108.8 |
The consensus target prices for Regeneron and Incyte exceed their current prices of 803.17 and 101.1, respectively, reflecting analyst optimism amid ongoing biotech innovation.

Don’t Let Luck Decide Your Entry Point
Optimize your entry points with our advanced ProRealTime indicators. You’ll get efficient buy signals with precise price targets for maximum performance. Start outperforming now!
How do institutions grade them?
The following tables summarize recent institutional grades for Regeneron Pharmaceuticals, Inc. and Incyte Corporation:
Regeneron Pharmaceuticals, Inc. Grades
This table shows the latest grades from reputable institutions for Regeneron Pharmaceuticals, Inc.
| Grading Company | Action | New Grade | Date |
|---|---|---|---|
| Guggenheim | Maintain | Buy | 2026-02-09 |
| Morgan Stanley | Maintain | Equal Weight | 2026-02-02 |
| Cantor Fitzgerald | Maintain | Overweight | 2026-02-02 |
| Wells Fargo | Maintain | Equal Weight | 2026-02-02 |
| Oppenheimer | Maintain | Outperform | 2026-02-02 |
| JP Morgan | Maintain | Overweight | 2026-02-02 |
| Truist Securities | Maintain | Buy | 2026-02-02 |
| Evercore ISI Group | Maintain | Outperform | 2026-01-22 |
| Truist Securities | Maintain | Buy | 2026-01-08 |
| B of A Securities | Upgrade | Buy | 2026-01-07 |
Incyte Corporation Grades
This table summarizes recent grades from credible grading companies for Incyte Corporation.
| Grading Company | Action | New Grade | Date |
|---|---|---|---|
| HC Wainwright & Co. | Maintain | Buy | 2026-02-11 |
| RBC Capital | Maintain | Sector Perform | 2026-02-11 |
| Stifel | Maintain | Buy | 2026-02-11 |
| Wells Fargo | Maintain | Equal Weight | 2026-02-11 |
| Piper Sandler | Maintain | Overweight | 2026-02-06 |
| Barclays | Maintain | Overweight | 2026-02-04 |
| Wells Fargo | Downgrade | Equal Weight | 2026-01-20 |
| TD Cowen | Maintain | Buy | 2026-01-13 |
| Morgan Stanley | Maintain | Equal Weight | 2026-01-06 |
| Wells Fargo | Maintain | Overweight | 2025-12-08 |
Which company has the best grades?
Regeneron consistently receives high grades such as Buy and Outperform from multiple institutions. Incyte’s ratings are more mixed, with several Overweight and Buy grades but also some Sector Perform and Equal Weight assessments. Investors may perceive Regeneron as the stronger consensus pick, potentially indicating greater confidence in its outlook.
Risks specific to each company
The following categories identify the critical pressure points and systemic threats facing Regeneron Pharmaceuticals, Inc. and Incyte Corporation in the 2026 market environment:
1. Market & Competition
Regeneron Pharmaceuticals, Inc.
- Strong product portfolio but faces intense biotech competition and patent expirations risk.
Incyte Corporation
- Smaller scale with niche oncology focus, vulnerable to competitive pipeline advances.
2. Capital Structure & Debt
Regeneron Pharmaceuticals, Inc.
- Low debt-to-equity ratio (0.09) and strong interest coverage (120x) indicate conservative leverage.
Incyte Corporation
- Even lower debt ratio (0.01) and exceptional interest coverage (686x) reflect very strong balance sheet.
3. Stock Volatility
Regeneron Pharmaceuticals, Inc.
- Beta of 0.41 shows lower volatility, appealing to risk-averse investors.
Incyte Corporation
- Beta near 0.85 indicates moderate volatility, exposing investors to higher market swings.
4. Regulatory & Legal
Regeneron Pharmaceuticals, Inc.
- Faces regulatory scrutiny tied to complex collaborations and global drug approvals.
Incyte Corporation
- Regulatory risk heightened by clinical trial dependencies and oncology drug approvals.
5. Supply Chain & Operations
Regeneron Pharmaceuticals, Inc.
- Large-scale manufacturing capacity but asset turnover (0.35) is low, signaling operational inefficiencies.
Incyte Corporation
- Better asset turnover (0.74) and fixed asset efficiency suggest more nimble operations.
6. ESG & Climate Transition
Regeneron Pharmaceuticals, Inc.
- ESG commitments less transparent; environmental transition may require increased investment.
Incyte Corporation
- Smaller footprint but ESG disclosures and climate strategy remain limited.
7. Geopolitical Exposure
Regeneron Pharmaceuticals, Inc.
- Global collaborations increase exposure to geopolitical risks and supply disruptions.
Incyte Corporation
- Primarily US-focused with limited international exposure, reducing geopolitical risk.
Which company shows a better risk-adjusted profile?
Incyte faces higher market volatility but demonstrates superior financial strength with a safer debt profile and more efficient operations. Regeneron’s low volatility and large scale are offset by operational inefficiencies and greater geopolitical exposure. Incyte’s higher ROIC and Altman Z-Score further support a stronger risk-return balance. Overall, Incyte exhibits a better risk-adjusted profile given its robust capital structure and operational agility amid biotech sector challenges.
Final Verdict: Which stock to choose?
Regeneron Pharmaceuticals, Inc. (REGN) excels as a cash-generating powerhouse with a solid economic moat, delivering consistent value above its cost of capital. Its key point of vigilance lies in a declining profitability trend, signaling the need for close monitoring. REGN suits an income-focused or balanced growth portfolio.
Incyte Corporation (INCY) leverages a robust strategic moat fueled by accelerating revenue growth and expanding returns on invested capital. Its safety profile appears stronger, supported by improving profitability and a very favorable moat status. INCY fits well within a growth-at-a-reasonable-price (GARP) strategy, appealing to growth-oriented investors seeking stability.
If you prioritize steady cash flow and dividend income, Regeneron stands as the compelling choice due to its proven value creation despite recent margin pressures. However, if you seek growth with improving profitability and a widening moat, Incyte offers better stability and superior expansion potential, commanding a premium in growth portfolios.
Disclaimer: Investment carries a risk of loss of initial capital. The past performance is not a reliable indicator of future results. Be sure to understand risks before making an investment decision.
Go Further
I encourage you to read the complete analyses of Regeneron Pharmaceuticals, Inc. and Incyte Corporation to enhance your investment decisions: