Investors seeking opportunities in the industrial machinery sector often consider Illinois Tool Works Inc. (ITW) and Xylem Inc. (XYL), two prominent players with overlapping markets and distinct innovation strategies. ITW boasts diversified industrial products across automotive and construction, while Xylem focuses on engineered solutions for water management. This article will dissect their strengths and risks to help you decide which company is the most compelling addition to your investment portfolio.
Table of contents
Companies Overview
I will begin the comparison between Illinois Tool Works Inc. and Xylem Inc. by providing an overview of these two companies and their main differences.
Illinois Tool Works Inc. Overview
Illinois Tool Works Inc. manufactures and sells industrial products and equipment globally, operating through seven diverse segments including Automotive OEM, Food Equipment, and Welding. Founded in 1912 and based in Glenview, IL, ITW serves various end markets such as automotive, commercial food equipment, and construction. The company distributes its products directly and through independent distributors, positioning itself as a broad-based industrial machinery leader.
Xylem Inc. Overview
Xylem Inc. designs, manufactures, and services engineered products and solutions focused on water and wastewater applications worldwide. Incorporated in 2011 and headquartered in Washington, NY, Xylem operates through three segments: Water Infrastructure, Applied Water, and Measurement & Control Solutions. The company emphasizes smart technologies and critical infrastructure solutions, marketing its products via direct sales, resellers, and distributors in multiple regions.
Key similarities and differences
Both ITW and Xylem operate in the industrial machinery sector, serving specialized markets with engineered products. While ITW’s business model is diversified across automotive, food, and construction segments, Xylem concentrates on water-related infrastructure and solutions, integrating advanced measurement and control technologies. Distribution channels overlap, involving direct sales and independent distributors, but their end-market focus and product specialization distinguish their operational approaches.
Income Statement Comparison
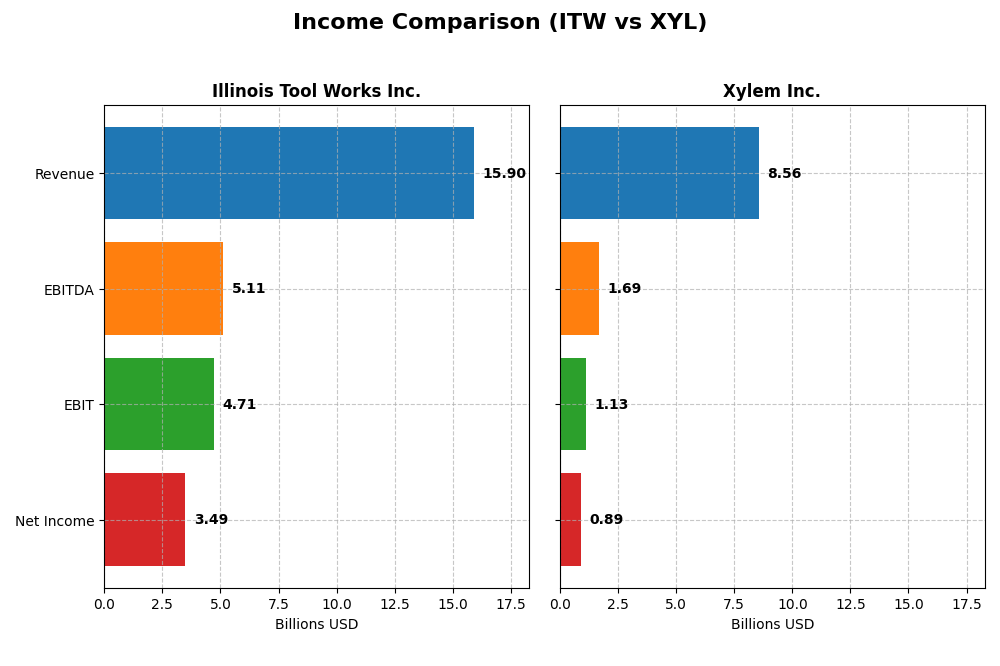
Below is a side-by-side comparison of key income statement metrics for Illinois Tool Works Inc. and Xylem Inc. for the fiscal year 2024.
| Metric | Illinois Tool Works Inc. (ITW) | Xylem Inc. (XYL) |
|---|---|---|
| Market Cap | 74.7B | 34.0B |
| Revenue | 15.9B | 8.6B |
| EBITDA | 5.1B | 1.7B |
| EBIT | 4.7B | 1.1B |
| Net Income | 3.5B | 890M |
| EPS | 11.75 | 3.67 |
| Fiscal Year | 2024 | 2024 |
Income Statement Interpretations
Illinois Tool Works Inc.
Illinois Tool Works showed a 26.44% revenue growth and 65.39% net income growth from 2020 to 2024, with consistent improvements in gross and net margins. The 2024 fiscal year saw a slight 1.3% revenue decline but a 15.06% EBIT increase and a net margin rise to 21.94%, indicating margin strength despite revenue pressure.
Xylem Inc.
Xylem experienced strong revenue growth of 75.59% and an impressive 250.39% net income increase over the 2020-2024 period. Margins improved markedly, with a 37.51% gross margin and a 10.39% net margin in 2024. The latest year’s performance was robust, with a 16.27% revenue rise and a 65.35% surge in EBIT, reflecting accelerating profitability.
Which one has the stronger fundamentals?
Both companies show favorable income statement trends, but Xylem’s higher revenue and net income growth rates and consistent margin expansion indicate stronger momentum. Illinois Tool Works maintains higher absolute margins and stable profitability. The fundamentals comparison depends on prioritizing growth versus margin levels, with both companies demonstrating solid financial health overall.
Financial Ratios Comparison
The table below presents a side-by-side comparison of key financial ratios for Illinois Tool Works Inc. (ITW) and Xylem Inc. (XYL) based on their most recent fiscal year data for 2024.
| Ratios | Illinois Tool Works Inc. (ITW) | Xylem Inc. (XYL) |
|---|---|---|
| ROE | 105.2% | 8.4% |
| ROIC | 27.2% | 5.8% |
| P/E | 21.6 | 31.6 |
| P/B | 22.7 | 2.64 |
| Current Ratio | 1.36 | 1.75 |
| Quick Ratio | 0.99 | 1.33 |
| D/E | 2.44 | 0.20 |
| Debt-to-Assets | 53.6% | 12.9% |
| Interest Coverage | 15.1 | 22.9 |
| Asset Turnover | 1.06 | 0.52 |
| Fixed Asset Turnover | 6.91 | 7.43 |
| Payout Ratio | 48.6% | 39.3% |
| Dividend Yield | 2.25% | 1.24% |
Interpretation of the Ratios
Illinois Tool Works Inc.
Illinois Tool Works exhibits strong profitability ratios, including a high net margin of 21.94% and an exceptional return on equity of 105.16%, indicating efficient capital use. However, its high debt-to-equity ratio of 2.44 and debt-to-assets of 53.61% raise concerns about leverage risk. The company maintains a favorable dividend yield of 2.25%, supported by consistent payouts, though leverage levels warrant monitoring.
Xylem Inc.
Xylem shows a moderate net margin of 10.39%, but its return on equity is relatively weak at 8.36%, which may indicate less efficient capital utilization. The company has a low debt-to-equity ratio of 0.2 and a conservative debt-to-assets ratio of 12.88%, reflecting a strong balance sheet. Dividend yield stands at a neutral 1.24%, suggesting modest shareholder returns with room for improvement.
Which one has the best ratios?
Both Illinois Tool Works and Xylem have a slightly favorable overall ratio profile, each with 50% favorable ratios. Illinois Tool Works excels in profitability but carries higher debt levels, while Xylem has a stronger liquidity and leverage position but weaker returns on equity. The choice depends on prioritizing either profitability or financial conservatism.
Strategic Positioning
This section compares the strategic positioning of Illinois Tool Works Inc. and Xylem Inc., including market position, key segments, and exposure to technological disruption:
Illinois Tool Works Inc.
- Large market cap $74.7B with diversified industrial machinery segments facing moderate competitive pressure.
- Diverse segments including Automotive OEM, Food Equipment, Welding, Construction, and Specialty Products.
- Operates in established industrial sectors with limited explicit exposure to rapid technological disruption.
Xylem Inc.
- Mid-sized $34B market cap focused on water-related machinery, subject to competitive pressure in niche markets.
- Concentrated in Water Infrastructure, Applied Water, and Measurement & Control Solutions segments.
- Engages in smart meters and cloud-based analytics, indicating moderate exposure to technological innovation.
Illinois Tool Works Inc. vs Xylem Inc. Positioning
Illinois Tool Works employs a diversified business model across multiple industrial segments, spreading risk but requiring management of varied markets. Xylem concentrates on water technology, allowing focused innovation but increasing vulnerability to sector-specific risks.
Which has the best competitive advantage?
Illinois Tool Works shows a very favorable moat with strong ROIC exceeding WACC and growing profitability, indicating durable competitive advantage. Xylem has a slightly unfavorable moat, shedding value despite improving ROIC, implying weaker competitive positioning.
Stock Comparison
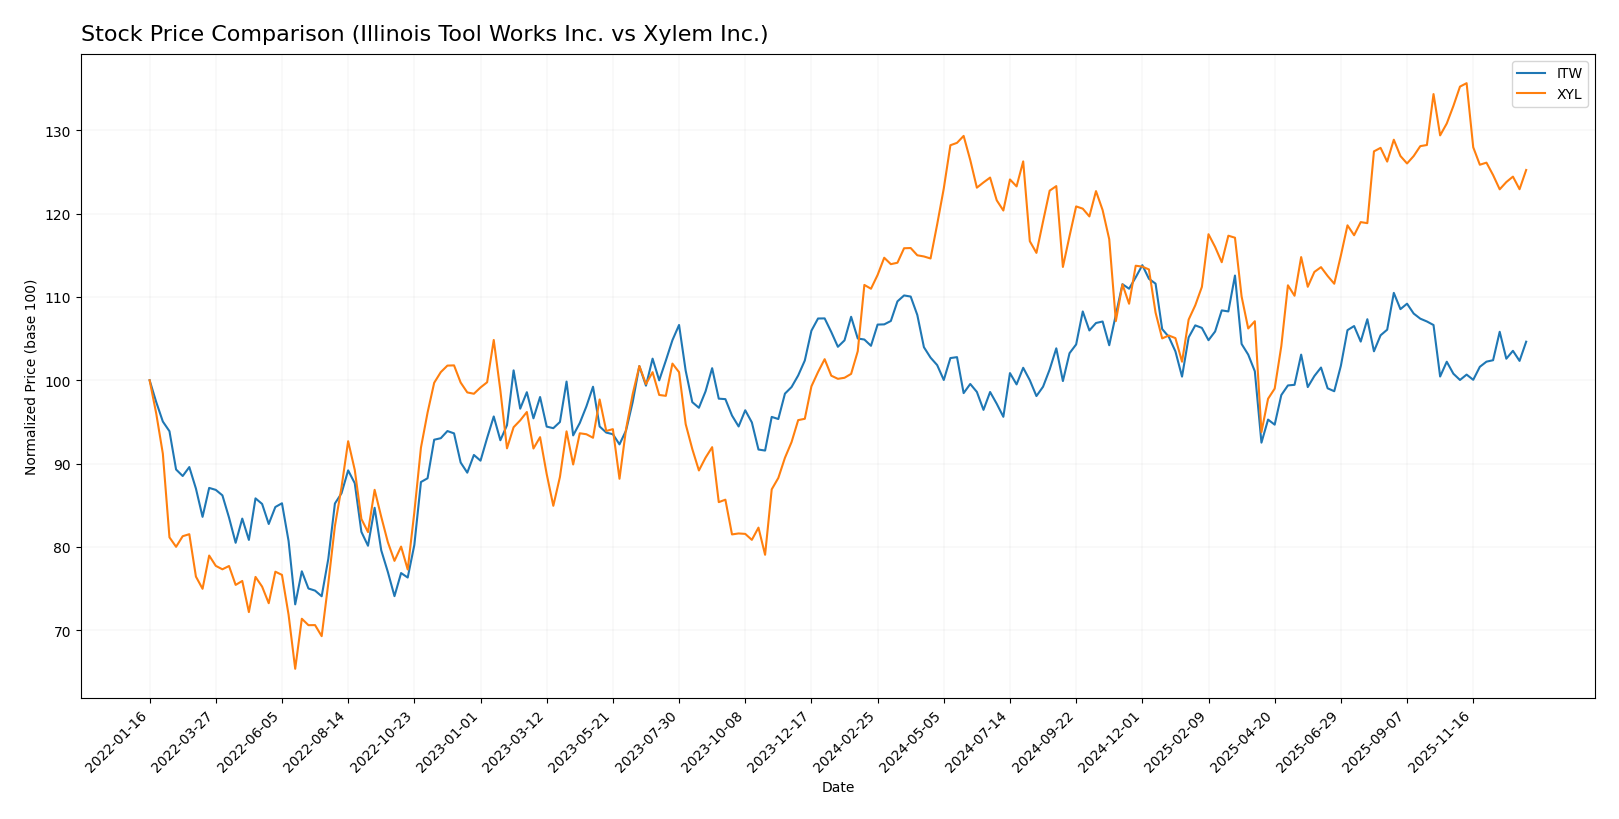
The stock price movements of Illinois Tool Works Inc. (ITW) and Xylem Inc. (XYL) over the past year reveal distinct trading dynamics, with ITW showing moderate overall gains and recent acceleration, while XYL exhibits stronger annual growth but recent decline.
Trend Analysis
Illinois Tool Works Inc. (ITW) showed a modest bullish trend over the past 12 months with a 0.47% price increase and acceleration in momentum. Recent weeks displayed a stronger 3.81% gain, confirming short-term bullish behavior despite moderate volatility.
Xylem Inc. (XYL) experienced a clear bullish trend over the last year with a 12.84% price increase, though the trend has decelerated recently. The stock declined by 5.77% in the latest period, indicating short-term bearish pressure amid slightly higher volatility.
Comparing both, XYL delivered higher market performance over the full year with a 12.84% gain versus ITW’s 0.47%, despite XYL’s recent short-term decline contrasting with ITW’s recent price acceleration.
Target Prices
The consensus target prices suggest moderate upside potential for both Illinois Tool Works Inc. and Xylem Inc.
| Company | Target High | Target Low | Consensus |
|---|---|---|---|
| Illinois Tool Works Inc. | 275 | 230 | 254 |
| Xylem Inc. | 178 | 150 | 169.43 |
Analysts expect Illinois Tool Works to trade near its current price of 255.12 USD, while Xylem’s consensus target of 169.43 USD indicates upside from its current 139.69 USD.
Analyst Opinions Comparison
This section compares the analysts’ ratings and grades for Illinois Tool Works Inc. (ITW) and Xylem Inc. (XYL):
Rating Comparison
ITW Rating
- Rating: B, considered very favorable.
- Discounted Cash Flow Score: 3, indicating a moderate valuation outlook.
- ROE Score: 5, very favorable, showing high efficiency in generating equity returns.
- ROA Score: 5, very favorable, indicating excellent asset utilization.
- Debt To Equity Score: 1, very unfavorable, reflecting high leverage risk.
- Overall Score: 3, moderate overall financial standing.
XYL Rating
- Rating: B, considered very favorable.
- Discounted Cash Flow Score: 3, indicating a moderate valuation outlook.
- ROE Score: 3, moderate efficiency in generating equity returns.
- ROA Score: 4, favorable, showing good asset utilization.
- Debt To Equity Score: 3, moderate, indicating balanced financial risk.
- Overall Score: 3, moderate overall financial standing.
Which one is the best rated?
Both ITW and XYL share the same overall rating of B and overall score of 3, indicating moderate financial standing. ITW leads in ROE and ROA scores but shows higher financial risk due to its weaker debt-to-equity score compared to XYL’s more balanced profile.
Scores Comparison
Here is a comparison of the Altman Z-Score and Piotroski Score for Illinois Tool Works Inc. and Xylem Inc.:
ITW Scores
- Altman Z-Score: 7.93, indicating a safe zone, low risk
- Piotroski Score: 7, considered strong financial health
XYL Scores
- Altman Z-Score: 4.89, indicating a safe zone, low risk
- Piotroski Score: 8, considered very strong financial health
Which company has the best scores?
Based on the provided data, XYL has a lower Altman Z-Score than ITW but both are in the safe zone. XYL’s Piotroski Score is higher, indicating stronger financial health compared to ITW.
Grades Comparison
The following tables present recent grades assigned to Illinois Tool Works Inc. and Xylem Inc. by reputable grading companies:
Illinois Tool Works Inc. Grades
This table summarizes the latest grades and rating actions by respected financial institutions for Illinois Tool Works Inc.:
| Grading Company | Action | New Grade | Date |
|---|---|---|---|
| Wells Fargo | Maintain | Underweight | 2026-01-07 |
| Goldman Sachs | Downgrade | Sell | 2025-12-16 |
| B of A Securities | Upgrade | Neutral | 2025-11-18 |
| Barclays | Maintain | Underweight | 2025-10-27 |
| Truist Securities | Maintain | Hold | 2025-10-27 |
| Wells Fargo | Maintain | Underweight | 2025-10-27 |
| Truist Securities | Maintain | Hold | 2025-10-08 |
| Barclays | Downgrade | Underweight | 2025-08-14 |
| Barclays | Maintain | Equal Weight | 2025-08-04 |
| UBS | Maintain | Neutral | 2025-07-31 |
The grades for Illinois Tool Works Inc. trend towards cautious or negative outlooks, with several underweight and sell ratings, reflecting moderate concern among analysts.
Xylem Inc. Grades
This table summarizes the latest grades and rating actions by respected financial institutions for Xylem Inc.:
| Grading Company | Action | New Grade | Date |
|---|---|---|---|
| Barclays | Maintain | Overweight | 2026-01-07 |
| Mizuho | Maintain | Neutral | 2026-01-05 |
| TD Cowen | Maintain | Hold | 2025-12-05 |
| UBS | Maintain | Buy | 2025-11-06 |
| RBC Capital | Maintain | Outperform | 2025-10-29 |
| Stifel | Maintain | Buy | 2025-10-29 |
| Barclays | Maintain | Overweight | 2025-10-29 |
| Citigroup | Maintain | Buy | 2025-10-29 |
| Citigroup | Maintain | Buy | 2025-10-09 |
| Mizuho | Maintain | Neutral | 2025-09-12 |
Grades for Xylem Inc. show a generally positive consensus, with multiple buy, outperform, and overweight ratings indicating favorable analyst sentiment.
Which company has the best grades?
Xylem Inc. has received stronger and more favorable grades compared to Illinois Tool Works Inc., which tends to have more cautious or negative ratings. For investors, this suggests Xylem is currently viewed more positively by analysts, potentially impacting perceived growth prospects and risk profiles.
Strengths and Weaknesses
Below is a comparison of key strengths and weaknesses for Illinois Tool Works Inc. (ITW) and Xylem Inc. (XYL) based on their latest financial performance and market position.
| Criterion | Illinois Tool Works Inc. (ITW) | Xylem Inc. (XYL) |
|---|---|---|
| Diversification | Highly diversified across 7+ segments, including Automotive OEM (3.19B), Food Equipment (2.65B), and Test & Measurement (2.82B) | Less diversified, focused mainly on Water Infrastructure (2.56B) and Water Solutions & Services (2.34B) |
| Profitability | Strong profitability: Net margin 21.94%, ROIC 27.19%, ROE 105.16% | Moderate profitability: Net margin 10.39%, ROIC 5.78%, ROE 8.36% (unfavorable) |
| Innovation | Sustained innovation with growing ROIC (+62%) indicating durable competitive advantage | Growing ROIC (+31%) but ROIC below WACC, indicating value destruction despite improving profitability |
| Global presence | Established global presence with broad industrial exposure | Global footprint in water technology but less diversified industrial reach |
| Market Share | Strong market position supported by value creation and efficiency | Weaker market position with value destruction but potential for growth |
Key takeaways: ITW demonstrates a very favorable economic moat with strong diversification, profitability, and value creation, making it a lower-risk investment. XYL shows improving profitability but is still shedding value, reflecting higher risk despite growth prospects. Investors should weigh ITW’s stability against XYL’s growth potential carefully.
Risk Analysis
Below is a comparative table highlighting the main risks for Illinois Tool Works Inc. (ITW) and Xylem Inc. (XYL) based on the most recent data from 2024:
| Metric | Illinois Tool Works Inc. (ITW) | Xylem Inc. (XYL) |
|---|---|---|
| Market Risk | Beta 1.17, moderately sensitive to market swings | Beta 1.17, similar market sensitivity |
| Debt level | High debt/equity ratio 2.44 (unfavorable) and 53.6% debt to assets | Low debt/equity ratio 0.2 (favorable) and 12.9% debt to assets |
| Regulatory Risk | Moderate, operates globally in industrial sectors with compliance needs | Moderate, water infrastructure sector faces regulatory scrutiny on environmental standards |
| Operational Risk | Diverse industrial segments reduce single-source risk but complexity is high | Specialized water solutions, operational risk linked to technology and service delivery |
| Environmental Risk | Moderate, industrial manufacturing has environmental impacts to manage | High, water treatment and infrastructure heavily regulated for environmental impact |
| Geopolitical Risk | Moderate, global supply chain exposure but diversified production | Moderate, international operations subject to geopolitical shifts affecting infrastructure projects |
In synthesis, ITW’s most impactful risk lies in its high leverage, which poses financial risk despite strong profitability and liquidity. XYL shows lower financial risk with conservative debt but faces significant environmental and regulatory challenges inherent to water infrastructure. Market risk is comparable for both, with similar beta values. Investors should carefully weigh ITW’s debt burden against XYL’s sector-specific regulatory pressures.
Which Stock to Choose?
Illinois Tool Works Inc. (ITW) shows a generally favorable income evolution with strong net margin growth and profitability. Its financial ratios are slightly favorable, despite some unfavorable debt-related metrics. The company has very favorable MOAT and a very favorable rating, supported by safe zone Altman Z-Score and strong Piotroski Score.
Xylem Inc. (XYL) demonstrates a favorable income evolution with high revenue and net income growth, though profitability ratios are more moderate. Its financial ratios are slightly favorable with low debt levels. However, its MOAT is slightly unfavorable as the company is currently shedding value despite growing profitability, and it holds a very favorable rating with a safe zone Altman Z-Score and very strong Piotroski Score.
Investors focused on stable profitability and a durable competitive advantage might find ITW more favorable, while those prioritizing strong growth metrics and lower leverage could see XYL as potentially attractive, considering its improving profitability and financial health.
Disclaimer: Investment carries a risk of loss of initial capital. The past performance is not a reliable indicator of future results. Be sure to understand risks before making an investment decision.
Go Further
I encourage you to read the complete analyses of Illinois Tool Works Inc. and Xylem Inc. to enhance your investment decisions: