Illinois Tool Works Inc. (ITW) and Symbotic Inc. (SYM) both operate in the industrial machinery sector but represent distinct approaches to innovation and market focus. ITW, a century-old diversified manufacturer, contrasts with Symbotic’s cutting-edge automation technology aimed at warehouse efficiency. Comparing these companies highlights the balance between established industrial strength and disruptive innovation. In this article, I will help you identify which company offers the most compelling investment opportunity.
Table of contents
Companies Overview
I will begin the comparison between Illinois Tool Works Inc. and Symbotic Inc. by providing an overview of these two companies and their main differences.
Illinois Tool Works Inc. Overview
Illinois Tool Works Inc. manufactures and sells industrial products and equipment worldwide, operating through seven segments including Automotive OEM, Food Equipment, and Welding. The company serves diverse markets such as automotive, construction, and general industrial sectors with a broad range of products distributed directly and via independent distributors. Founded in 1912, ITW is based in Glenview, Illinois, and is a well-established player in the industrial machinery industry.
Symbotic Inc. Overview
Symbotic Inc. is an automation technology company specializing in robotics and warehouse automation systems designed to improve efficiency for retailers and wholesalers in the U.S. Its flagship offering, The Symbotic System, aims to reduce costs and maximize inventory management. Founded recently and headquartered in Wilmington, Massachusetts, Symbotic operates in the industrial machinery sector with a focus on technology-driven solutions.
Key similarities and differences
Both ITW and Symbotic operate within the industrial machinery sector, serving industrial clients with specialized equipment. However, ITW has a diversified product portfolio across multiple segments and long-standing industry presence, while Symbotic focuses exclusively on automation technology and robotics for warehouse operations. ITW’s business model includes manufacturing and distribution globally, whereas Symbotic concentrates on technology solutions aimed at improving supply chain efficiency in retail and wholesale markets.
Income Statement Comparison
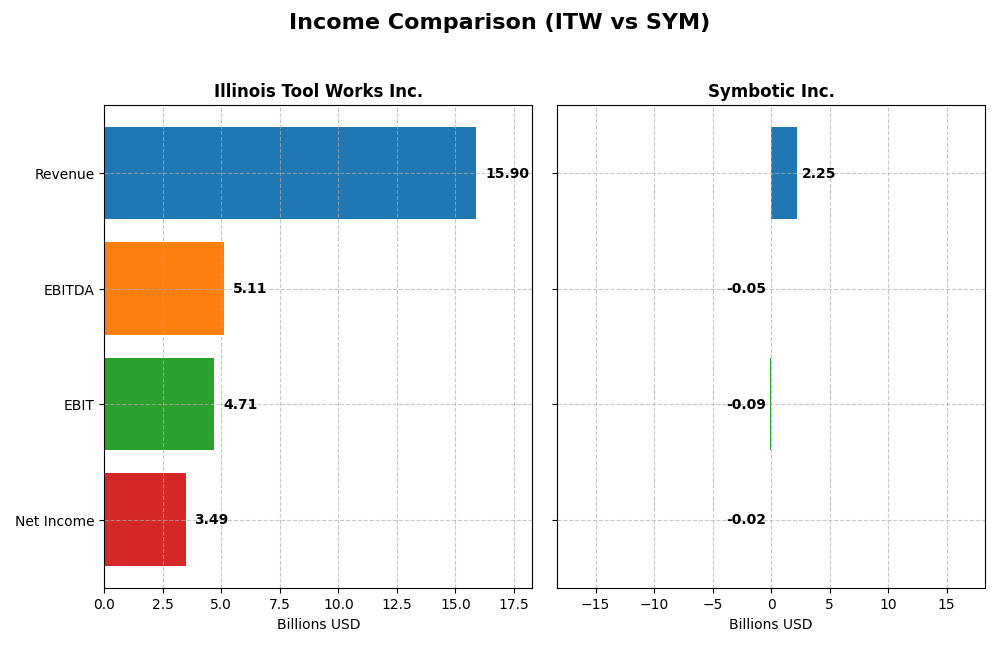
This table presents the key income statement metrics for Illinois Tool Works Inc. and Symbotic Inc. for their most recent fiscal years, providing a clear financial snapshot for comparison.
| Metric | Illinois Tool Works Inc. | Symbotic Inc. |
|---|---|---|
| Market Cap | 74.7B | 42.8B |
| Revenue | 15.9B | 2.2B |
| EBITDA | 5.11B | -48.0M |
| EBIT | 4.71B | -92.1M |
| Net Income | 3.49B | -16.9M |
| EPS | 11.75 | -0.16 |
| Fiscal Year | 2024 | 2025 |
Income Statement Interpretations
Illinois Tool Works Inc.
Illinois Tool Works (ITW) showed steady revenue growth of 26.44% from 2020 to 2024, despite a slight 1.3% revenue decline in the last year. Net income increased by 65.39% over the period, with a 19.51% rise in net margin in 2024. Margins remain strong, supported by a favorable gross margin of 43.65% and an EBIT margin near 29.6%, indicating operational efficiency improvements.
Symbotic Inc.
Symbotic (SYM) experienced rapid revenue expansion of 792% from 2021 to 2025, with a 25.65% increase in the last year. However, it reported negative EBIT margins at -4.1% and a net margin of -0.75% in 2025, reflecting ongoing losses. Despite favorable growth in gross profit and net income over the period, recent profitability remains challenged with declining EBIT and earnings per share.
Which one has the stronger fundamentals?
Illinois Tool Works demonstrates stronger fundamentals with consistent profitability, favorable margins, and positive growth in net income and EPS. In contrast, Symbotic’s rapid revenue growth is tempered by persistent negative margins and operating losses. While both companies have favorable overall income statement evaluations, ITW’s stable profitability and margin expansion present a more robust financial profile.
Financial Ratios Comparison
The table below presents key financial ratios for Illinois Tool Works Inc. (ITW) and Symbotic Inc. (SYM) based on their most recent fiscal year data, providing a snapshot of their financial health and operational efficiency.
| Ratios | Illinois Tool Works Inc. (ITW) | Symbotic Inc. (SYM) |
|---|---|---|
| ROE | 105.2% | -7.65% |
| ROIC | 27.2% | -16.6% |
| P/E | 21.6 | -334.5 |
| P/B | 22.7 | 25.6 |
| Current Ratio | 1.36 | 1.08 |
| Quick Ratio | 0.99 | 0.99 |
| D/E (Debt-to-Equity) | 2.44 | 0.14 |
| Debt-to-Assets | 53.6% | 1.3% |
| Interest Coverage | 15.1 | 0 |
| Asset Turnover | 1.06 | 0.94 |
| Fixed Asset Turnover | 6.91 | 15.9 |
| Payout Ratio | 48.6% | 0% |
| Dividend Yield | 2.25% | 0% |
Interpretation of the Ratios
Illinois Tool Works Inc.
Illinois Tool Works exhibits mostly favorable ratios, with a strong net margin of 21.94% and an impressive return on equity of 105.16%. Concerns arise from its high debt-to-equity ratio of 2.44 and a debt-to-assets ratio of 53.61%, both marked unfavorable. The dividend yield is a favorable 2.25%, supported by a consistent payout strategy, reflecting steady shareholder returns without excessive risk.
Symbotic Inc.
Symbotic shows several unfavorable profitability ratios, including a negative net margin of -0.75% and a return on equity of -7.65%, indicating operational challenges. Its low debt-to-equity ratio of 0.14 is favorable, suggesting conservative leverage. The company does not pay dividends, likely due to negative net income and ongoing reinvestment in growth and R&D, prioritizing long-term value creation over immediate shareholder returns.
Which one has the best ratios?
Illinois Tool Works has a more balanced and stronger ratio profile, with half of its metrics favorable and a slightly favorable overall rating, despite some debt concerns. Symbotic, by contrast, faces profitability struggles and a slightly unfavorable rating, reflecting higher risk and volatility. Based purely on ratios, Illinois Tool Works presents a more robust financial standing.
Strategic Positioning
This section compares the strategic positioning of Illinois Tool Works Inc. and Symbotic Inc. regarding market position, key segments, and exposure to technological disruption:
Illinois Tool Works Inc. (ITW)
- Well-established industrial machinery leader with broad market presence and moderate competitive pressure.
- Diverse business drivers including automotive OEM, food equipment, welding, construction, and specialty products.
- Moderate exposure through industrial product innovation but not primarily tech-disruptive.
Symbotic Inc. (SYM)
- Emerging automation technology firm focused on warehouse efficiency with high competitive pressure.
- Concentrated on robotics and automation systems for retailers and wholesalers.
- High exposure due to focus on advanced robotics and warehouse automation technologies.
ITW vs SYM Positioning
ITW’s strategy is diversified across multiple industrial segments, offering stability through various revenue streams, whereas SYM concentrates on automation technology, aiming for growth in a niche market. ITW benefits from broad market coverage; SYM faces higher volatility due to narrower focus.
Which has the best competitive advantage?
ITW demonstrates a durable competitive advantage with growing ROIC and value creation, while SYM shows declining profitability and value destruction, indicating ITW has the stronger competitive moat based on current MOAT evaluations.
Stock Comparison
The stock price chart highlights significant divergences in price movements and trading dynamics between Illinois Tool Works Inc. and Symbotic Inc. over the past year, reflecting contrasting bullish trends and volume behaviors.
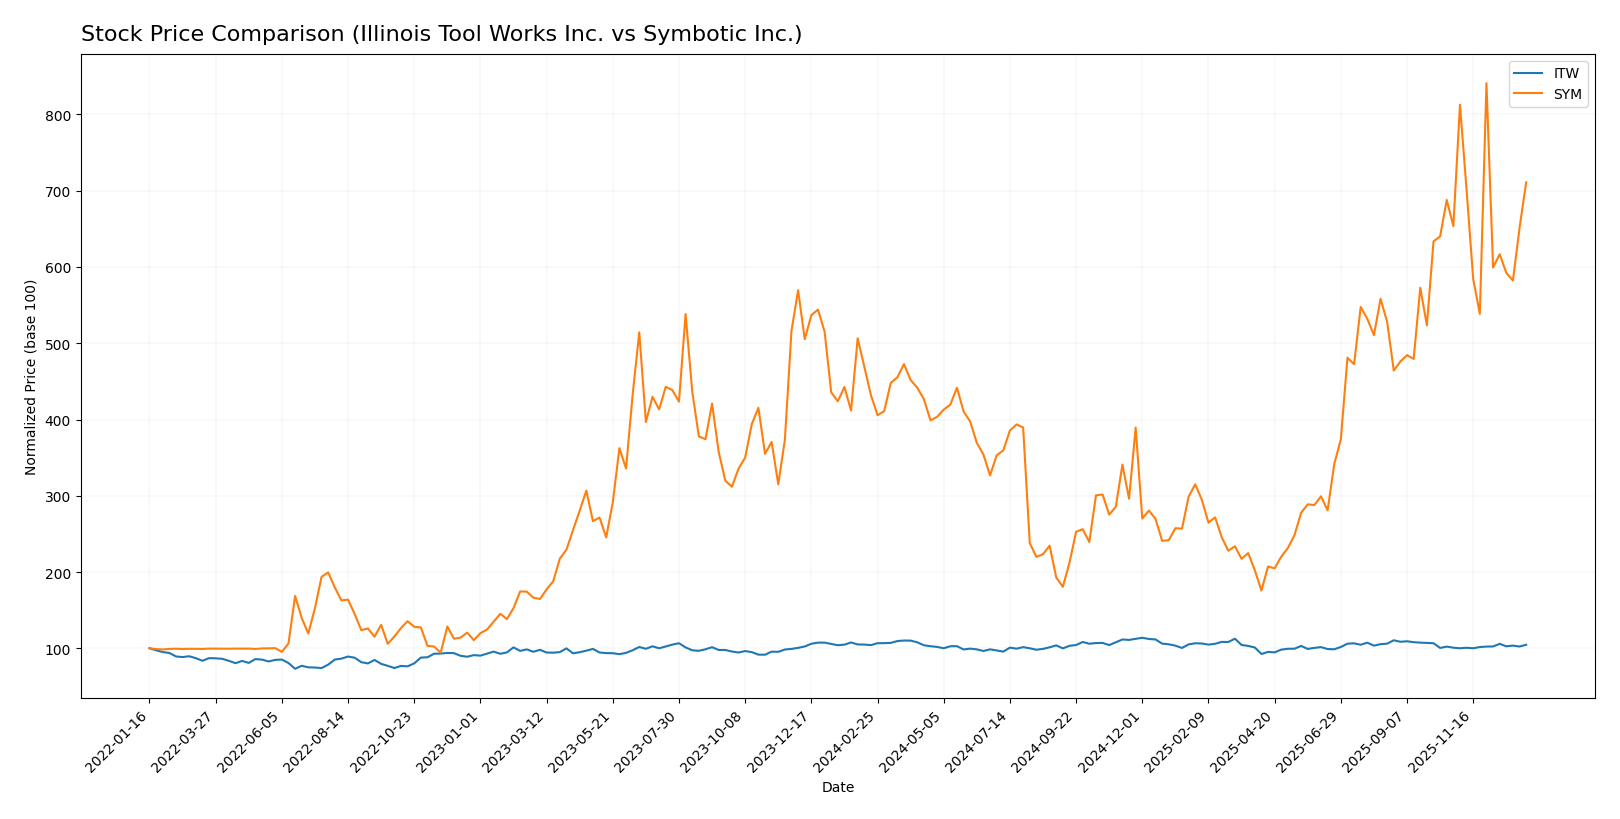
Trend Analysis
Illinois Tool Works Inc. showed a modest 0.47% price increase over the past 12 months, indicating a neutral overall trend with acceleration and a price range between 225.57 and 277.52.
Symbotic Inc. experienced a strong 64.58% price rise over the same period, confirming a bullish trend with deceleration and a wider price range from 17.5 to 83.77.
Comparing both stocks, Symbotic delivered the highest market performance over the past year, significantly outperforming Illinois Tool Works in price appreciation.
Target Prices
Analysts present a clear consensus on target prices for Illinois Tool Works Inc. and Symbotic Inc., reflecting a moderate upside potential for both stocks.
| Company | Target High | Target Low | Consensus |
|---|---|---|---|
| Illinois Tool Works Inc. | 275 | 230 | 254 |
| Symbotic Inc. | 83 | 41 | 65.11 |
The consensus target price for Illinois Tool Works Inc. at 254 is very close to its current price of 255.12, indicating a balanced market view. Symbotic Inc.’s consensus target of 65.11 suggests a downside compared to its current price of 70.82, signaling cautious sentiment from analysts.
Analyst Opinions Comparison
This section compares analysts’ ratings and grades for Illinois Tool Works Inc. (ITW) and Symbotic Inc. (SYM):
Rating Comparison
ITW Rating
- Rating: B, considered very favorable overall.
- Discounted Cash Flow Score: Moderate at 3.
- ROE Score: Very favorable at 5, indicating strong profit generation from equity.
- ROA Score: Very favorable at 5, showing efficient use of assets.
- Debt To Equity Score: Very unfavorable at 1, indicating higher financial risk.
- Overall Score: Moderate at 3.
SYM Rating
- Rating: C+, also considered very favorable overall.
- Discounted Cash Flow Score: Very favorable at 5.
- ROE Score: Very unfavorable at 1, indicating weak profit generation from equity.
- ROA Score: Very unfavorable at 1, showing poor asset utilization.
- Debt To Equity Score: Moderate at 3, indicating moderate financial risk.
- Overall Score: Moderate at 2.
Which one is the best rated?
Based strictly on the data, ITW holds a better overall rating (B vs. C+) and excels in ROE and ROA with very favorable scores. SYM leads only in discounted cash flow but has weaker profitability and asset use scores.
Scores Comparison
The following table compares the Altman Z-Score and Piotroski Score for Illinois Tool Works (ITW) and Symbotic (SYM):
ITW Scores
- Altman Z-Score: 7.93, in safe zone, low bankruptcy risk.
- Piotroski Score: 7, indicating strong financial health.
SYM Scores
- Altman Z-Score: 13.05, in safe zone, very low bankruptcy risk.
- Piotroski Score: 3, indicating very weak financial health.
Which company has the best scores?
SYM has a higher Altman Z-Score indicating very low bankruptcy risk, but ITW’s Piotroski Score is significantly stronger, reflecting better overall financial health based on the provided data.
Grades Comparison
The recent grades from major financial institutions for Illinois Tool Works Inc. and Symbotic Inc. are as follows:
Illinois Tool Works Inc. Grades
The table below summarizes recent grades and rating actions for Illinois Tool Works Inc.:
| Grading Company | Action | New Grade | Date |
|---|---|---|---|
| Wells Fargo | Maintain | Underweight | 2026-01-07 |
| Goldman Sachs | Downgrade | Sell | 2025-12-16 |
| B of A Securities | Upgrade | Neutral | 2025-11-18 |
| Barclays | Maintain | Underweight | 2025-10-27 |
| Truist Securities | Maintain | Hold | 2025-10-27 |
| Wells Fargo | Maintain | Underweight | 2025-10-27 |
| Truist Securities | Maintain | Hold | 2025-10-08 |
| Barclays | Downgrade | Underweight | 2025-08-14 |
| Barclays | Maintain | Equal Weight | 2025-08-04 |
| UBS | Maintain | Neutral | 2025-07-31 |
Overall, Illinois Tool Works Inc. shows a predominantly cautious to negative consensus, with multiple underweight and sell ratings.
Symbotic Inc. Grades
The table below summarizes recent grades and rating actions for Symbotic Inc.:
| Grading Company | Action | New Grade | Date |
|---|---|---|---|
| Goldman Sachs | Downgrade | Sell | 2025-12-02 |
| Barclays | Maintain | Underweight | 2025-11-26 |
| Baird | Maintain | Neutral | 2025-11-26 |
| Craig-Hallum | Upgrade | Buy | 2025-11-25 |
| Northland Capital Markets | Maintain | Outperform | 2025-11-25 |
| Needham | Maintain | Buy | 2025-11-25 |
| Cantor Fitzgerald | Maintain | Overweight | 2025-11-25 |
| DA Davidson | Maintain | Neutral | 2025-11-25 |
| Citigroup | Maintain | Buy | 2025-11-25 |
| UBS | Downgrade | Sell | 2025-09-23 |
Symbotic Inc. exhibits a mixed but generally more positive rating environment, with several buy and outperform grades alongside some sell ratings.
Which company has the best grades?
Symbotic Inc. has received generally more favorable grades, with a consensus buy rating supported by multiple buy and outperform recommendations. Illinois Tool Works Inc. exhibits a more cautious stance with a consensus hold and more sell or underweight ratings. These differences may influence investors’ perception of growth potential and risk between the two companies.
Strengths and Weaknesses
Below is a comparative table highlighting key strengths and weaknesses of Illinois Tool Works Inc. (ITW) and Symbotic Inc. (SYM) based on their latest financial and operational data.
| Criterion | Illinois Tool Works Inc. (ITW) | Symbotic Inc. (SYM) |
|---|---|---|
| Diversification | Highly diversified with 7 main segments including Automotive, Food Equipment, and Electronics, generating $17B+ in annual revenue | Limited diversification; primary revenue from Systems (~$2.1B in 2025) with smaller contributions from Operation Services and Software Maintenance |
| Profitability | Strong profitability: Net margin 21.94%, ROIC 27.19%, ROE 105.16%, consistently creating value | Negative profitability: Net margin -0.75%, ROIC -16.63%, ROE -7.65%, value destroying with declining profits |
| Innovation | Established industry player with steady investment and durable competitive advantage reflected in growing ROIC (+62%) | Early-stage or growth company with high volatility and negative ROIC trend (-108%), indicating challenges in profitability and innovation payoffs |
| Global presence | Broad global footprint with multiple segments serving diverse industries worldwide | More concentrated market presence, less global diversification evident from segment data |
| Market Share | Strong market share in various industrial segments, supported by consistent revenue growth across segments | Emerging market share with rapid but uneven revenue growth, primarily in automation and systems |
Key takeaways: Illinois Tool Works delivers a well-diversified, profitable, and globally established business with a durable moat and strong financial ratios. Symbotic, while innovating in automation and systems, shows significant profitability challenges and a narrow revenue base, indicating higher investment risk.
Risk Analysis
Below is a comparison of key risks for Illinois Tool Works Inc. (ITW) and Symbotic Inc. (SYM) based on the most recent data available for 2025-2026:
| Metric | Illinois Tool Works Inc. (ITW) | Symbotic Inc. (SYM) |
|---|---|---|
| Market Risk | Beta 1.17, moderate volatility | Beta 2.14, high volatility |
| Debt level | High leverage (D/E 2.44, Debt/Assets 54%) | Low leverage (D/E 0.14, Debt/Assets 1.3%) |
| Regulatory Risk | Moderate, industrial standards and environmental regulations | Moderate, emerging tech and automation regulations |
| Operational Risk | Diverse industrial operations, moderate complexity | High, reliant on advanced robotics and tech execution |
| Environmental Risk | Moderate, industrial manufacturing footprint | Low to moderate, tech-focused but energy intensive |
| Geopolitical Risk | Moderate exposure via global supply chains | Lower exposure, mostly US-based operations |
The most impactful risks are ITW’s high debt level, which could pressure financial stability despite strong profitability, and SYM’s operational and market risk due to its high beta and unprofitable status in 2025. Investors should weigh ITW’s financial strength against its leverage and SYM’s growth potential against its current losses and operational challenges.
Which Stock to Choose?
Illinois Tool Works Inc. (ITW) shows a generally favorable income evolution with strong growth in net income and EPS over 2020-2024. Its financial ratios reveal solid profitability and efficiency but elevated debt levels. The company holds a very favorable moat rating and a moderate overall rating “B”.
Symbotic Inc. (SYM) displays rapid revenue and net income growth overall but negative profitability and declining ROIC. Its financial ratios are mixed with some favorable leverage metrics but many unfavorable profitability indicators. The moat rating is very unfavorable, though the overall rating “C+” is still considered very favorable.
For investors prioritizing stable profitability and durable competitive advantage, ITW might appear more favorable based on its strong moat and income quality. Conversely, those focused on high growth potential despite profitability challenges may find SYM’s rapid expansion and favorable debt metrics worth consideration, recognizing the associated risks.
Disclaimer: Investment carries a risk of loss of initial capital. The past performance is not a reliable indicator of future results. Be sure to understand risks before making an investment decision.
Go Further
I encourage you to read the complete analyses of Illinois Tool Works Inc. and Symbotic Inc. to enhance your investment decisions: