Home > Comparison > Industrials > ITW vs ROP
The strategic rivalry between Illinois Tool Works Inc. and Roper Technologies, Inc. shapes the industrial machinery sector’s evolution. Illinois Tool Works operates as a diversified, capital-intensive manufacturer serving automotive and construction markets. In contrast, Roper Technologies focuses on high-margin software and engineered solutions, emphasizing technology integration. This analysis will assess which company’s business model offers a superior risk-adjusted return, guiding investors seeking durable industrial exposure in 2026.
Table of contents
Companies Overview
Illinois Tool Works Inc. and Roper Technologies, Inc. stand as influential players in the industrial machinery sector.
Illinois Tool Works Inc.: Diverse Industrial Powerhouse
Illinois Tool Works Inc. dominates industrial machinery with a broad portfolio. Its core revenue derives from seven segments, including automotive OEM components and food equipment. In 2026, it focuses strategically on expanding engineered fastening systems and specialty products, serving diverse end markets globally. The company’s broad industrial footprint underpins its solid market position.
Roper Technologies, Inc.: Software-Driven Industrial Innovator
Roper Technologies, Inc. leads by integrating software with engineered products. It generates revenue from cloud-based software solutions and precision instruments across various industries. In 2026, Roper prioritizes growth in cloud analytics and specialized industrial equipment. Its hybrid model combining software and hardware differentiates it in the industrial machinery landscape.
Strategic Collision: Similarities & Divergences
Both companies operate in industrial machinery but diverge fundamentally: Illinois Tool Works emphasizes physical product diversity, while Roper leans into software-enabled solutions. They compete primarily in advanced industrial equipment and technology integration. Investors face contrasting profiles—Illinois Tool Works offers broad industrial exposure, whereas Roper presents growth potential through innovative software platforms.
Income Statement Comparison
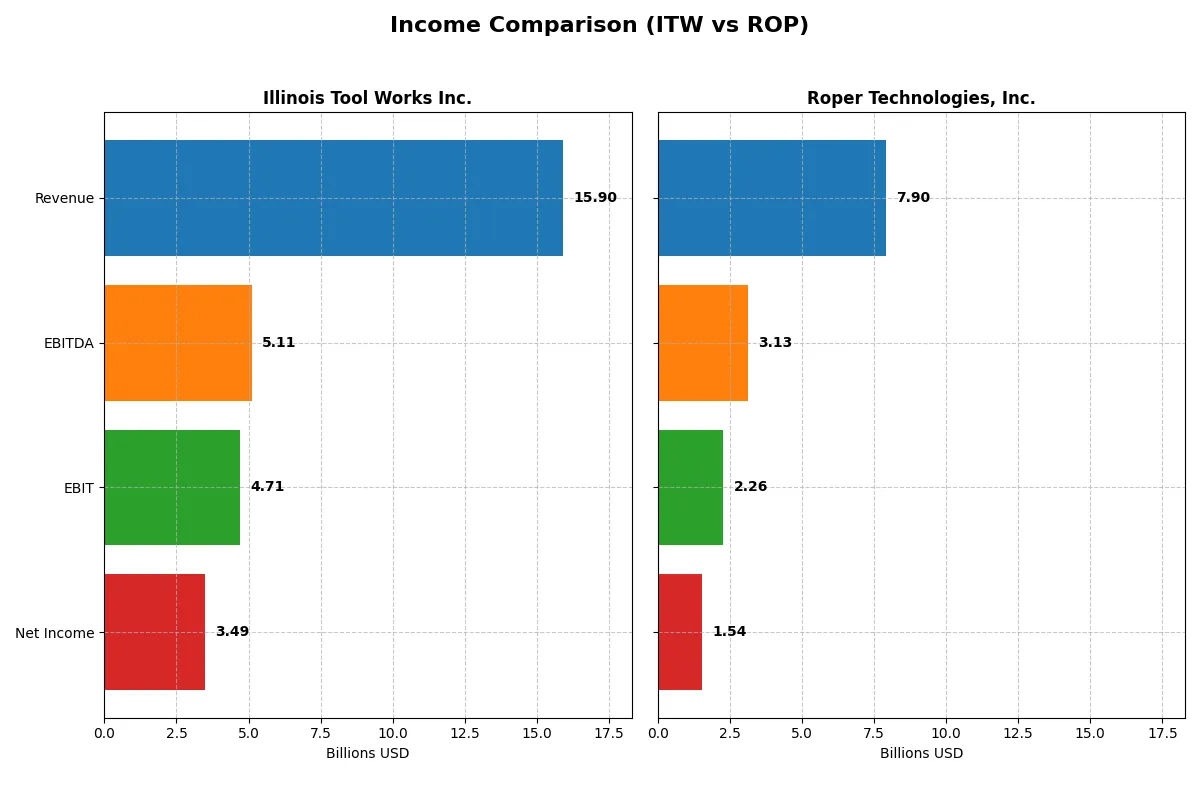
The following data dissects the core profitability and scalability of both corporate engines to reveal who dominates the bottom line:
| Metric | Illinois Tool Works Inc. (ITW) | Roper Technologies, Inc. (ROP) |
|---|---|---|
| Revenue | 15.9B | 7.9B |
| Cost of Revenue | 8.96B | 2.43B |
| Operating Expenses | 2.68B | 3.24B |
| Gross Profit | 6.94B | 5.47B |
| EBITDA | 5.11B | 3.13B |
| EBIT | 4.71B | 2.26B |
| Interest Expense | 0.28B | 0.33B |
| Net Income | 3.49B | 1.54B |
| EPS | 11.75 | 14.31 |
| Fiscal Year | 2024 | 2025 |
Income Statement Analysis: The Bottom-Line Duel
This income statement comparison reveals how efficiently Illinois Tool Works and Roper Technologies convert revenue into profits amid evolving market conditions.
Illinois Tool Works Inc. Analysis
Illinois Tool Works (ITW) grew revenue by 26% from 2020 to 2024, reaching $15.9B in 2024. Net income surged 65% over this period, hitting $3.5B last year. ITW’s gross margin stayed healthy at 43.7%, while net margin expanded to 22%. The 2024 results show improved operating efficiency with EBIT up 15%, signaling strong profit momentum despite a slight revenue dip.
Roper Technologies, Inc. Analysis
Roper Technologies (ROP) posted a 63% revenue increase from 2021 to 2025, culminating at $7.9B in 2025. Net income rose 40% over the period, reaching $1.5B last year. ROP’s gross margin stands at an impressive 69.2%, with a solid EBIT margin near 28.6%. However, net margin contracted 14% overall, reflecting rising operating expenses and recent margin pressures despite consistent top-line growth.
Margin Discipline vs. Growth Trajectory
ITW delivers superior margin expansion and bottom-line growth, benefiting from disciplined cost control and margin stability. ROP drives faster revenue gains with higher gross margins but faces margin erosion from rising expenses. For investors prioritizing profitability and efficiency, ITW’s profile offers greater fundamental strength. Growth-focused investors may appreciate ROP’s top-line momentum despite margin headwinds.
Financial Ratios Comparison
These vital ratios act as a diagnostic tool to expose the underlying fiscal health, valuation premiums, and capital efficiency of the companies compared below:
| Ratios | Illinois Tool Works Inc. (ITW) | Roper Technologies, Inc. (ROP) |
|---|---|---|
| ROE | 105.2% | 8.2% |
| ROIC | 27.2% | 5.5% |
| P/E | 21.6 | 35.9 |
| P/B | 22.7 | 3.0 |
| Current Ratio | 1.36 | 0.40 |
| Quick Ratio | 0.99 | 0.37 |
| D/E (Debt-to-Equity) | 2.44 | 0.41 |
| Debt-to-Assets | 53.6% | 24.5% |
| Interest Coverage | 15.1 | 7.7 |
| Asset Turnover | 1.06 | 0.22 |
| Fixed Asset Turnover | 6.91 | 47.0 |
| Payout Ratio | 48.6% | 20.8% |
| Dividend Yield | 2.25% | 0.58% |
| Fiscal Year | 2024 | 2024 |
Efficiency & Valuation Duel: The Vital Signs
Financial ratios form the company’s DNA, unveiling hidden risks and operational strengths that shape investment outcomes.
Illinois Tool Works Inc.
Illinois Tool Works displays robust profitability with a 105.19% ROE and a strong 21.94% net margin, indicating operational efficiency. Its P/E ratio at 21.58 suggests a fairly valued stock, though a high P/B ratio signals premium pricing. The company rewards shareholders with a 2.25% dividend yield, balancing income with reinvestment in growth.
Roper Technologies, Inc.
Roper shows a favorable 19.44% net margin but lacks reported ROE and ROIC data, clouding profitability insights. Its elevated P/E of 31.06 signals an expensive valuation. The dividend yield at 0.74% is modest, reflecting limited income distribution while focusing on R&D intensity. Liquidity concerns arise from zero current and quick ratios.
Valuation Discipline vs. Growth Ambiguity
Illinois Tool Works offers a clearer profitability profile and balanced valuation, with moderate risks in leverage and premium book value. Roper’s high valuation paired with missing profitability metrics and weak liquidity ratios suggests greater risk. Investors prioritizing operational clarity may prefer Illinois Tool Works; those seeking growth with caution should scrutinize Roper’s fundamentals further.
Which one offers the Superior Shareholder Reward?
I compare Illinois Tool Works (ITW) and Roper Technologies (ROP) on dividends, payout ratios, and buybacks. ITW yields 2.25% with a 49% payout ratio, well-covered by free cash flow. ROP yields 0.74% with a 23% payout, retaining more for growth. Both deploy buybacks, but ITW’s mature payout and steady buybacks offer a reliable income stream. ROP’s lower yield and payout reflect reinvestment in high-margin, asset-light growth. Historically, ITW’s model suits income-focused investors; ROP targets capital gains. For 2026, I favor ITW for total shareholder return due to its sustainable, balanced distribution and buyback intensity.
Comparative Score Analysis: The Strategic Profile
The radar chart reveals the fundamental DNA and trade-offs of Illinois Tool Works Inc. and Roper Technologies, Inc., highlighting their strategic strengths and vulnerabilities:
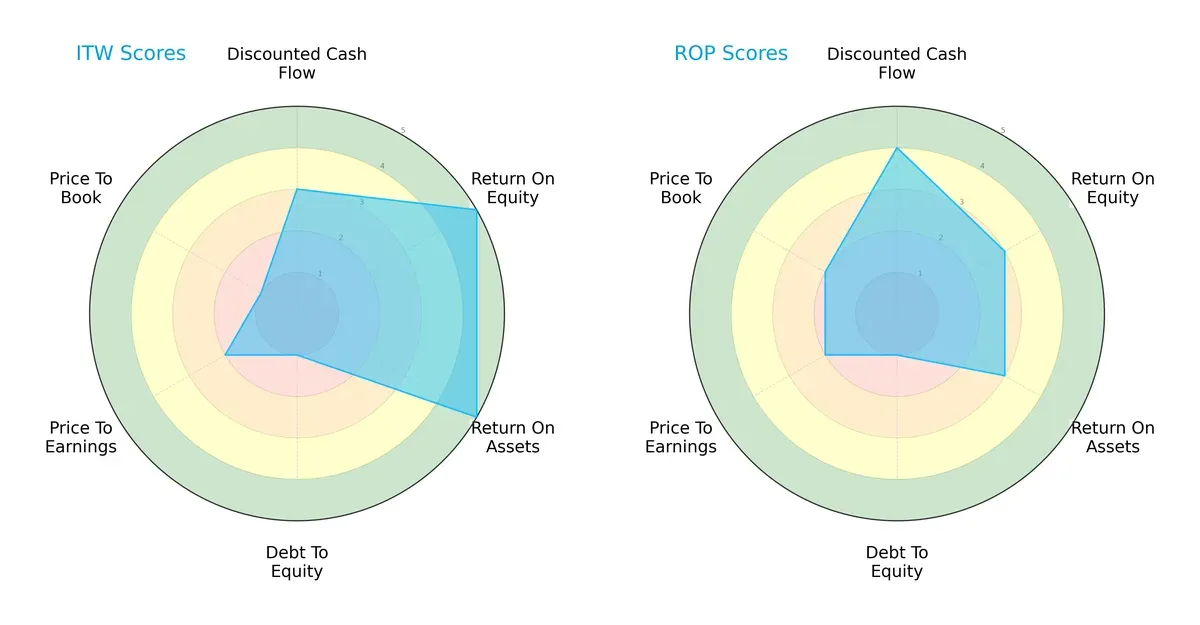
Illinois Tool Works excels in profitability metrics with top ROE and ROA scores of 5, indicating superior operational efficiency. In contrast, Roper shows strength in discounted cash flow valuation (score 4), suggesting better future cash flow prospects. Both firms suffer from weak debt-to-equity scores (1), signaling high leverage risk. ITW’s valuation scores lag further with very unfavorable P/B, while Roper fares moderately better. Overall, ITW’s profile is more skewed toward operational excellence, while Roper maintains a more balanced, valuation-driven stance.
—
Bankruptcy Risk: Solvency Showdown
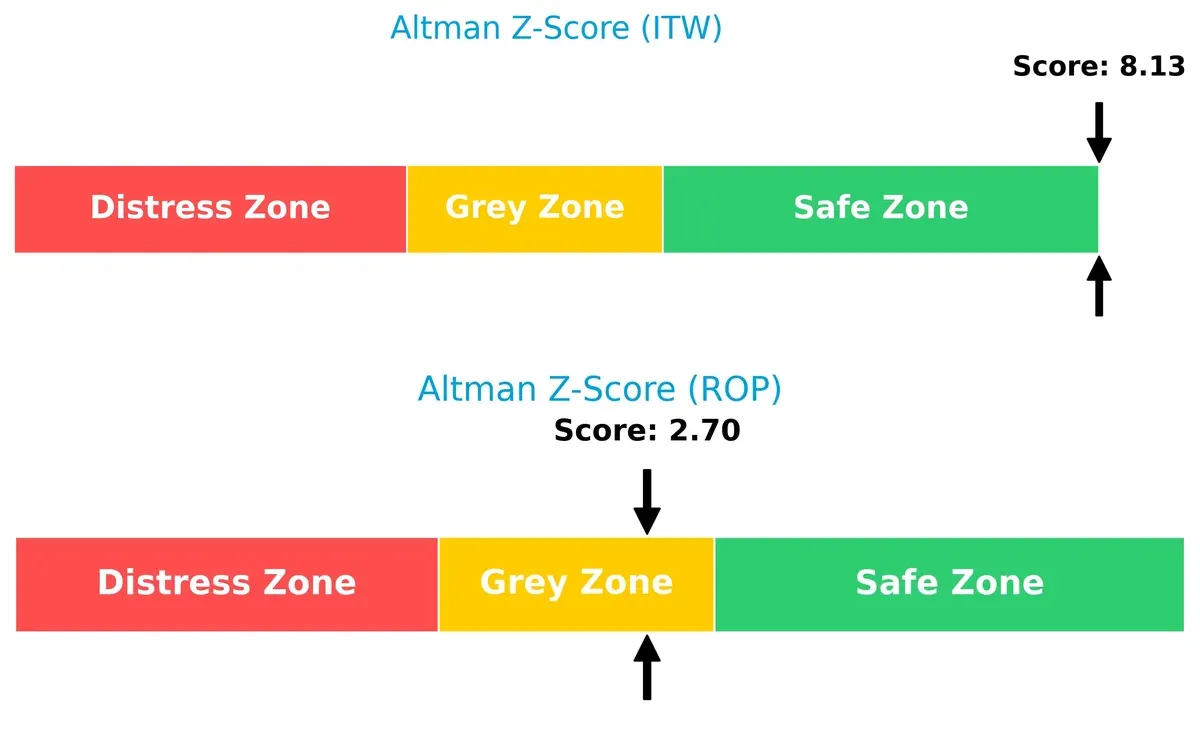
Illinois Tool Works’ Altman Z-Score of 8.13 places it securely in the safe zone, while Roper’s 2.70 hovers in the grey zone, implying higher bankruptcy risk in volatile cycles:
—
Financial Health: Quality of Operations
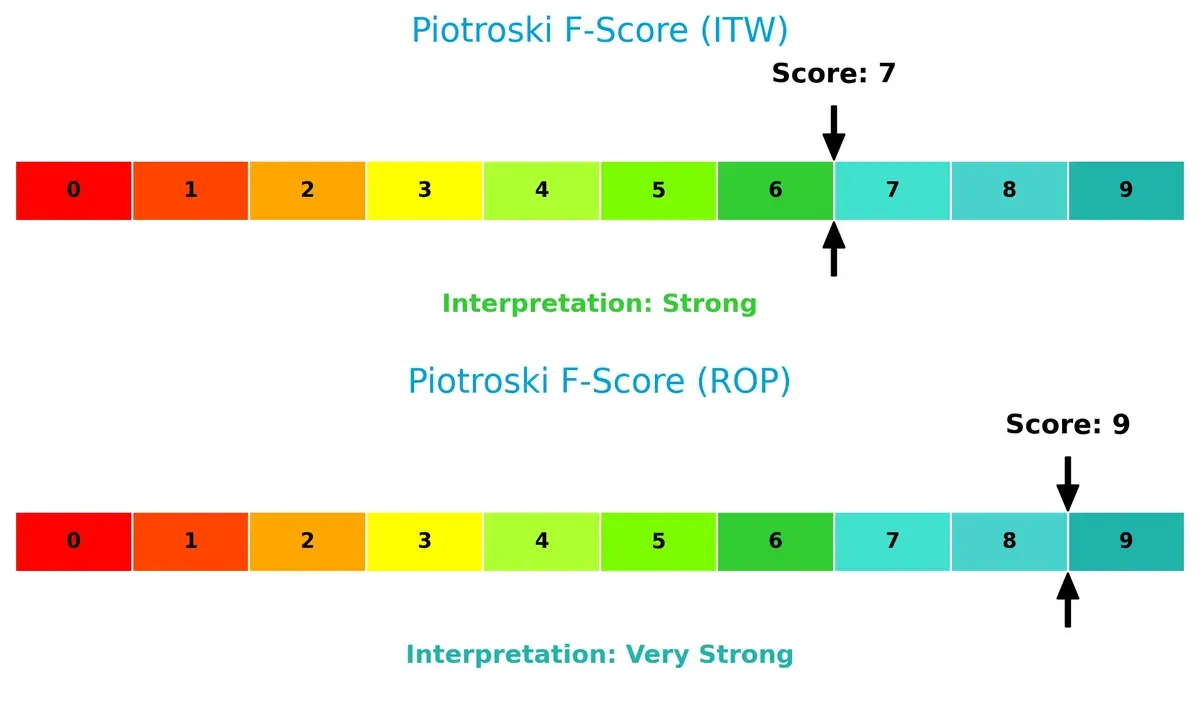
Roper’s Piotroski F-Score of 9 signals very strong financial health, surpassing Illinois Tool Works’ strong but lower score of 7. This suggests Roper maintains tighter control over profitability, leverage, liquidity, and operational efficiency:
How are the two companies positioned?
This section dissects the operational DNA of ITW and ROP by comparing their revenue distribution and their internal dynamics of strengths and weaknesses. The goal is to confront their economic moats to reveal which business model offers the most resilient, sustainable competitive advantage today.
Revenue Segmentation: The Strategic Mix
This visual comparison dissects how Illinois Tool Works Inc. and Roper Technologies, Inc. diversify their income streams and where their primary sector bets lie:
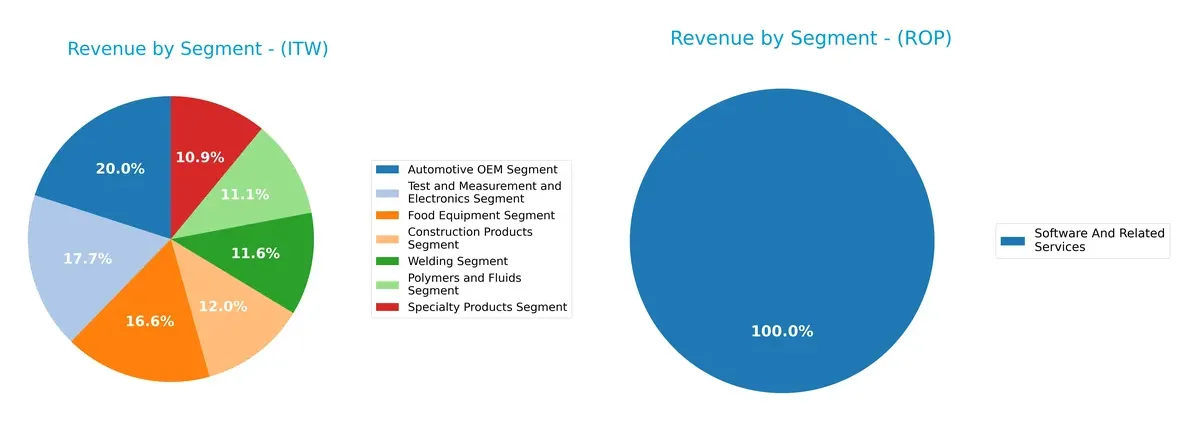
Illinois Tool Works displays a highly diversified revenue mix, with no single segment dominating above $3.2B, spanning Automotive OEM, Food Equipment, and Test and Measurement. In contrast, Roper Technologies anchors its revenue heavily in Software and Related Services, reaching $10.7B in 2024, signaling a strong ecosystem lock-in. Illinois Tool Works’ broad industrial base mitigates concentration risk, while Roper’s focus leverages high-margin software dominance but faces sector-specific exposure.
Strengths and Weaknesses Comparison
The table compares the Strengths and Weaknesses of Illinois Tool Works Inc. (ITW) and Roper Technologies, Inc. (ROP):
ITW Strengths
- Diverse revenue streams across 7 segments
- Favorable net margin at 21.94%
- High ROE at 105.19% and ROIC at 27.19%
- Strong interest coverage of 16.63x
- Significant global presence with substantial revenue in North America, Europe, Asia Pacific
ROP Strengths
- Large revenue base focused on software and related services
- Favorable net margin at 19.44%
- Favorable debt metrics with low leverage
- Interest coverage of 6.96x
- Concentrated US market presence with over 6B revenue
ITW Weaknesses
- High debt-to-equity ratio at 2.44 and debt-to-assets at 53.61%
- Unfavorable price-to-book at 22.69
- Neutral liquidity ratios (current 1.36, quick 0.99)
- Dividend yield higher but may pressure cash flow
ROP Weaknesses
- Zero reported ROE and ROIC indicate potential profitability or reporting concerns
- Unfavorable P/E at 31.06
- Unavailable liquidity ratios (current and quick ratios at 0)
- Low dividend yield at 0.74%
- Limited diversification with heavy reliance on software segment
ITW demonstrates robust profitability and diversification with some financial leverage concerns. ROP’s strengths lie in software focus and low debt but faces challenges in profitability metrics and liquidity transparency. These profiles imply different strategic priorities for risk and growth management.
The Moat Duel: Analyzing Competitive Defensibility
A structural moat is the sole shield protecting long-term profits from competitors’ relentless pressure and market disruption:
Illinois Tool Works Inc. (ITW): Diversified Industrial Moat through Intangible Assets
ITW’s competitive edge stems from strong intangible assets and specialized industrial products. Its financials show rising ROIC well above WACC, signaling durable value creation. Expansion in emerging markets could deepen this moat in 2026.
Roper Technologies, Inc. (ROP): Niche Software and Engineered Products Moat
ROP relies on proprietary software and engineered solutions, contrasting ITW’s industrial breadth. Despite solid margins, its ROIC trend declines, raising caution. New cloud services may offer growth but face stiff competition.
Moat Mastery: Industrial Diversification vs. Software Specialization
ITW exhibits a wider, deeper moat with growing ROIC and consistent value creation. ROP’s narrowing ROIC suggests weaker moat durability. ITW stands better equipped to defend its market share long term.
Which stock offers better returns?
The past year shows contrasting price movements: Illinois Tool Works Inc. edges higher with accelerating gains, while Roper Technologies, Inc. experiences a marked decline and slowing losses.
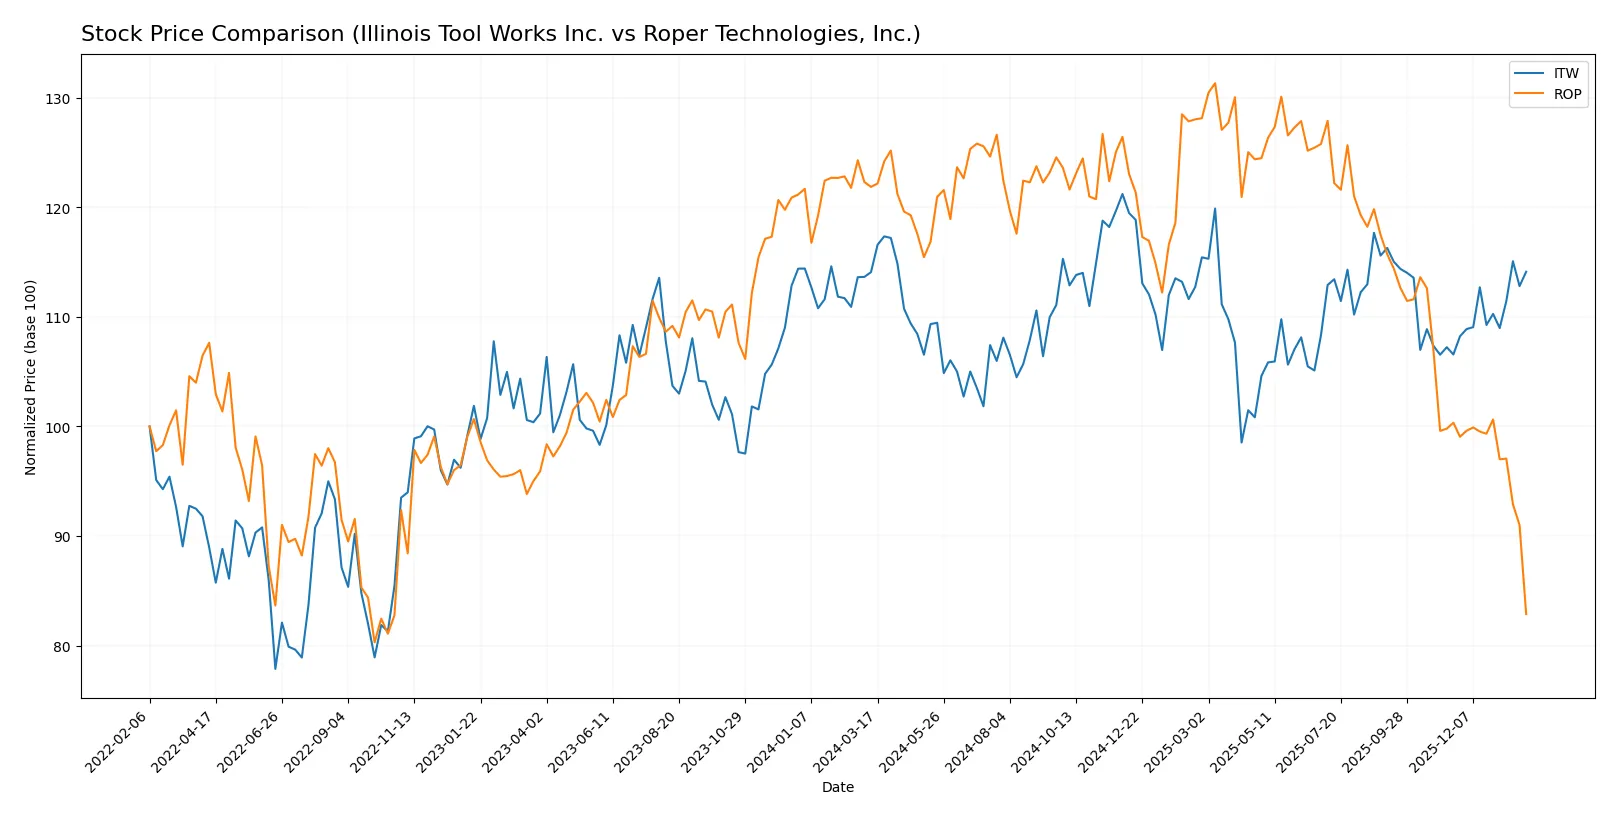
Trend Comparison
Illinois Tool Works Inc. posts a modest 0.03% price increase over the past 12 months, signaling a bullish trend with accelerating momentum and a relatively low 10.7 volatility measure.
Roper Technologies, Inc. suffers a severe 32% price drop in the same period, indicating a clear bearish trend with decelerating losses and significantly higher volatility at 44.8.
Comparing both, Illinois Tool Works outperforms Roper Technologies, delivering stable gains while Roper faces steep declines and elevated volatility.
Target Prices
Analysts present a mixed but generally optimistic target price consensus for Illinois Tool Works Inc. and Roper Technologies, Inc.
| Company | Target Low | Target High | Consensus |
|---|---|---|---|
| Illinois Tool Works Inc. | 230 | 275 | 254 |
| Roper Technologies, Inc. | 365 | 575 | 475.5 |
The target consensus for ITW at 254 slightly undercuts its current 261 price, suggesting modest upside risk. ROP’s consensus of 475.5 implies significant appreciation potential from its current 371 price.

Don’t Let Luck Decide Your Entry Point
Optimize your entry points with our advanced ProRealTime indicators. You’ll get efficient buy signals with precise price targets for maximum performance. Start outperforming now!
How do institutions grade them?
Illinois Tool Works Inc. Grades
The table below summarizes recent grades from major financial institutions for Illinois Tool Works Inc.:
| Grading Company | Action | New Grade | Date |
|---|---|---|---|
| Wells Fargo | Maintain | Underweight | 2026-01-07 |
| Goldman Sachs | Downgrade | Sell | 2025-12-16 |
| B of A Securities | Upgrade | Neutral | 2025-11-18 |
| Wells Fargo | Maintain | Underweight | 2025-10-27 |
| Truist Securities | Maintain | Hold | 2025-10-27 |
| Barclays | Maintain | Underweight | 2025-10-27 |
| Truist Securities | Maintain | Hold | 2025-10-08 |
| Barclays | Downgrade | Underweight | 2025-08-14 |
| Barclays | Maintain | Equal Weight | 2025-08-04 |
| Stifel | Maintain | Hold | 2025-07-31 |
Roper Technologies, Inc. Grades
The following table presents recent institutional grades for Roper Technologies, Inc.:
| Grading Company | Action | New Grade | Date |
|---|---|---|---|
| Goldman Sachs | Maintain | Neutral | 2026-01-29 |
| Argus Research | Downgrade | Hold | 2026-01-28 |
| Truist Securities | Maintain | Buy | 2026-01-28 |
| Mizuho | Maintain | Underperform | 2026-01-28 |
| Oppenheimer | Downgrade | Perform | 2026-01-28 |
| RBC Capital | Maintain | Sector Perform | 2026-01-28 |
| Barclays | Maintain | Underweight | 2026-01-28 |
| Stifel | Downgrade | Hold | 2026-01-28 |
| Citigroup | Maintain | Buy | 2026-01-28 |
| JP Morgan | Maintain | Underweight | 2026-01-28 |
Which company has the best grades?
Roper Technologies holds relatively better grades, including multiple “Buy” and “Neutral” ratings, compared to Illinois Tool Works’ predominance of “Underweight” and “Sell” grades. This suggests investors may view Roper as having stronger near-term prospects.
Risks specific to each company
The following categories identify the critical pressure points and systemic threats facing both Illinois Tool Works Inc. and Roper Technologies, Inc. in the 2026 market environment:
1. Market & Competition
Illinois Tool Works Inc.
- Faces intense competition in diversified industrial machinery sectors, requiring innovation to sustain leadership.
Roper Technologies, Inc.
- Operates in specialized software and engineered products, contending with fast-evolving tech competitors and market consolidation.
2. Capital Structure & Debt
Illinois Tool Works Inc.
- High debt-to-equity ratio (2.44) signals financial leverage risk despite strong interest coverage.
Roper Technologies, Inc.
- Maintains a conservative debt profile with favorable debt-to-equity metrics, reducing financial risk.
3. Stock Volatility
Illinois Tool Works Inc.
- Beta above 1 (1.159) indicates higher volatility relative to the market, increasing investment risk.
Roper Technologies, Inc.
- Beta below 1 (0.942) suggests lower volatility, offering more stability in turbulent markets.
4. Regulatory & Legal
Illinois Tool Works Inc.
- Exposure to global manufacturing regulations and product safety compliance across multiple segments.
Roper Technologies, Inc.
- Faces regulatory scrutiny in software, healthcare, and data privacy, requiring agile compliance management.
5. Supply Chain & Operations
Illinois Tool Works Inc.
- Complex global supply chain for industrial components vulnerable to disruption and cost inflation.
Roper Technologies, Inc.
- Relies on technology infrastructure and supplier networks, sensitive to cybersecurity and service continuity risks.
6. ESG & Climate Transition
Illinois Tool Works Inc.
- Pressured to improve sustainability in manufacturing processes and reduce carbon footprint amid rising ESG standards.
Roper Technologies, Inc.
- Faces challenges integrating ESG principles in software delivery and energy consumption of data centers.
7. Geopolitical Exposure
Illinois Tool Works Inc.
- Global operations expose it to trade tensions, tariffs, and geopolitical instability impacting industrial markets.
Roper Technologies, Inc.
- Geopolitical risks stem from international software licensing and regulatory environments in key markets.
Which company shows a better risk-adjusted profile?
Illinois Tool Works faces significant financial leverage risk, tempered by strong profitability and operational scale. Roper Technologies presents lower leverage and volatility but grapples with weaker profitability metrics and incomplete liquidity data. I weigh Illinois Tool Works’ superior Altman Z-Score (8.13 safe zone) and strong ROIC (27.19%) against Roper’s moderate Altman Z-Score (2.7 grey zone) and zero reported ROIC, concluding ITW offers a more balanced risk-adjusted profile in 2026. The high debt level at ITW remains a caution, yet its robust operational efficiency and dividend yield (2.25%) justify cautious optimism.
Final Verdict: Which stock to choose?
Illinois Tool Works (ITW) wields unmatched capital efficiency, consistently generating returns well above its cost of capital. Its durable competitive advantage supports steady value creation. A point of vigilance is its elevated leverage, which could amplify risk in downturns. ITW suits portfolios targeting stable, long-term growth with moderate risk tolerance.
Roper Technologies (ROP) boasts a strategic moat through its high-margin, recurring revenue businesses, offering exposure to niche markets with pricing power. Relative to ITW, ROP presents a less stable financial profile and recent declining efficiency metrics. It fits investors seeking growth at a reasonable price, willing to accept higher volatility for potential upside.
If you prioritize durable profitability and capital discipline, ITW outshines with its proven economic moat and stable cash flows. However, if you seek growth potential supported by specialized market niches, ROP offers superior revenue momentum despite financial headwinds. Both stocks present distinct analytical scenarios aligned with different investor risk appetites and time horizons.
Disclaimer: Investment carries a risk of loss of initial capital. The past performance is not a reliable indicator of future results. Be sure to understand risks before making an investment decision.
Go Further
I encourage you to read the complete analyses of Illinois Tool Works Inc. and Roper Technologies, Inc. to enhance your investment decisions: