In the dynamic realm of industrial machinery, Illinois Tool Works Inc. (ITW) and Rockwell Automation, Inc. (ROK) stand out as influential players with overlapping markets and distinct innovation strategies. ITW excels in diversified manufacturing across multiple segments, while Rockwell leads in industrial automation and digital transformation solutions. This analysis will help you discern which company offers the most compelling investment potential in 2026. Let’s explore their strengths and opportunities together.
Table of contents
Companies Overview
I will begin the comparison between Illinois Tool Works Inc. and Rockwell Automation, Inc. by providing an overview of these two companies and their main differences.
Illinois Tool Works Inc. Overview
Illinois Tool Works Inc. manufactures and sells industrial products and equipment worldwide, operating through seven diverse segments including Automotive OEM, Food Equipment, Welding, and Specialty Products. The company serves automotive, commercial food equipment, construction, and industrial markets. Founded in 1912 and based in Glenview, Illinois, ITW leverages a broad product portfolio and extensive distribution channels to maintain its industrial machinery market position.
Rockwell Automation, Inc. Overview
Rockwell Automation, Inc. specializes in industrial automation and digital transformation solutions across three segments: Intelligent Devices, Software & Control, and Lifecycle Services. It serves a wide range of discrete, hybrid, eco industrial, and process end markets globally. Established in 1903 and headquartered in Milwaukee, Wisconsin, Rockwell focuses on integrating hardware, software, and services to optimize industrial operations and efficiency.
Key similarities and differences
Both companies operate in the industrial machinery sector and serve multiple industrial end markets with hardware and software products. However, ITW emphasizes manufacturing diverse industrial components and equipment across several product lines, while Rockwell Automation concentrates on automation and digital solutions, including software and lifecycle services. ITW has a larger workforce and market cap, whereas Rockwell specializes more in technology-driven industrial transformation.
Income Statement Comparison
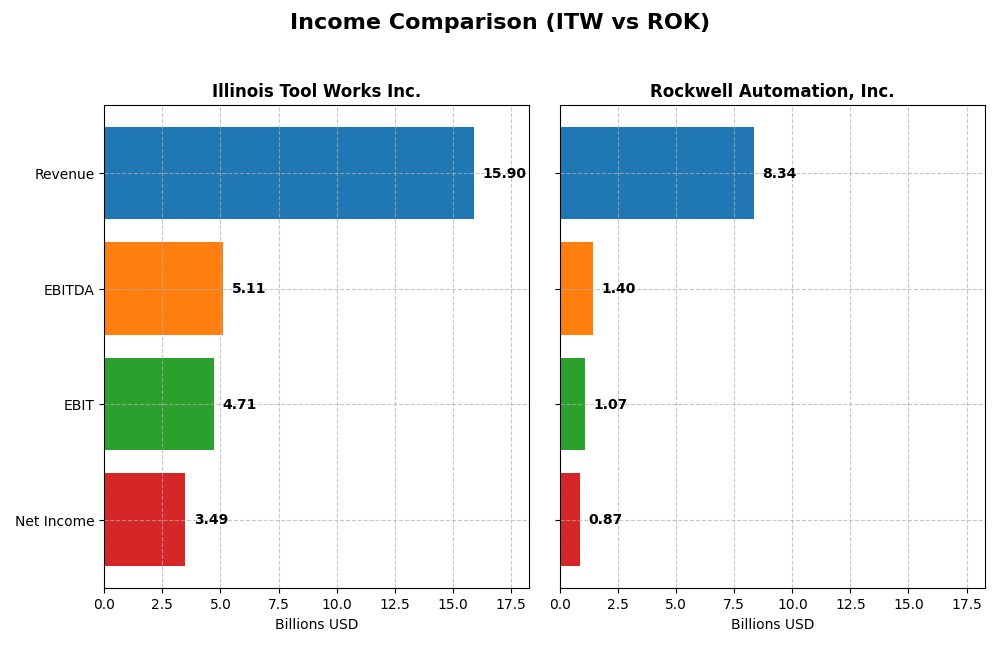
This table presents the most recent fiscal year income statement metrics for Illinois Tool Works Inc. and Rockwell Automation, Inc., providing key financial figures for comparative analysis.
| Metric | Illinois Tool Works Inc. (ITW) | Rockwell Automation, Inc. (ROK) |
|---|---|---|
| Market Cap | 74.7B | 46.1B |
| Revenue | 15.9B | 8.3B |
| EBITDA | 5.11B | 1.40B |
| EBIT | 4.71B | 1.07B |
| Net Income | 3.49B | 0.87B |
| EPS | 11.75 | 7.69 |
| Fiscal Year | 2024 | 2025 |
Income Statement Interpretations
Illinois Tool Works Inc.
Illinois Tool Works Inc. demonstrated consistent revenue growth of 26.4% over five years, despite a slight 1.3% revenue decline in the latest year. Net income grew notably by 65.4% overall, supported by a 21.9% net margin in 2024. Margins improved, with a favorable gross margin of 43.7% and an EBIT margin near 29.6%, reflecting solid operational efficiency in the most recent fiscal year.
Rockwell Automation, Inc.
Rockwell Automation saw a 19.2% revenue increase from 2021 to 2025, with a modest 1% rise in the last year. However, net income declined by 36% overall, and net margin dropped to 10.4%. While the gross margin improved to 48.1%, declines in EBIT and EPS growth in 2025 indicate margin pressures, with EBIT margin at a lower 12.9%, signaling challenges in profitability despite revenue gains.
Which one has the stronger fundamentals?
Illinois Tool Works exhibits stronger fundamentals, with broader favorable trends in margins, net income growth, and operational efficiency. Rockwell Automation’s mixed results, marked by declining net income and margins despite revenue growth, suggest structural profitability issues. The overall income statement evaluation favors Illinois Tool Works with over 78% positive indicators compared to Rockwell’s 43%, highlighting clearer financial resilience.
Financial Ratios Comparison
The table below presents a side-by-side comparison of key financial ratios for Illinois Tool Works Inc. (ITW) and Rockwell Automation, Inc. (ROK) based on the most recent fiscal year data available.
| Ratios | Illinois Tool Works Inc. (ITW) 2024 | Rockwell Automation, Inc. (ROK) 2025 |
|---|---|---|
| ROE | 105.2% | 23.8% |
| ROIC | 27.2% | 13.7% |
| P/E | 21.6 | 45.3 |
| P/B | 22.7 | 10.8 |
| Current Ratio | 1.36 | 1.14 |
| Quick Ratio | 0.99 | 0.77 |
| D/E (Debt-to-Equity) | 2.44 | 1.00 |
| Debt-to-Assets | 53.6% | 32.5% |
| Interest Coverage | 15.1 | 9.1 |
| Asset Turnover | 1.06 | 0.74 |
| Fixed Asset Turnover | 6.91 | 6.95 |
| Payout ratio | 48.6% | 68.0% |
| Dividend yield | 2.25% | 1.50% |
Interpretation of the Ratios
Illinois Tool Works Inc.
Illinois Tool Works Inc. presents strong profitability ratios, including a net margin of 21.94% and an exceptionally high return on equity at 105.16%, indicating efficient use of equity capital. However, concerns arise from its high price-to-book ratio of 22.69 and elevated debt-to-equity ratio of 2.44, reflecting leverage risk. The company maintains a favorable dividend yield of 2.25%, supported by stable payout ratios and share repurchases covered by free cash flow.
Rockwell Automation, Inc.
Rockwell Automation shows moderate profitability with a 10.42% net margin and a return on equity of 23.78%, both favorable but lower than its peer. It faces challenges with a high price-to-earnings ratio of 45.33 and weaker liquidity, including a quick ratio of 0.77. The dividend yield is modest at 1.5%, reflecting a cautious approach to shareholder returns amid ongoing investment in R&D and digital transformation initiatives.
Which one has the best ratios?
Illinois Tool Works displays a more robust profitability profile and stronger coverage ratios, despite higher leverage concerns. Rockwell Automation’s ratios indicate moderate profitability and some liquidity weaknesses, alongside valuation concerns. Both companies are rated slightly favorable overall, but Illinois Tool Works edges ahead due to higher returns and dividend strength, balanced against measured risks.
Strategic Positioning
This section compares the strategic positioning of Illinois Tool Works Inc. and Rockwell Automation, Inc. across market position, key segments, and exposure to technological disruption:
Illinois Tool Works Inc.
- Large market cap of 74B, diversified industrial machinery business facing broad competitive pressures.
- Operates seven segments including Automotive OEM, Food Equipment, Welding, and Specialty Products.
- Moderate exposure via industrial product innovation; digital transformation less central.
Rockwell Automation, Inc.
- Market cap of 46B, focused on industrial automation with moderate competitive pressure.
- Operates three segments: Intelligent Devices, Software & Control, and Lifecycle Services.
- High exposure through software, digital twin, and network security offerings driving disruption.
Illinois Tool Works Inc. vs Rockwell Automation, Inc. Positioning
Illinois Tool Works follows a diversified industrial product strategy across multiple segments, providing broad market coverage but potentially diluting focus. Rockwell Automation concentrates on automation and digital transformation, allowing specialization but higher dependence on technology trends.
Which has the best competitive advantage?
Both companies create value with growing ROIC above WACC, indicating durable moats. Illinois Tool Works shows a higher ROIC gap and steady profitability, suggesting a slightly stronger competitive advantage over Rockwell Automation.
Stock Comparison
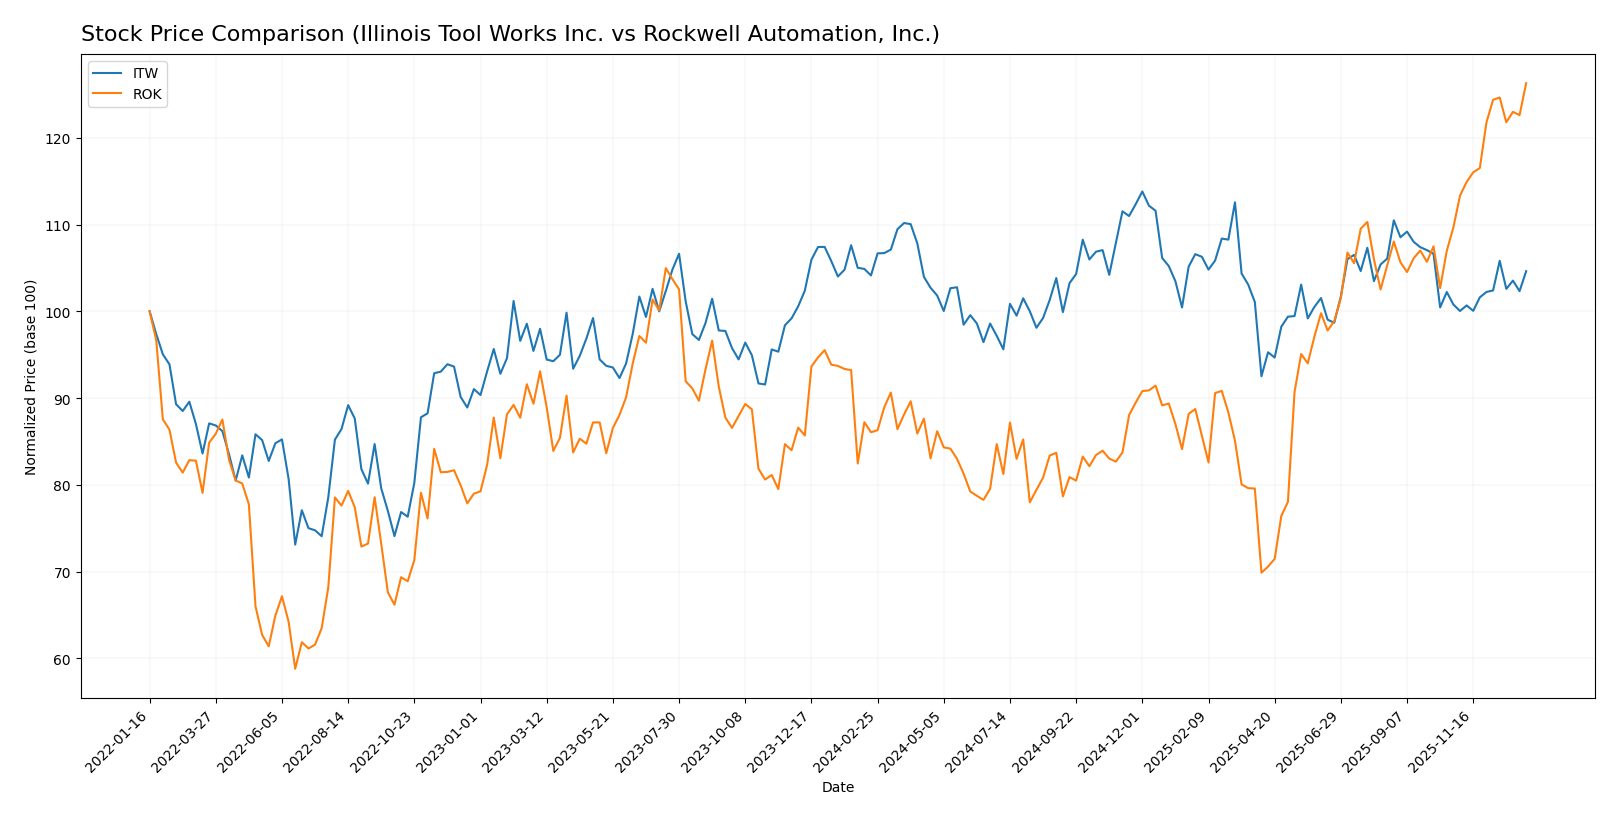
The stock price chart highlights notable price movements and trading dynamics for Illinois Tool Works Inc. and Rockwell Automation, Inc. over the past year, showcasing distinct trend strengths and volume behaviors.
Trend Analysis
Illinois Tool Works Inc. exhibited a 0.47% price increase over the past year, indicating a neutral trend with acceleration and moderate volatility (std dev 10.66). The stock ranged between 225.57 and 277.52.
Rockwell Automation, Inc. posted a strong 46.76% price increase over the past year, reflecting a bullish trend with acceleration and high volatility (std dev 44.57). Price fluctuated between 227.11 and 410.53.
Comparing both, Rockwell Automation, Inc. delivered the highest market performance with a significantly larger price gain and stronger buyer dominance during the period.
Target Prices
The current analyst consensus presents a generally optimistic outlook for both Illinois Tool Works Inc. and Rockwell Automation, Inc.
| Company | Target High | Target Low | Consensus |
|---|---|---|---|
| Illinois Tool Works Inc. | 275 | 230 | 254 |
| Rockwell Automation, Inc. | 470 | 380 | 421.57 |
Analysts expect Illinois Tool Works’ stock to trade close to its current price of $255, indicating limited upside. Rockwell Automation’s consensus target exceeds its current price of $410.53, suggesting moderate growth potential.
Analyst Opinions Comparison
This section compares analysts’ ratings and financial scores for Illinois Tool Works Inc. (ITW) and Rockwell Automation, Inc. (ROK):
Rating Comparison
ITW Rating
- Rating: B, considered very favorable overall.
- Discounted Cash Flow Score: 3, indicating moderate valuation based on cash flow.
- ROE Score: 5, very favorable, showing excellent profit generation efficiency.
- ROA Score: 5, very favorable, excellent asset utilization.
- Debt To Equity Score: 1, very unfavorable, indicating high financial risk.
- Overall Score: 3, moderate overall financial standing.
ROK Rating
- Rating: B-, also very favorable but slightly lower than ITW.
- Discounted Cash Flow Score: 3, matching ITW’s moderate valuation.
- ROE Score: 5, very favorable, equal to ITW in shareholder profitability.
- ROA Score: 4, favorable but slightly lower asset utilization than ITW.
- Debt To Equity Score: 1, very unfavorable, equal high financial risk.
- Overall Score: 3, moderate overall standing, same as ITW.
Which one is the best rated?
Based strictly on the provided data, ITW holds a marginally better rating than ROK, primarily due to slightly higher ROA and a better letter rating (B vs. B-). Both share moderate overall scores and similar financial risk levels.
Scores Comparison
The scores comparison between Illinois Tool Works (ITW) and Rockwell Automation (ROK) is as follows:
ITW Scores
- Altman Z-Score: 7.93, indicating a safe zone with low bankruptcy risk.
- Piotroski Score: 7, classified as strong financial health.
ROK Scores
- Altman Z-Score: 5.32, also in the safe zone, showing low bankruptcy risk.
- Piotroski Score: 8, classified as very strong financial health.
Which company has the best scores?
Based on the provided data, ROK has a higher Piotroski Score (8 vs. 7) indicating stronger financial health, while both firms are in the Altman Z-Score safe zone, with ITW scoring slightly higher.
Grades Comparison
Here is a detailed comparison of the recent grades awarded to Illinois Tool Works Inc. and Rockwell Automation, Inc.:
Illinois Tool Works Inc. Grades
The following table summarizes recent grade actions from reputable grading companies for Illinois Tool Works Inc.:
| Grading Company | Action | New Grade | Date |
|---|---|---|---|
| Wells Fargo | Maintain | Underweight | 2026-01-07 |
| Goldman Sachs | Downgrade | Sell | 2025-12-16 |
| B of A Securities | Upgrade | Neutral | 2025-11-18 |
| Barclays | Maintain | Underweight | 2025-10-27 |
| Truist Securities | Maintain | Hold | 2025-10-27 |
| Wells Fargo | Maintain | Underweight | 2025-10-27 |
| Truist Securities | Maintain | Hold | 2025-10-08 |
| Barclays | Downgrade | Underweight | 2025-08-14 |
| Barclays | Maintain | Equal Weight | 2025-08-04 |
| UBS | Maintain | Neutral | 2025-07-31 |
Illinois Tool Works Inc. grades predominantly indicate cautious to negative outlooks, with several underweight and sell ratings, though some recent upgrades to neutral and hold suggest moderate stability.
Rockwell Automation, Inc. Grades
The following table presents recent grade actions from established grading companies for Rockwell Automation, Inc.:
| Grading Company | Action | New Grade | Date |
|---|---|---|---|
| Wells Fargo | Maintain | Equal Weight | 2026-01-07 |
| Barclays | Maintain | Overweight | 2026-01-07 |
| Goldman Sachs | Upgrade | Neutral | 2025-12-16 |
| Jefferies | Maintain | Buy | 2025-12-10 |
| Citigroup | Maintain | Buy | 2025-12-08 |
| Barclays | Maintain | Overweight | 2025-12-04 |
| Baird | Maintain | Outperform | 2025-11-21 |
| B of A Securities | Maintain | Buy | 2025-11-20 |
| JP Morgan | Maintain | Neutral | 2025-11-11 |
| Morgan Stanley | Maintain | Overweight | 2025-11-10 |
Rockwell Automation, Inc. shows predominantly positive to neutral grades, with multiple buy and overweight ratings maintained by several grading firms.
Which company has the best grades?
Rockwell Automation, Inc. has received generally stronger grades compared to Illinois Tool Works Inc., with numerous buy and overweight ratings versus ITW’s underweight and sell grades. This contrast may influence investor sentiment by suggesting relatively higher confidence in Rockwell Automation’s prospects.
Strengths and Weaknesses
Below is a comparative overview of key strengths and weaknesses for Illinois Tool Works Inc. (ITW) and Rockwell Automation, Inc. (ROK), based on their most recent financial and operational data.
| Criterion | Illinois Tool Works Inc. (ITW) | Rockwell Automation, Inc. (ROK) |
|---|---|---|
| Diversification | Highly diversified across 7 main segments including Automotive, Food Equipment, and Electronics, reducing dependency on any single market. | Focused on 3 core segments: Intelligent Devices, Lifecycle Services, Software & Control, with less diversification risk but more specialization. |
| Profitability | Strong profitability with net margin at 21.94% and ROIC at 27.19%, well above WACC (8.65%), indicating efficient capital use and value creation. | Moderate profitability: net margin 10.42%, ROIC 13.71%, above WACC (10.39%) but margins and returns lower than ITW. |
| Innovation | Consistent investment in Test and Measurement and Electronics segment supports innovation, driving ROIC growth of 62%. | High innovation focus in Software and Control segment; ROIC growth strong at 77%, but overall profitability is moderate. |
| Global presence | Broad global footprint through multiple industrial segments, supporting stable revenue streams across regions. | Global presence in industrial automation, but narrower product scope may limit market reach compared to ITW. |
| Market Share | Leading positions in diverse industrial markets, supported by durable competitive advantages and strong economic moat. | Strong position in automation controls with durable moat, but more vulnerable to sector-specific cycles. |
Key takeaways: ITW shows superior diversification and profitability with a very favorable economic moat, making it resilient across market conditions. ROK demonstrates high innovation and solid moat but faces tighter margins and less diversification, implying potentially higher risk and reward. Investors should weigh stability versus growth potential accordingly.
Risk Analysis
Below is a comparative table illustrating key risks for Illinois Tool Works Inc. (ITW) and Rockwell Automation, Inc. (ROK) based on their latest financial and operational data from 2024-2025.
| Metric | Illinois Tool Works Inc. (ITW) | Rockwell Automation, Inc. (ROK) |
|---|---|---|
| Market Risk | Beta 1.17 – moderate volatility | Beta 1.52 – higher volatility |
| Debt level | Debt/Equity 2.44 – high, unfavorable | Debt/Equity 1.0 – moderate, neutral |
| Regulatory Risk | Moderate – industrial sector regulations | Moderate – automation software and hardware compliance |
| Operational Risk | Diversified segments reduce risk | Software & control complexity adds risk |
| Environmental Risk | Moderate – manufacturing emissions | Moderate – industrial equipment impact |
| Geopolitical Risk | Moderate exposure due to global sales | Moderate exposure via international markets |
The most significant risks are ITW’s high debt level, which could affect financial flexibility, and ROK’s elevated market volatility and unfavorable valuation ratios. Both companies operate in regulated industrial sectors with moderate operational and environmental risks. Careful monitoring of debt and market fluctuations is advised.
Which Stock to Choose?
Illinois Tool Works Inc. (ITW) shows a generally favorable income evolution with strong profitability metrics, including a 21.94% net margin and a growing ROIC well above WACC, indicating value creation. Its financial ratios are slightly favorable overall, though debt levels and price-to-book ratios are less attractive. ITW holds a very favorable rating and strong scores, including a safe Altman Z-Score and a strong Piotroski Score.
Rockwell Automation, Inc. (ROK) presents favorable margins but less robust income growth, showing an unfavorable overall income statement trend. Its financial ratios are slightly favorable but include some unfavorable metrics like a high P/E ratio and weaker liquidity. Debt levels are moderate, and the company also demonstrates value creation through a growing ROIC above WACC. ROK holds a very favorable rating with scores indicating financial safety and strength.
For investors, ITW might appear more appealing for those prioritizing consistent income growth, profitability, and a durable competitive advantage, while ROK could be seen as suitable for those accepting higher valuation multiples and focusing on companies with improving profitability trends. The choice might depend on an investor’s risk tolerance and preference for growth versus valuation considerations.
Disclaimer: Investment carries a risk of loss of initial capital. The past performance is not a reliable indicator of future results. Be sure to understand risks before making an investment decision.
Go Further
I encourage you to read the complete analyses of Illinois Tool Works Inc. and Rockwell Automation, Inc. to enhance your investment decisions: