Home > Comparison > Industrials > ITW vs OTIS
The strategic rivalry between Illinois Tool Works Inc. and Otis Worldwide Corporation shapes the trajectory of the industrial machinery sector. Illinois Tool Works operates as a diversified industrial manufacturer with multiple segments, including automotive and construction products. Otis focuses on elevator and escalator manufacturing and services, emphasizing steady maintenance revenue. This analysis will determine which business model offers superior risk-adjusted returns for a diversified portfolio in today’s evolving industrial landscape.
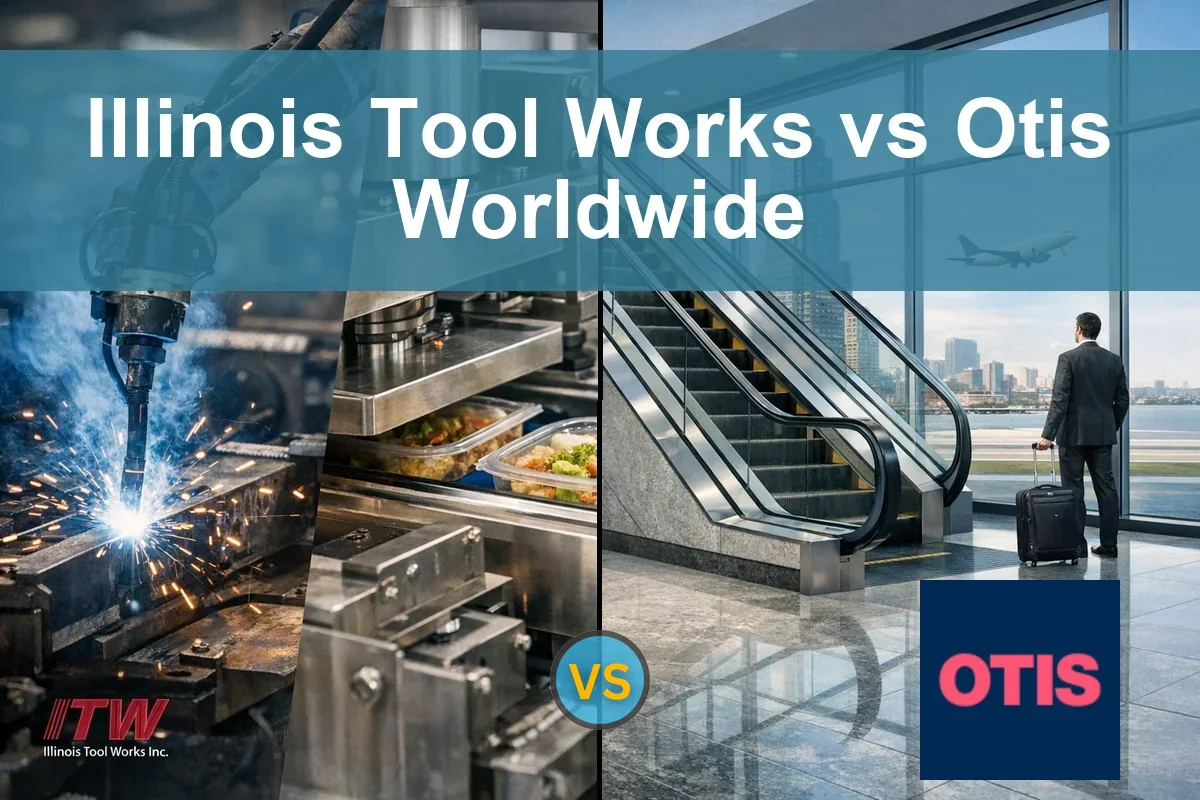
Table of contents
Companies Overview
Illinois Tool Works Inc. and Otis Worldwide Corporation lead critical niches within the industrial machinery market.
Illinois Tool Works Inc.: Diverse Industrial Powerhouse
Illinois Tool Works Inc. dominates as a global manufacturer of industrial products across seven segments, including automotive, food equipment, and welding. Its core revenue stems from selling specialized components and equipment worldwide. In 2026, it strategically focuses on expanding engineered fastening systems and enhancing product coding solutions to strengthen its industrial footprint.
Otis Worldwide Corporation: Elevator and Escalator Specialist
Otis Worldwide Corporation commands the elevator and escalator market through design, manufacturing, and extensive service networks. Its revenue engine relies heavily on new equipment sales and ongoing maintenance contracts. The company’s 2026 strategy emphasizes scaling its service segment with 34,000 mechanics to boost modernization offerings and capitalize on infrastructure projects globally.
Strategic Collision: Similarities & Divergences
Both companies excel in industrial machinery but diverge sharply in approach: Illinois Tool Works embraces product diversification while Otis concentrates on vertical integration through equipment and service. Their primary battleground is global infrastructure and industrial markets. Illinois Tool Works offers a broad industrial portfolio, whereas Otis presents a specialized, service-driven growth profile.
Income Statement Comparison
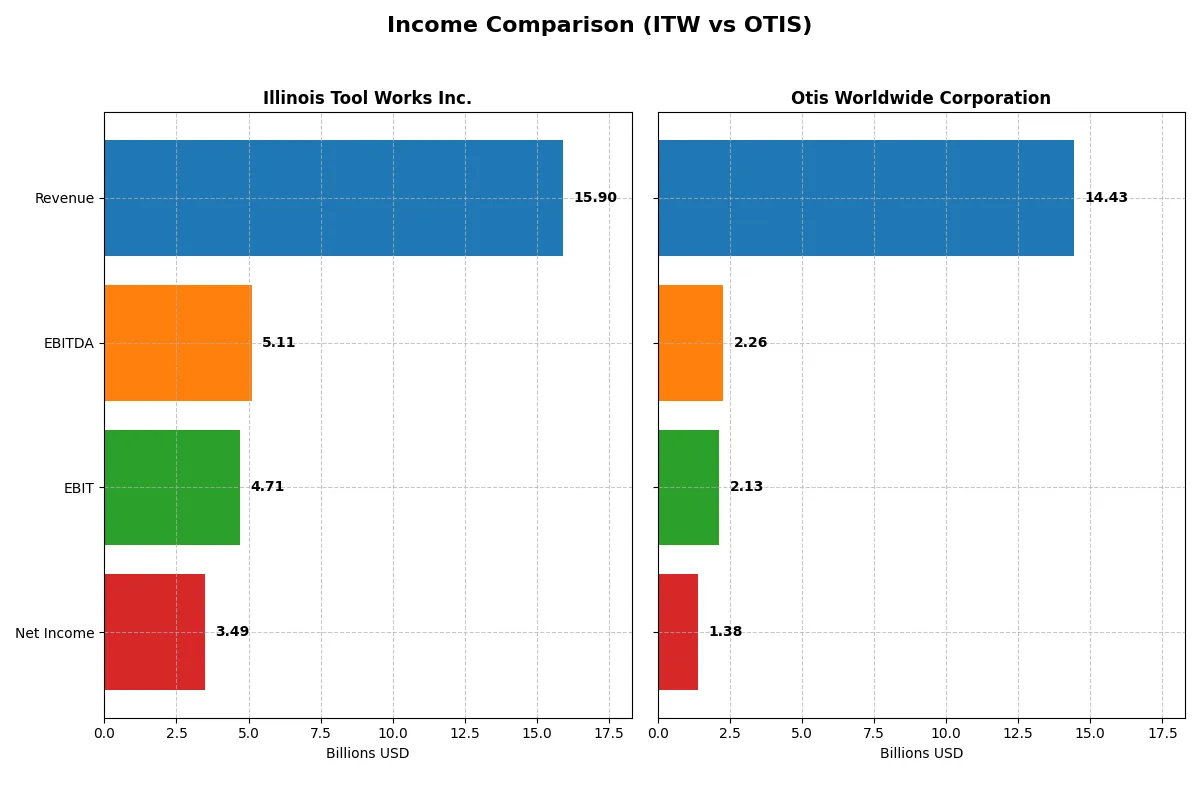
The following data dissects the core profitability and scalability of both corporate engines to reveal who dominates the bottom line:
| Metric | Illinois Tool Works Inc. (ITW) | Otis Worldwide Corporation (OTIS) |
|---|---|---|
| Revenue | 15.9B | 14.3B |
| Cost of Revenue | 8.96B | 10.0B |
| Operating Expenses | 2.68B | 2.24B |
| Gross Profit | 6.94B | 4.26B |
| EBITDA | 5.11B | 2.23B |
| EBIT | 4.71B | 2.05B |
| Interest Expense | 283M | 0 (net -31M, interest expense 196M) |
| Net Income | 3.49B | 1.65B |
| EPS | 11.75 | 4.10 |
| Fiscal Year | 2024 | 2024 |
Income Statement Analysis: The Bottom-Line Duel
This income statement comparison reveals how efficiently each company converts sales into profits through their distinct operational models.
Illinois Tool Works Inc. (ITW) Analysis
ITW’s revenue grew 26% from 2020 to 2024, peaking at $15.9B in 2024 but dipping slightly from 2023. Net income surged 65% over five years to $3.5B in 2024, with a strong 22% net margin. Its gross margin holds firm at 44%, while EBIT margin expanded to nearly 30%, signaling robust operational leverage and margin momentum.
Otis Worldwide Corporation (OTIS) Analysis
Otis posted modest revenue growth of under 1% from 2021 to 2025, reaching $14.4B in 2025. Net income rose 11% over the period, achieving $1.38B in 2025 but with a thinner 9.6% net margin. Gross margin at 30% and EBIT margin near 15% show lower profitability compared to ITW. Otis’s slower margin growth and recent EPS decline indicate margin pressure.
Margin Strength vs. Scale and Growth
ITW outperforms Otis by delivering higher margins and stronger net income growth, reflecting superior capital allocation and operational efficiency. Otis’s revenue scale is comparable but with substantially lower profitability and weaker recent momentum. For investors prioritizing margin resilience and earnings expansion, ITW’s profile stands out as the fundamentally stronger choice.
Financial Ratios Comparison
These vital ratios act as a diagnostic tool to expose the underlying fiscal health, valuation premiums, and capital efficiency of the companies compared below:
| Ratios | Illinois Tool Works Inc. (ITW) | Otis Worldwide Corporation (OTIS) |
|---|---|---|
| ROE | 105.19% (2024) | -25.67% (2025) |
| ROIC | 27.19% (2024) | 40.74% (2025) |
| P/E | 21.58 (2024) | 24.85 (2025) |
| P/B | 22.69 (2024) | -6.38 (2025) |
| Current Ratio | 1.36 (2024) | 0.85 (2025) |
| Quick Ratio | 0.99 (2024) | 0.77 (2025) |
| D/E (Debt-to-Equity) | 2.44 (2024) | -1.62 (2025) |
| Debt-to-Assets | 53.61% (2024) | 82.14% (2025) |
| Interest Coverage | 15.07 (2024) | 11.20 (2025) |
| Asset Turnover | 1.06 (2024) | 1.35 (2025) |
| Fixed Asset Turnover | 6.91 (2024) | 11.13 (2025) |
| Payout Ratio | 48.60% (2024) | 46.75% (2025) |
| Dividend Yield | 2.25% (2024) | 1.88% (2025) |
| Fiscal Year | 2024 | 2025 |
Efficiency & Valuation Duel: The Vital Signs
Ratios act as a company’s DNA, revealing hidden risks and operational excellence critical to informed investment decisions.
Illinois Tool Works Inc.
Illinois Tool Works exhibits a robust ROE of 105.19% and a strong net margin near 22%, signaling high profitability. Its P/E of 21.58 suggests a fairly valued stock, though a high P/B ratio of 22.69 flags premium pricing. The company rewards shareholders with a 2.25% dividend yield, balancing income with ongoing R&D investment.
Otis Worldwide Corporation
Otis shows a contrasting profile with a negative ROE of -25.67%, reflecting recent profitability challenges despite a favorable ROIC of 40.74%. Its P/E ratio at 24.85 is neutral but paired with a low current ratio of 0.85, indicating liquidity concerns. Otis offers a modest 1.88% dividend yield, alongside steady reinvestment in research and development.
Premium Valuation vs. Operational Safety
Illinois Tool Works delivers superior profitability and dividend yield but at a stretched valuation and higher leverage. Otis presents stronger capital efficiency but suffers from low profitability and liquidity risks. Investors prioritizing stable returns may lean toward Illinois Tool Works, while those seeking turnaround potential might consider Otis’s growth focus.
Which one offers the Superior Shareholder Reward?
I compare Illinois Tool Works (ITW) and Otis Worldwide (OTIS) by their dividend yields, payout ratios, and buyback intensity. ITW yields 2.25% with a 49% payout ratio, supported by strong free cash flow coverage. OTIS yields 1.88%, paying less of its earnings (47% payout) but with weaker operating margins. ITW aggressively returns capital via dividends and buybacks, sustaining a 1.54 dividend + capex coverage ratio. OTIS maintains a modest dividend with a payout below 40%, focusing more on operational reinvestment. ITW’s model balances yield and buybacks more sustainably, aligning with long-term value creation. I conclude ITW offers the more attractive total shareholder return profile in 2026.
Comparative Score Analysis: The Strategic Profile
The radar chart reveals the fundamental DNA and trade-offs of Illinois Tool Works Inc. and Otis Worldwide Corporation, highlighting their financial strengths and weaknesses:
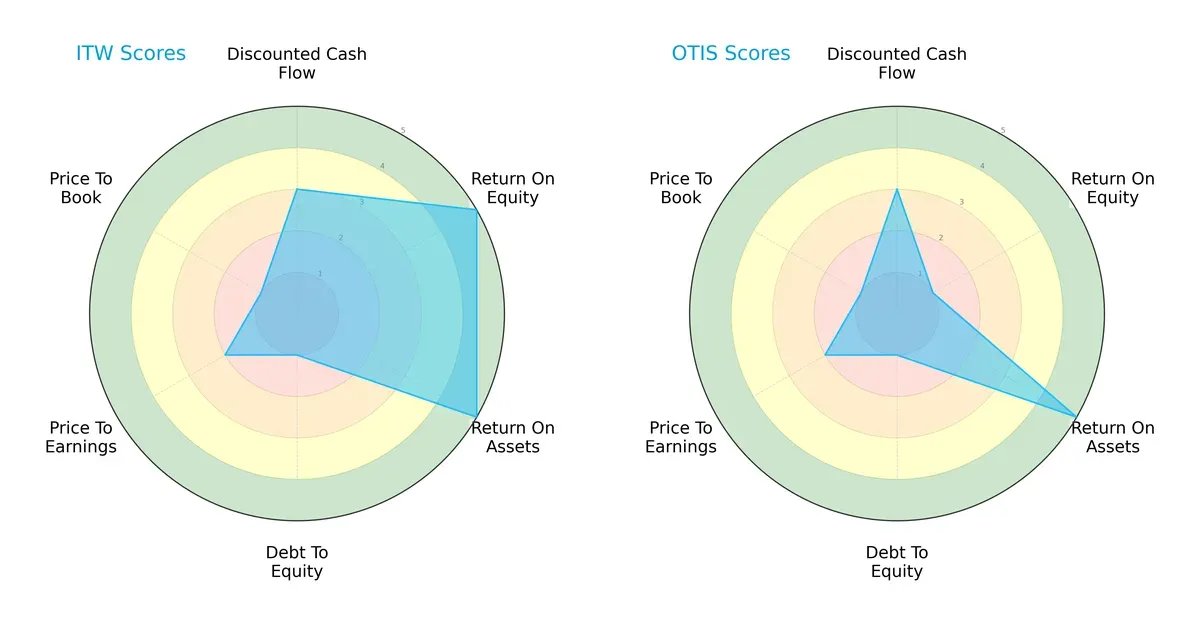
Illinois Tool Works dominates in return on equity (ROE) and return on assets (ROA), scoring very favorably with 5s in both metrics. Otis matches ITW on ROA but trails significantly on ROE, scoring just 1. Both firms share low debt-to-equity scores, signaling high leverage risks. Valuation metrics (PE and PB) remain moderate to unfavorable for both, indicating pricey market perceptions. ITW presents a more balanced profile, leveraging operational efficiency, while Otis relies heavily on asset utilization.
Bankruptcy Risk: Solvency Showdown
The Altman Z-Score gap signals a clear difference in financial resilience between the two companies:
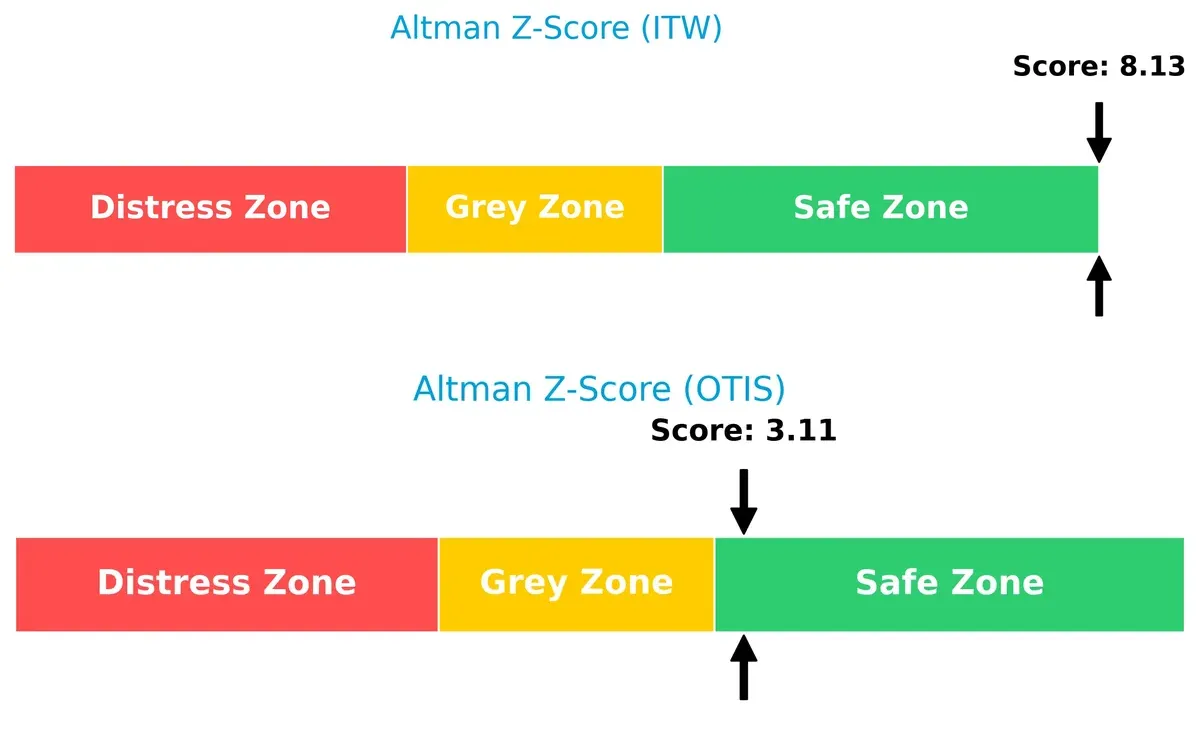
Illinois Tool Works boasts a robust Altman Z-Score of 8.1, placing it deep in the safe zone. Otis sits just above the safe threshold at 3.1, suggesting moderate solvency risk. Historically in industrial sectors, a score this high for ITW reflects strong buffers against economic downturns. Otis’s position, while safe, demands caution given cyclical pressures ahead.
Financial Health: Quality of Operations
Piotroski F-Scores reveal differences in operational quality and internal financial discipline:
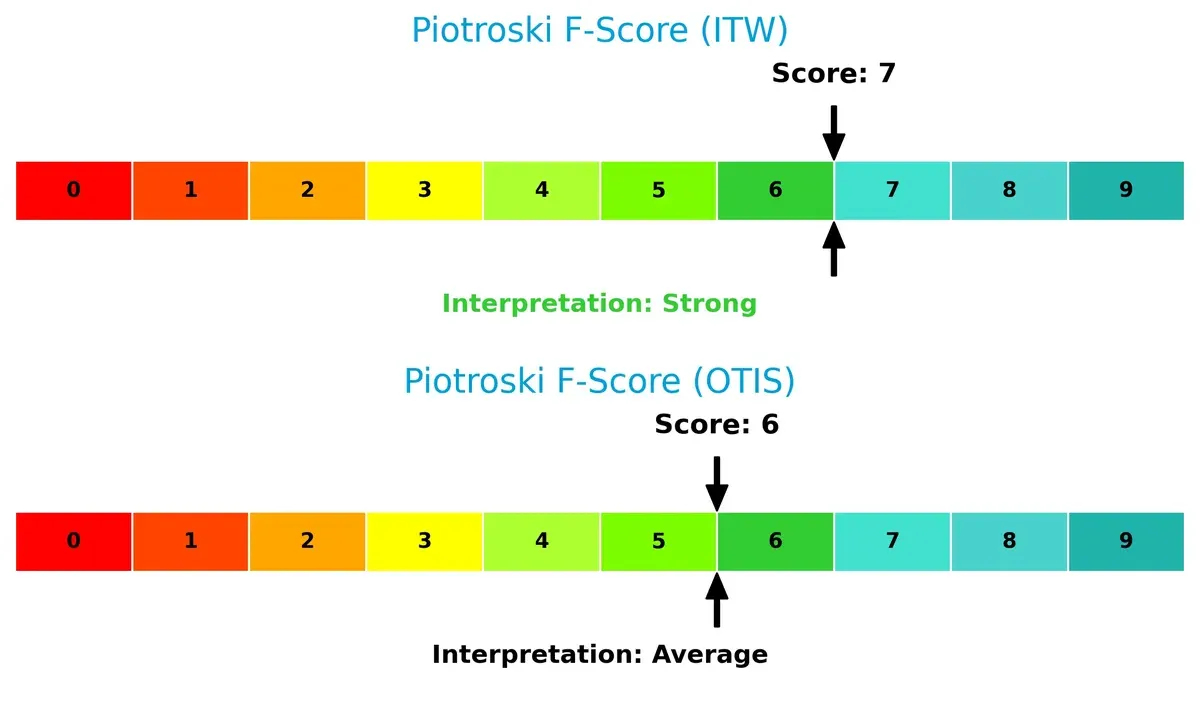
Illinois Tool Works scores a strong 7, indicating solid profitability, efficiency, and balance sheet health. Otis scores 6, reflecting average financial health but some internal red flags relative to ITW. In this sector, a Piotroski below 7 often signals early warning signs in capital allocation or earnings quality. Investors should weigh ITW’s cleaner internal metrics when prioritizing stability.
How are the two companies positioned?
This section dissects the operational DNA of ITW and Otis by comparing their revenue distribution by segment alongside internal strengths and weaknesses. The goal is to confront their economic moats and reveal which business model offers the most resilient, sustainable competitive advantage today.
Revenue Segmentation: The Strategic Mix
This visual comparison dissects how Illinois Tool Works and Otis Worldwide diversify their income streams and where their primary sector bets lie:
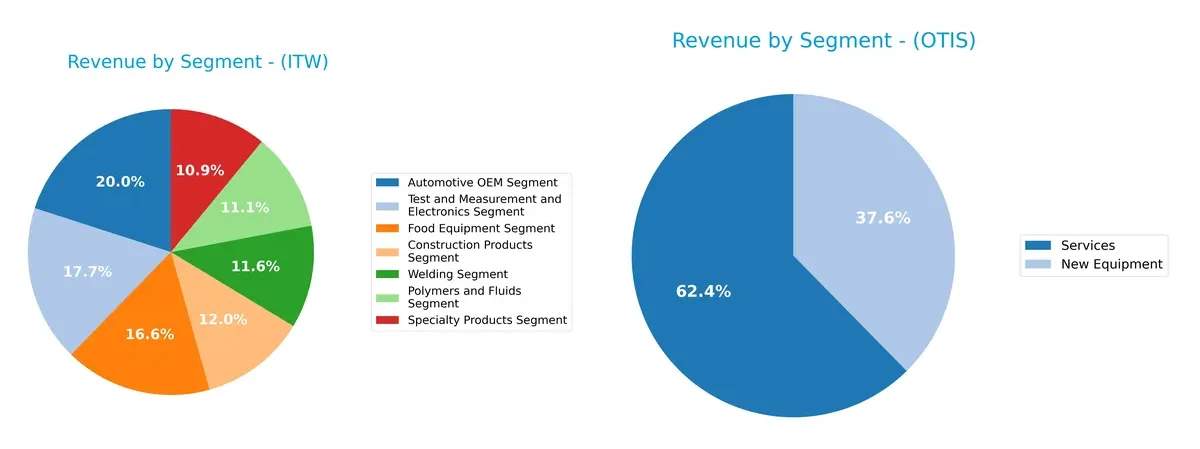
Illinois Tool Works reveals a broad revenue mix across seven substantial segments, each ranging from $1.7B to $3.2B in 2024. This diversification lowers concentration risk and supports resilience through multiple industrial cycles. Otis, by contrast, pivots heavily on two segments: Services at $8.9B and New Equipment at $5.4B. This sharp focus anchors Otis’s ecosystem lock-in but increases exposure to construction market volatility. ITW’s diversified portfolio contrasts with Otis’s concentrated infrastructure dominance.
Strengths and Weaknesses Comparison
This table compares the Strengths and Weaknesses of Illinois Tool Works Inc. (ITW) and Otis Worldwide Corporation (OTIS):
ITW Strengths
- Diverse business segments including automotive, food equipment, and electronics
- Strong profitability with 21.94% net margin and 27.19% ROIC
- Favorable interest coverage at 16.63 supports debt servicing
- Wide global presence with strong North America and Europe sales
- Consistent asset and fixed asset turnover ratios indicating efficiency
OTIS Strengths
- High ROIC at 40.74% indicating efficient capital use
- Favorable WACC at 7.36% lowers cost of capital
- Strong fixed asset turnover at 11.13 suggests operational efficiency
- Market leadership in new equipment and services segments
- Favorable price-to-book ratio indicates undervaluation potential
ITW Weaknesses
- High debt-to-equity ratio at 2.44 signals leverage risk
- Elevated debt-to-assets at 53.61% raises solvency concerns
- Unfavorable price-to-book ratio at 22.69 may imply overvaluation
- Neutral liquidity ratios with quick ratio below 1 could pressure short-term flexibility
OTIS Weaknesses
- Negative return on equity at -25.67% indicates poor shareholder returns
- Low current and quick ratios below 1 suggest liquidity risk
- High debt-to-assets at 82.14% heightens financial risk
- Dividend yield lower and neutral compared to ITW reduces income appeal
Both companies maintain a slightly favorable overall financial profile but face distinct risks. ITW’s broad diversification and profitability contrast with its leverage concerns. OTIS shows strong capital efficiency yet struggles with equity returns and liquidity. These factors highlight different strategic priorities for managing growth and risk.
The Moat Duel: Analyzing Competitive Defensibility
A structural moat is the only true shield protecting long-term profits from relentless competitive erosion. Let’s examine how Illinois Tool Works and Otis Worldwide defend their turf:
Illinois Tool Works Inc.: Diversified Industrial Moat through Intangible Assets
I see ITW’s moat rooted in its intangible assets and specialized manufacturing expertise, reflected in a robust 29.6% EBIT margin and 21.9% net margin. Its growing ROIC, exceeding WACC by 18.5%, confirms durable value creation. Expansion into emerging markets and new product lines in polymers and construction products could deepen this moat in 2026.
Otis Worldwide Corporation: Service Network Moat via Switching Costs
Otis leans on a vast service network and high switching costs from its 34,000 service mechanics, underpinning its competitive edge. Despite a lower 14.8% EBIT margin than ITW, it boasts an impressive 33.4% ROIC premium over WACC, signaling efficient capital use and value creation. Continued modernization services and smart elevator innovations offer growth paths to reinforce its moat.
Industrial Engines: Intangible Assets vs. Service Network Lock-in
Both companies demonstrate very favorable moats with growing ROIC trends. However, Otis’s higher ROIC premium and entrenched service network create a deeper moat. I judge Otis better equipped to defend its market share against disruption in 2026.
Which stock offers better returns?
The past year revealed contrasting price movements. Illinois Tool Works showed a modest overall rise with accelerating gains recently. Otis Worldwide faced a sharper decline, deepening in the latest months.
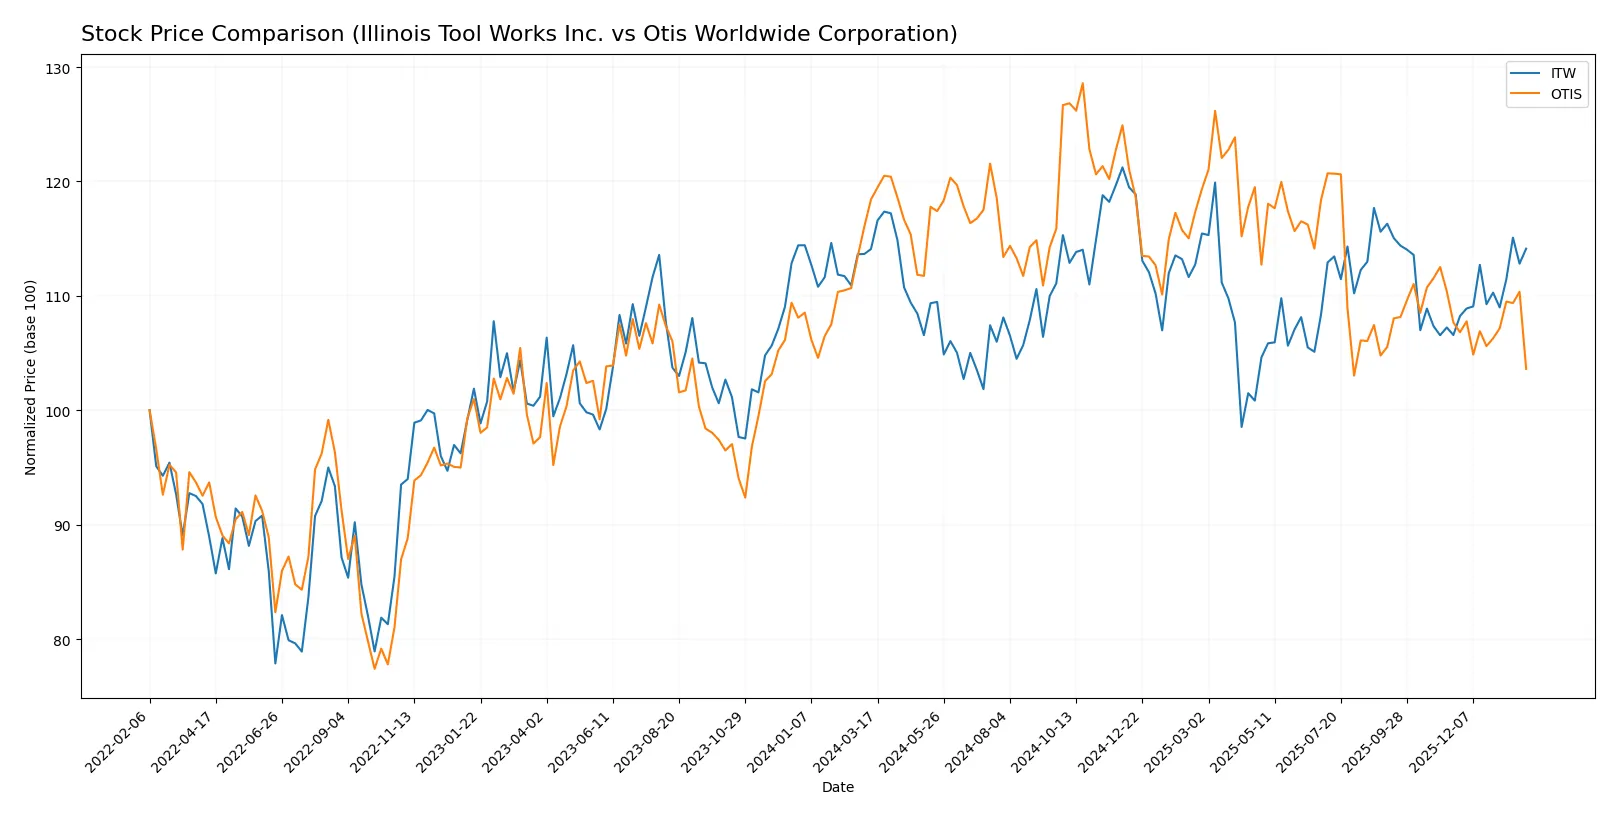
Trend Comparison
Illinois Tool Works gained 0.03% over the past 12 months, signaling a bullish trend with accelerating momentum and price range between 225.57 and 277.52. Volatility is relatively high at a 10.7 std deviation.
Otis Worldwide dropped 12.51% in the same period, marking a bearish trend with acceleration despite a narrower price band of 84.93 to 106.01 and lower volatility at 4.86 std deviation.
Comparing trends, Illinois Tool Works delivered the highest market performance with a slight overall gain, while Otis Worldwide experienced significant losses through 2026.
Target Prices
Analysts project moderate upside for Illinois Tool Works and Otis Worldwide, reflecting cautious optimism amid industrial sector dynamics.
| Company | Target Low | Target High | Consensus |
|---|---|---|---|
| Illinois Tool Works Inc. | 230 | 275 | 254 |
| Otis Worldwide Corporation | 92 | 109 | 97.75 |
Illinois Tool Works trades slightly above its consensus target of $254 at $261.26, signaling limited near-term upside. Otis shares at $85.42 sit well below the $97.75 target, suggesting more room for price appreciation.

Don’t Let Luck Decide Your Entry Point
Optimize your entry points with our advanced ProRealTime indicators. You’ll get efficient buy signals with precise price targets for maximum performance. Start outperforming now!
How do institutions grade them?
Here is a comparison of recent institutional grades for Illinois Tool Works Inc. and Otis Worldwide Corporation:
Illinois Tool Works Inc. Grades
The following table summarizes recent grades from reputable financial institutions for Illinois Tool Works Inc.:
| Grading Company | Action | New Grade | Date |
|---|---|---|---|
| Wells Fargo | Maintain | Underweight | 2026-01-07 |
| Goldman Sachs | Downgrade | Sell | 2025-12-16 |
| B of A Securities | Upgrade | Neutral | 2025-11-18 |
| Wells Fargo | Maintain | Underweight | 2025-10-27 |
| Truist Securities | Maintain | Hold | 2025-10-27 |
| Barclays | Maintain | Underweight | 2025-10-27 |
| Truist Securities | Maintain | Hold | 2025-10-08 |
| Barclays | Downgrade | Underweight | 2025-08-14 |
| Barclays | Maintain | Equal Weight | 2025-08-04 |
| Stifel | Maintain | Hold | 2025-07-31 |
Otis Worldwide Corporation Grades
The following table summarizes recent grades from reputable financial institutions for Otis Worldwide Corporation:
| Grading Company | Action | New Grade | Date |
|---|---|---|---|
| JP Morgan | Maintain | Overweight | 2026-01-16 |
| Wells Fargo | Maintain | Equal Weight | 2025-12-15 |
| Barclays | Maintain | Underweight | 2025-10-30 |
| JP Morgan | Maintain | Overweight | 2025-10-15 |
| Wolfe Research | Upgrade | Outperform | 2025-10-08 |
| Wells Fargo | Maintain | Equal Weight | 2025-10-06 |
| JP Morgan | Maintain | Overweight | 2025-09-18 |
| RBC Capital | Maintain | Outperform | 2025-07-28 |
| Wolfe Research | Upgrade | Peer Perform | 2025-07-25 |
| Wells Fargo | Maintain | Equal Weight | 2025-07-24 |
Which company has the best grades?
Otis consistently receives more favorable grades, including multiple “Overweight” and “Outperform” ratings. Illinois Tool Works faces predominantly cautious grades like “Underweight” and “Sell.” This divergence may influence investor sentiment and portfolio positioning.
Risks specific to each company
The following categories identify critical pressure points and systemic threats facing Illinois Tool Works Inc. and Otis Worldwide Corporation in the 2026 market environment:
1. Market & Competition
Illinois Tool Works Inc.
- Diversified industrial segments reduce reliance on any single market.
Otis Worldwide Corporation
- Concentrated in elevator and escalator markets, facing intense infrastructure demand cycles.
2. Capital Structure & Debt
Illinois Tool Works Inc.
- High debt-to-equity ratio (2.44) signals leverage risk and limits financial flexibility.
Otis Worldwide Corporation
- Debt-to-assets at 82.14% is worrisome; weak liquidity ratios (current 0.85) raise solvency concerns.
3. Stock Volatility
Illinois Tool Works Inc.
- Beta 1.16 implies moderate sensitivity to market swings, typical for industrials.
Otis Worldwide Corporation
- Beta 1.01 shows slightly lower volatility but with higher trading volume spikes.
4. Regulatory & Legal
Illinois Tool Works Inc.
- Exposure to global industrial regulations; compliance costs manageable due to scale.
Otis Worldwide Corporation
- Service segment faces stringent safety and environmental regulations impacting operating costs.
5. Supply Chain & Operations
Illinois Tool Works Inc.
- Broad supplier base mitigates single-point supply risks; diversified manufacturing footprint.
Otis Worldwide Corporation
- Heavy reliance on service technicians and parts availability creates operational bottlenecks.
6. ESG & Climate Transition
Illinois Tool Works Inc.
- Strong focus on sustainability in manufacturing and product innovation; improving ESG metrics.
Otis Worldwide Corporation
- Pressure to decarbonize infrastructure and enhance energy efficiency in products is high.
7. Geopolitical Exposure
Illinois Tool Works Inc.
- Global operations subject to trade tensions and tariffs; well-hedged with diversified markets.
Otis Worldwide Corporation
- Significant presence in China and emerging markets increases geopolitical risk exposure.
Which company shows a better risk-adjusted profile?
Illinois Tool Works faces notable leverage risks but benefits from diversification and strong profitability metrics. Otis struggles with liquidity and concentrated market exposure despite solid operational efficiency. ITW’s Altman Z-Score (8.13) and Piotroski (7) outperform Otis’s scores, reflecting a safer financial position. Otis’s high debt-to-assets ratio (82%) and weak current ratio (0.85) pose red flags. Overall, Illinois Tool Works offers a better risk-adjusted profile in 2026.
Final Verdict: Which stock to choose?
Illinois Tool Works (ITW) excels as a cash-generating powerhouse with a durable competitive advantage supported by a strong and growing ROIC. Its main point of vigilance is the relatively high leverage, which could pressure financial flexibility during economic downturns. ITW suits portfolios aiming for aggressive growth with resilience.
Otis Worldwide (OTIS) stands out with a strategic moat anchored in efficient capital use and a solid return on invested capital well above its cost of capital. While it carries higher debt and weaker liquidity than ITW, it offers a safety profile enhanced by stable cash flow generation. OTIS fits portfolios focused on growth at a reasonable price (GARP).
If you prioritize consistent value creation and robust profitability underpinned by operational efficiency, ITW is the compelling choice due to its strong income growth and financial strength. However, if you seek a company with a solid capital return profile and a more conservative valuation, OTIS offers better stability despite its higher leverage and recent price softness.
Disclaimer: Investment carries a risk of loss of initial capital. The past performance is not a reliable indicator of future results. Be sure to understand risks before making an investment decision.
Go Further
I encourage you to read the complete analyses of Illinois Tool Works Inc. and Otis Worldwide Corporation to enhance your investment decisions: