Investing in industrial machinery demands a keen eye on both market presence and innovation. Illinois Tool Works Inc. (ITW) and Kadant Inc. (KAI) are two notable players in this sector, each with distinct strategies and product portfolios. ITW operates globally with diverse segments, while Kadant focuses on specialized engineered systems. This comparison will help you decide which company offers the most compelling investment opportunity in today’s evolving industrial landscape.
Table of contents
Companies Overview
I will begin the comparison between Illinois Tool Works and Kadant by providing an overview of these two companies and their main differences.
Illinois Tool Works Overview
Illinois Tool Works Inc. manufactures and sells industrial products and equipment worldwide, operating through seven segments including Automotive OEM, Food Equipment, and Welding. The company serves diverse markets such as automotive, construction, and general industry, distributing products directly and via distributors. Founded in 1912 and based in Glenview, Illinois, ITW holds a strong market position with a broad industrial focus and 44,000 employees.
Kadant Overview
Kadant Inc. supplies technologies and engineered systems globally, with three segments: Flow Control, Industrial Processing, and Material Handling. Its products support packaging, tissue, wood products, and alternative fuel industries. Established in 1991 and headquartered in Westford, Massachusetts, Kadant employs 3,500 people and concentrates on specialized industrial systems and equipment, emphasizing fluid handling and material processing technologies.
Key similarities and differences
Both companies operate in the industrial machinery sector, serving global markets with engineered products and systems. ITW has a broader product portfolio and larger workforce, while Kadant focuses on specific segments like flow control and material handling. ITW’s diversified industrial segments contrast with Kadant’s targeted approach in niche markets, reflecting differing scales and business model focuses within the industrial sector.
Income Statement Comparison
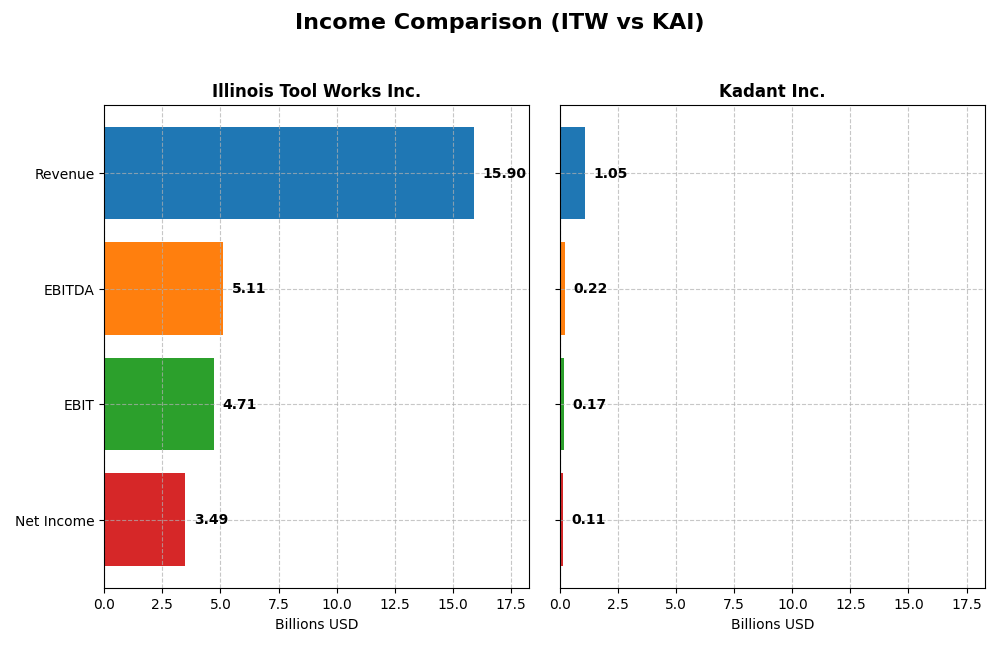
This table presents a side-by-side comparison of key income statement metrics for Illinois Tool Works Inc. and Kadant Inc. for the fiscal year 2024.
| Metric | Illinois Tool Works Inc. | Kadant Inc. |
|---|---|---|
| Market Cap | 74.7B | 3.76B |
| Revenue | 15.9B | 1.05B |
| EBITDA | 5.11B | 223M |
| EBIT | 4.71B | 173M |
| Net Income | 3.49B | 112M |
| EPS | 11.75 | 9.51 |
| Fiscal Year | 2024 | 2024 |
Income Statement Interpretations
Illinois Tool Works Inc.
Illinois Tool Works (ITW) showed revenue growth of 26.44% and net income growth of 65.39% from 2020 to 2024, with a slight 1.3% revenue decline in 2024. Margins remain strong, with a 43.65% gross margin and 21.94% net margin in 2024, both favorable. The latest year saw improved net income and EPS growth, reflecting margin enhancements despite softer sales.
Kadant Inc.
Kadant (KAI) achieved 65.88% revenue and 102.18% net income growth over the 2020-2024 period, with a 9.99% revenue increase in 2024. Gross margin remained favorable at 44.25%, but net margin declined by 12.59% in 2024 to 10.59%. Operating expenses grew unfavorably relative to revenue, and EPS decreased, indicating pressure on profitability despite top-line gains.
Which one has the stronger fundamentals?
Illinois Tool Works displays stronger fundamentals with higher and more stable margins, favorable net margin growth, and positive EPS trends in the most recent year. Kadant shows robust revenue and net income growth overall but faces margin compression and EPS decline in 2024. Overall, ITW’s income statement reflects more consistent profitability and margin control.
Financial Ratios Comparison
The table below presents a side-by-side comparison of key financial ratios for Illinois Tool Works Inc. (ITW) and Kadant Inc. (KAI) for the fiscal year 2024.
| Ratios | Illinois Tool Works Inc. (ITW) | Kadant Inc. (KAI) |
|---|---|---|
| ROE | 105.2% | 13.2% |
| ROIC | 27.2% | 10.1% |
| P/E | 21.6 | 36.9 |
| P/B | 22.7 | 4.86 |
| Current Ratio | 1.36 | 2.31 |
| Quick Ratio | 0.99 | 1.55 |
| D/E (Debt-to-Equity) | 2.44 | 0.38 |
| Debt-to-Assets | 53.6% | 22.6% |
| Interest Coverage | 15.1 | 8.55 |
| Asset Turnover | 1.06 | 0.74 |
| Fixed Asset Turnover | 6.91 | 6.18 |
| Payout Ratio | 48.6% | 13.1% |
| Dividend Yield | 2.25% | 0.36% |
Interpretation of the Ratios
Illinois Tool Works Inc.
Illinois Tool Works shows strong profitability with a favorable net margin of 21.94% and an exceptionally high return on equity at 105.16%. However, concerns arise from a high debt-to-equity ratio of 2.44 and a debt-to-assets ratio of 53.61%, both marked unfavorable. The company maintains a stable dividend yield of 2.25%, supported by solid free cash flow coverage, indicating disciplined shareholder returns.
Kadant Inc.
Kadant presents a mixed ratio profile with favorable net margin at 10.59% and return on invested capital at 10.08%, but a neutral return on equity of 13.17%. Its balance sheet strength is evident in low leverage ratios such as debt-to-equity at 0.38 and debt-to-assets at 22.57%, both favorable. Dividends remain low with a 0.36% yield, reflecting a cautious payout approach amid growth and reinvestment priorities.
Which one has the best ratios?
Kadant exhibits a more favorable balance sheet with lower leverage and stronger liquidity ratios, contributing to a favorable global evaluation. Illinois Tool Works delivers higher profitability and dividend yield but carries heavier debt, resulting in a slightly favorable overall stance. Each company’s ratio strengths and weaknesses reflect distinct financial strategies and risk profiles.
Strategic Positioning
This section compares the strategic positioning of Illinois Tool Works Inc. (ITW) and Kadant Inc. (KAI) in terms of market position, key segments, and exposure to technological disruption:
Illinois Tool Works Inc. (ITW)
- Large market cap of $74.7B with diversified industrial machinery segments facing moderate competitive pressure.
- Operates seven segments including Automotive OEM, Food Equipment, Welding, and Specialty Products driving diverse revenue streams.
- Exposure to disruption mitigated by diversified industrial products and established distribution channels worldwide.
Kadant Inc. (KAI)
- Smaller market cap of $3.8B focused on niche industrial machinery segments with moderate competitive pressure.
- Operates three segments: Flow Control, Industrial Processing, and Material Handling, focusing on engineered systems and consumables.
- Exposure to disruption concentrated in fluid-handling and papermaking systems with specialized product focus.
ITW vs KAI Positioning
ITW’s strategy is diversified across multiple industrial segments providing broad market exposure and risk distribution. KAI is more concentrated in engineered systems and consumables, which may limit market breadth but allow focused expertise. ITW benefits from scale, whereas KAI’s smaller footprint focuses on specialized industrial niches.
Which has the best competitive advantage?
ITW demonstrates a very favorable moat with a strong ROIC above WACC and growing profitability, indicating durable competitive advantage. KAI’s slightly favorable moat shows growing profitability but currently lacks a strong competitive advantage.
Stock Comparison
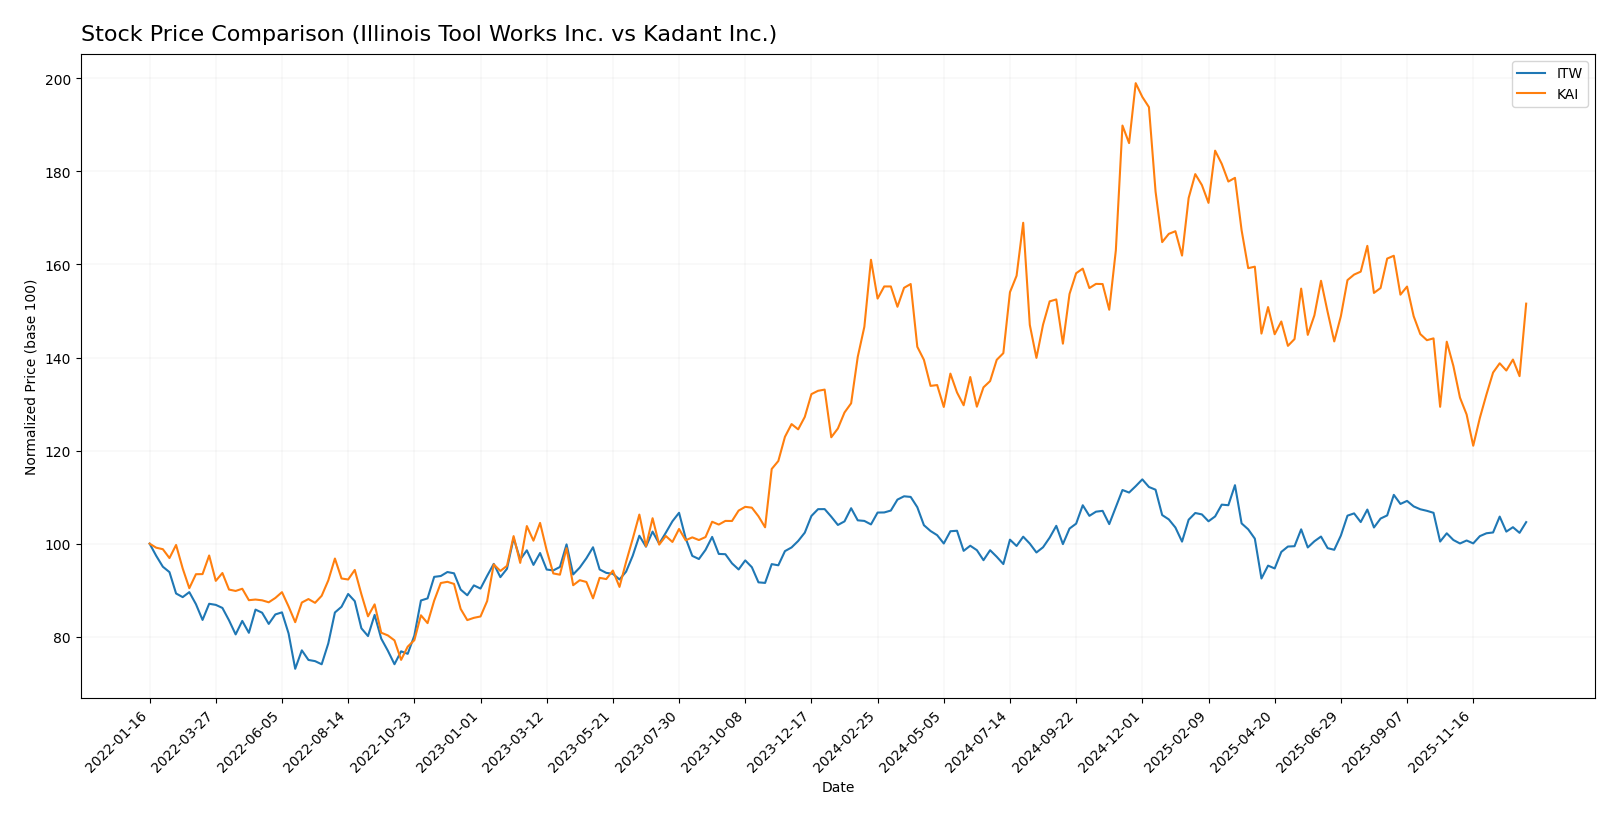
The stock prices of Illinois Tool Works Inc. (ITW) and Kadant Inc. (KAI) have shown contrasting movements over the past 12 months, with ITW maintaining a slight bullish trajectory while KAI experienced a notable bearish trend despite recent recovery signals.
Trend Analysis
Illinois Tool Works Inc. (ITW) recorded a modest 0.47% price increase over the past year, indicating a neutral to slightly bullish trend with accelerating momentum and moderate volatility, peaking at 277.52 and bottoming at 225.57.
Kadant Inc. (KAI) posted a -5.86% decline over the same period, confirming a bearish trend with accelerating downward pressure and high volatility, from a high of 419.01 to a low of 254.91, despite a recent short-term rebound.
Comparing both, ITW delivered the highest market performance with a positive price change, while KAI showed significant losses over the year but some recent upward price acceleration.
Target Prices
The current analyst target consensus indicates moderate upside potential for both Illinois Tool Works Inc. and Kadant Inc.
| Company | Target High | Target Low | Consensus |
|---|---|---|---|
| Illinois Tool Works Inc. | 275 | 230 | 254 |
| Kadant Inc. | 410 | 275 | 342.5 |
Analysts expect Illinois Tool Works’ stock to trade slightly above its current price of 255.12 USD, while Kadant’s consensus target of 342.5 USD suggests a meaningful potential gain from its current 319.22 USD.
Analyst Opinions Comparison
This section compares analysts’ ratings and grades for Illinois Tool Works Inc. and Kadant Inc.:
Rating Comparison
Illinois Tool Works Inc. Rating
- Rating: B, evaluated as Very Favorable.
- Discounted Cash Flow Score: 3, indicating moderate valuation.
- ROE Score: 5, showing very favorable efficiency generating profit.
- ROA Score: 5, indicating very favorable asset utilization.
- Debt To Equity Score: 1, very unfavorable, signaling high financial risk.
- Overall Score: 3, rated as moderate overall financial standing.
Kadant Inc. Rating
- Rating: B, evaluated as Very Favorable.
- Discounted Cash Flow Score: 3, indicating moderate valuation.
- ROE Score: 3, showing moderate efficiency generating profit.
- ROA Score: 4, indicating favorable asset utilization.
- Debt To Equity Score: 3, moderate, suggesting balanced financial leverage.
- Overall Score: 3, rated as moderate overall financial standing.
Which one is the best rated?
Based strictly on the provided data, Illinois Tool Works shows stronger efficiency in generating profit and asset utilization with higher ROE and ROA scores, but carries more financial risk due to its debt-to-equity score. Kadant has a more balanced financial risk profile but lower profitability efficiency scores. Both share the same overall moderate score and rating.
Scores Comparison
The scores comparison between Illinois Tool Works Inc. (ITW) and Kadant Inc. (KAI) highlights their financial stability and strength as follows:
ITW Scores
- Altman Z-Score: 7.93, indicating a safe zone with very low bankruptcy risk.
- Piotroski Score: 7, classified as strong financial health.
KAI Scores
- Altman Z-Score: 5.59, also in the safe zone, showing low bankruptcy risk.
- Piotroski Score: 7, likewise strong financial health.
Which company has the best scores?
Both ITW and KAI have Altman Z-Scores in the safe zone, with ITW scoring higher at 7.93 compared to KAI’s 5.59. Their Piotroski Scores are equal at 7, reflecting similarly strong financial health.
Grades Comparison
The grades for Illinois Tool Works Inc. and Kadant Inc. from reputable grading companies are detailed below:
Illinois Tool Works Inc. Grades
This table summarizes recent grades and rating actions from major financial institutions for ITW.
| Grading Company | Action | New Grade | Date |
|---|---|---|---|
| Wells Fargo | Maintain | Underweight | 2026-01-07 |
| Goldman Sachs | Downgrade | Sell | 2025-12-16 |
| B of A Securities | Upgrade | Neutral | 2025-11-18 |
| Barclays | Maintain | Underweight | 2025-10-27 |
| Truist Securities | Maintain | Hold | 2025-10-27 |
| Wells Fargo | Maintain | Underweight | 2025-10-27 |
| Truist Securities | Maintain | Hold | 2025-10-08 |
| Barclays | Downgrade | Underweight | 2025-08-14 |
| Barclays | Maintain | Equal Weight | 2025-08-04 |
| UBS | Maintain | Neutral | 2025-07-31 |
Overall, the grades for Illinois Tool Works Inc. show a tendency towards cautious or negative ratings, with multiple underweight and sell recommendations in recent months.
Kadant Inc. Grades
This table summarizes recent grades and rating actions from major financial institutions for KAI.
| Grading Company | Action | New Grade | Date |
|---|---|---|---|
| Barrington Research | Maintain | Outperform | 2025-10-30 |
| Barrington Research | Maintain | Outperform | 2025-10-29 |
| Barrington Research | Maintain | Outperform | 2025-10-27 |
| Barrington Research | Maintain | Outperform | 2025-10-10 |
| Barrington Research | Maintain | Outperform | 2025-09-23 |
| DA Davidson | Maintain | Neutral | 2025-08-04 |
| Barrington Research | Maintain | Outperform | 2025-07-30 |
| Barrington Research | Maintain | Outperform | 2025-07-29 |
| DA Davidson | Maintain | Neutral | 2025-05-01 |
| Barrington Research | Maintain | Outperform | 2025-05-01 |
Kadant Inc. has predominantly maintained Outperform ratings with no downgrades, supported by some Neutral ratings from DA Davidson.
Which company has the best grades?
Kadant Inc. has consistently received stronger grades, primarily Outperform, compared to Illinois Tool Works Inc., which faces mostly Underweight and Sell ratings. This contrast may influence investor sentiment by signaling stronger positive analyst confidence in Kadant relative to ITW.
Strengths and Weaknesses
Below is a comparison of key strengths and weaknesses for Illinois Tool Works Inc. (ITW) and Kadant Inc. (KAI) based on the latest available data.
| Criterion | Illinois Tool Works Inc. (ITW) | Kadant Inc. (KAI) |
|---|---|---|
| Diversification | Highly diversified across 7 segments with balanced revenue streams (total ~17B USD in 2024). | Less diversified; mainly capital goods and parts/consumables (~1.05B USD in 2024). |
| Profitability | Strong profitability: Net margin 21.94%, ROIC 27.19%, ROE 105.16%. | Moderate profitability: Net margin 10.59%, ROIC 10.08%, ROE 13.17%. |
| Innovation | Demonstrates durable competitive advantage with growing ROIC (62% growth over 5 years). | Improving profitability with growing ROIC (31% growth), but still shedding value overall. |
| Global presence | Large global footprint with numerous industrial segments worldwide. | More niche market presence with focus on paper-making and capital equipment. |
| Market Share | Leading market positions in multiple industrial product lines. | Smaller market share, focused on specialized industrial systems. |
Key takeaways: ITW shows a robust competitive moat with strong diversification and superior profitability, making it a safer long-term investment. KAI is improving but remains less diversified and less profitable, suggesting higher risk but potential for growth.
Risk Analysis
Below is a comparative risk assessment for Illinois Tool Works Inc. (ITW) and Kadant Inc. (KAI) based on the most recent financial and operational data for 2024.
| Metric | Illinois Tool Works Inc. (ITW) | Kadant Inc. (KAI) |
|---|---|---|
| Market Risk | Moderate (Beta 1.17 indicates medium volatility) | Moderate (Beta 1.25, slightly higher volatility) |
| Debt Level | High (Debt to equity 2.44, debt to assets 53.6%) | Low (Debt to equity 0.38, debt to assets 22.6%) |
| Regulatory Risk | Moderate (Industrial sector exposure, global operations) | Moderate (Industrial machinery, environmental standards) |
| Operational Risk | Moderate (Diverse segments but complex supply chains) | Moderate (Specialized segments with niche markets) |
| Environmental Risk | Moderate (Exposure through manufacturing and adhesives) | Moderate (Involves chemicals and industrial processing) |
| Geopolitical Risk | Moderate (US-based but global sales) | Moderate (US-based with international exposure) |
The most significant risk for ITW is its high leverage, which could impact financial flexibility despite strong profitability. KAI’s lower debt reduces financial risk but its higher valuation multiples may pose market risk if growth expectations are not met. Both face typical industrial sector risks, with operational and regulatory factors being key considerations.
Which Stock to Choose?
Illinois Tool Works Inc. (ITW) shows a favorable income evolution with strong net margin growth and profitability indicators. Its financial ratios are slightly favorable overall, despite some unfavorable leverage metrics. The company maintains a very favorable rating supported by excellent return scores but elevated debt levels.
Kadant Inc. (KAI) exhibits favorable income growth over the long term, though recent net margin and EPS growth faced headwinds. Its financial ratios are generally favorable with better leverage and liquidity profiles compared to ITW. The rating is also very favorable, with moderate scores reflecting balanced strengths and risks.
Investors focused on durable competitive advantages and strong profitability might find ITW’s robust income statement and moat evaluation appealing, while those prioritizing financial stability and lower leverage could view KAI’s profile as more favorable. The choice may appear to hinge on risk tolerance and investment strategy.
Disclaimer: Investment carries a risk of loss of initial capital. The past performance is not a reliable indicator of future results. Be sure to understand risks before making an investment decision.
Go Further
I encourage you to read the complete analyses of Illinois Tool Works Inc. and Kadant Inc. to enhance your investment decisions: