In the competitive industrial machinery sector, Illinois Tool Works Inc. (ITW) and Ingersoll Rand Inc. (IR) stand out as prominent players with significant market presence. Both companies innovate across diverse product lines, serving overlapping markets from manufacturing to specialized technologies. This comparison explores their strategies and market positions to guide investors seeking the most compelling opportunity in this dynamic industry. Let’s uncover which company holds the greatest potential for your portfolio.
Table of contents
Companies Overview
I will begin the comparison between Illinois Tool Works Inc. and Ingersoll Rand Inc. by providing an overview of these two companies and their main differences.
Illinois Tool Works Inc. Overview
Illinois Tool Works Inc. manufactures and sells industrial products and equipment worldwide, operating through seven segments including Automotive OEM, Food Equipment, and Welding. It serves automotive, food, construction, and industrial markets. Founded in 1912 and based in Glenview, Illinois, ITW has a strong market presence with a diversified product portfolio and a $74.7B market capitalization.
Ingersoll Rand Inc. Overview
Ingersoll Rand Inc. provides air, fluid, energy, specialty vehicle, and medical technologies globally, operating through Industrial Technologies and Precision and Science Technologies segments. It serves medical, industrial, energy, and agricultural markets. Founded in 1859 and headquartered in Davidson, North Carolina, IR has a $33.8B market cap and a focus on critical technology solutions and aftermarket services.
Key similarities and differences
Both companies operate in the industrial machinery sector and serve global markets with extensive product portfolios. While ITW emphasizes diversified industrial equipment across multiple segments, IR focuses on mission-critical technologies in air, fluid, and precision systems. ITW’s operations are broader with seven segments, whereas IR concentrates on two specialized segments, reflecting distinct strategic approaches within industrial manufacturing.
Income Statement Comparison
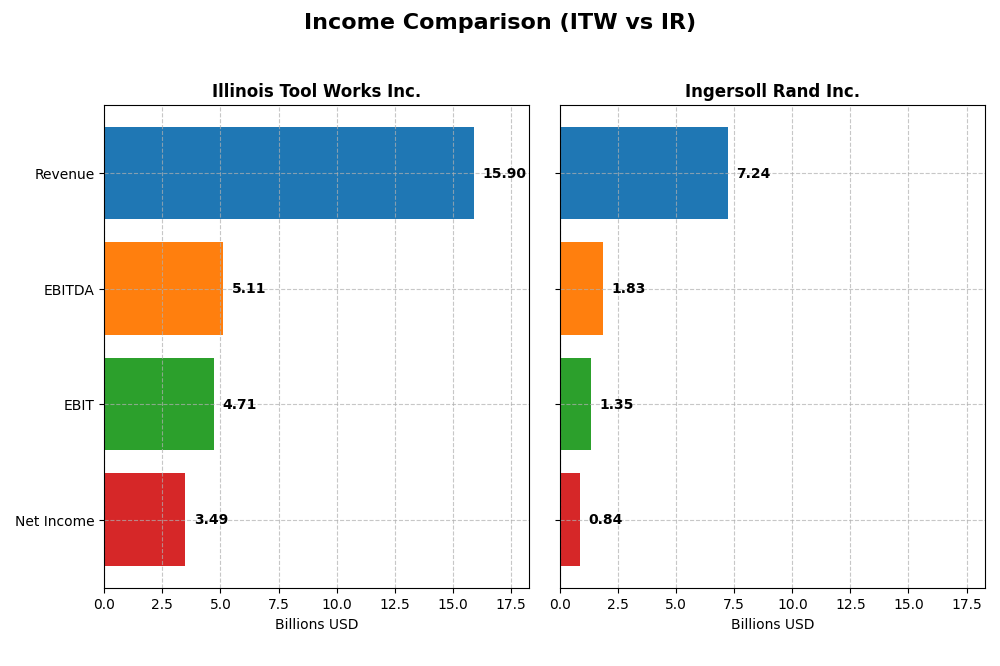
The table below compares key income statement metrics for Illinois Tool Works Inc. and Ingersoll Rand Inc. for the fiscal year ended 2024.
| Metric | Illinois Tool Works Inc. (ITW) | Ingersoll Rand Inc. (IR) |
|---|---|---|
| Market Cap | 74.7B | 33.8B |
| Revenue | 15.9B | 7.2B |
| EBITDA | 5.11B | 1.83B |
| EBIT | 4.71B | 1.35B |
| Net Income | 3.49B | 839M |
| EPS | 11.75 | 2.08 |
| Fiscal Year | 2024 | 2024 |
Income Statement Interpretations
Illinois Tool Works Inc.
Illinois Tool Works (ITW) showed a generally positive trend in revenue and net income from 2020 to 2024, with revenue increasing by 26.44% and net income by 65.39%. Margins remained strong and favorable, with a gross margin of 43.65% and net margin of 21.94%. In 2024, revenue slightly declined by 1.3%, but net income and net margins improved significantly, reflecting enhanced operational efficiency.
Ingersoll Rand Inc.
Ingersoll Rand (IR) experienced robust growth over the 2020-2024 period, with revenue rising 82.1% and net income surging by over 2600%. Margins were stable and favorable, including a gross margin of 43.81% and net margin of 11.59%. The latest year saw a 5.22% revenue increase and solid growth in EBIT and EPS, although operating expenses grew proportionally, slightly dampening margin expansion.
Which one has the stronger fundamentals?
Both companies demonstrate favorable income statement fundamentals with strong gross margins and improving net margins. ITW maintains higher net margins and better interest expense control, while IR posts much higher overall revenue and net income growth rates. ITW’s slight recent revenue dip contrasts with IR’s steady revenue gains, suggesting differing momentum despite comparable quality in profitability metrics.
Financial Ratios Comparison
The table below presents a side-by-side comparison of key financial ratios for Illinois Tool Works Inc. (ITW) and Ingersoll Rand Inc. (IR) for the fiscal year 2024, highlighting their recent performance metrics.
| Ratios | Illinois Tool Works Inc. (ITW) | Ingersoll Rand Inc. (IR) |
|---|---|---|
| ROE | 105.2% | 8.2% |
| ROIC | 27.2% | 6.1% |
| P/E | 21.6 | 43.5 |
| P/B | 22.7 | 3.58 |
| Current Ratio | 1.36 | 2.29 |
| Quick Ratio | 0.99 | 1.71 |
| D/E (Debt-to-Equity) | 2.44 | 0.49 |
| Debt-to-Assets | 53.6% | 27.7% |
| Interest Coverage | 15.1 | 6.1 |
| Asset Turnover | 1.06 | 0.40 |
| Fixed Asset Turnover | 6.91 | 8.59 |
| Payout ratio | 48.6% | 3.9% |
| Dividend yield | 2.25% | 0.09% |
Interpretation of the Ratios
Illinois Tool Works Inc.
Illinois Tool Works shows generally strong profitability ratios, with a net margin of 21.94% and an exceptionally high return on equity at 105.16%, indicating efficient capital use. However, its high price-to-book ratio (22.69) and debt metrics are less favorable, suggesting elevated leverage risk. The company pays a dividend with a 2.25% yield, supported by decent free cash flow, though some leverage concerns persist.
Ingersoll Rand Inc.
Ingersoll Rand demonstrates moderate profitability with a net margin of 11.59%, but its return on equity at 8.24% is weak, raising questions about capital efficiency. Financial health is solid, with favorable current and quick ratios and low debt levels. Dividend yield is very low at 0.09%, reflecting limited shareholder returns, possibly due to reinvestment priorities or conservative payout policy.
Which one has the best ratios?
Both companies have half of their ratios rated favorable, but Illinois Tool Works scores better on profitability and shareholder returns, despite higher leverage concerns. In contrast, Ingersoll Rand shows stronger liquidity and lower debt but weaker profitability and shareholder yield. The choice depends on investor preference for profitability versus balance sheet strength.
Strategic Positioning
This section compares the strategic positioning of Illinois Tool Works (ITW) and Ingersoll Rand (IR), covering market position, key segments, and exposure to technological disruption:
Illinois Tool Works (ITW)
- Market leader with a market cap of 74.7B, diversified across seven segments, facing moderate competitive pressure.
- Diverse segments include Automotive OEM, Food Equipment, Welding, and Specialty Products, driving broad industrial exposure.
- Exposure to disruption is balanced across industrial machinery and electronics, leveraging longstanding industry presence.
Ingersoll Rand (IR)
- Smaller market cap of 33.8B, operates mainly in two segments, with higher beta indicating greater market volatility.
- Focused on Industrial Technologies and Precision Science, emphasizing air, fluid, and medical technology markets.
- Exposure concentrated in air compression and fluid systems, with potential risks from technology shifts in specialized markets.
Illinois Tool Works (ITW) vs Ingersoll Rand (IR) Positioning
ITW’s diversified segment approach spreads risk and taps multiple industrial markets, supporting stable revenue streams. IR’s concentrated focus on air, fluid, and medical technologies may yield specialization advantages but limits diversification benefits. ITW’s larger scale contrasts with IR’s niche focus.
Which has the best competitive advantage?
ITW shows a very favorable moat with strong and growing ROIC exceeding WACC, indicating durable competitive advantage. IR has a slightly unfavorable moat, currently shedding value despite improving profitability, suggesting weaker competitive positioning.
Stock Comparison
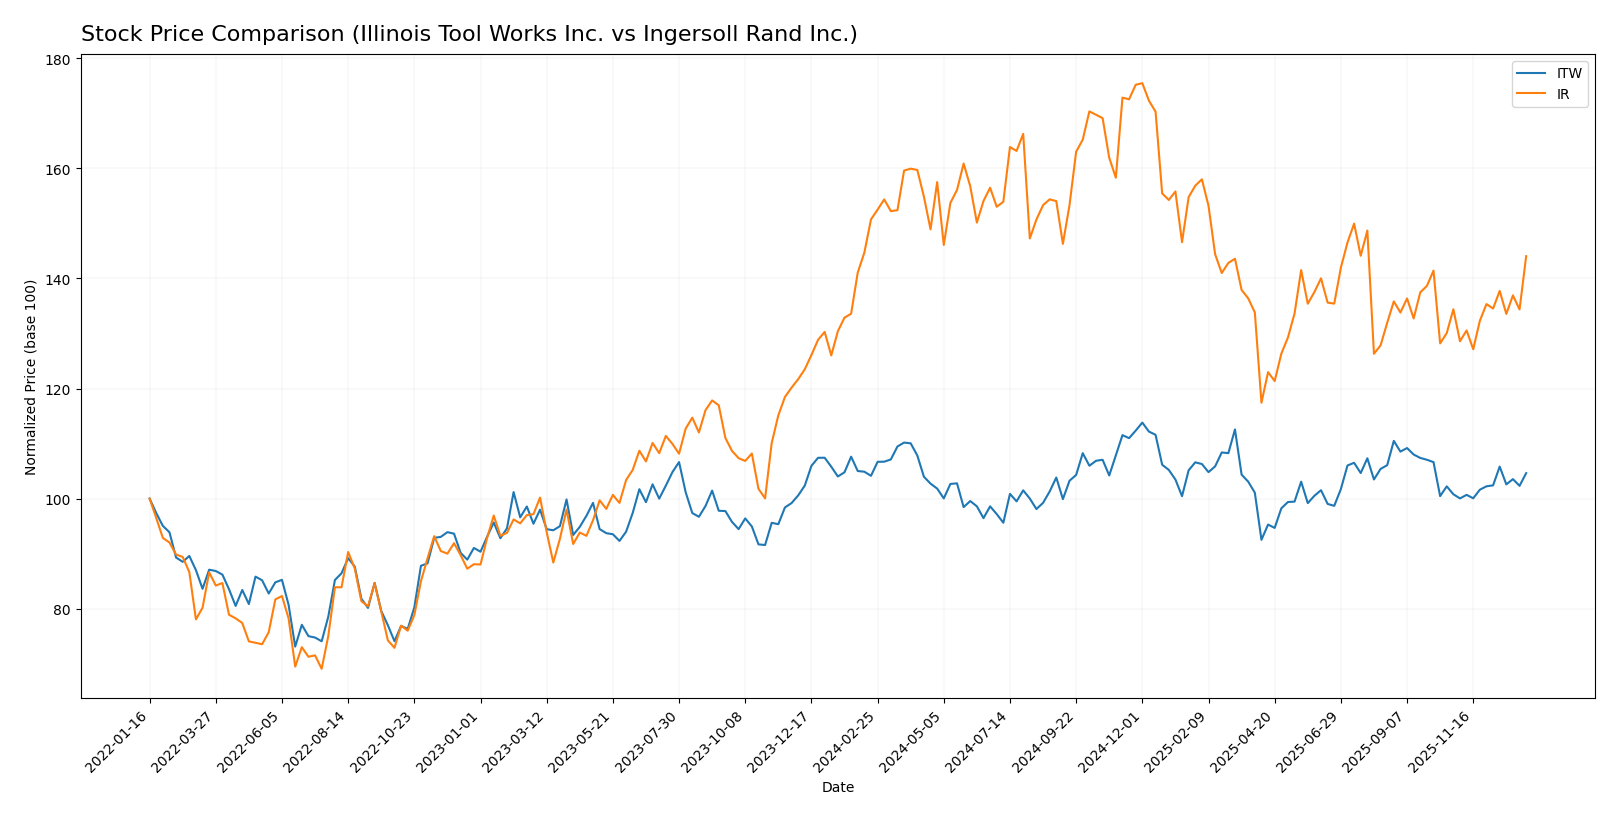
The stock price movements over the past 12 months reveal contrasting trends between Illinois Tool Works Inc. and Ingersoll Rand Inc., with Illinois Tool Works showing modest gains and Ingersoll Rand experiencing a notable decline followed by recent recovery.
Trend Analysis
Illinois Tool Works Inc. (ITW) recorded a slight overall price increase of 0.47% over the past year, indicating a neutral to mildly bullish trend with accelerating momentum. The stock ranged between 225.57 and 277.52, displaying moderate volatility with a standard deviation of 10.66.
Ingersoll Rand Inc. (IR) faced a 4.43% decline over the same period, reflecting a bearish trend with acceleration. The stock price fluctuated from 69.7 to 104.17 and showed a lower volatility than ITW, with a standard deviation of 8.07.
Comparing both, Illinois Tool Works delivered the highest market performance over the last 12 months, maintaining stability and slight growth, whereas Ingersoll Rand experienced a more pronounced downturn despite recent gains.
Target Prices
The current analyst consensus suggests moderate upside potential for Illinois Tool Works Inc. and Ingersoll Rand Inc.
| Company | Target High | Target Low | Consensus |
|---|---|---|---|
| Illinois Tool Works Inc. | 275 | 230 | 254 |
| Ingersoll Rand Inc. | 100 | 81 | 91.5 |
Analysts expect Illinois Tool Works’ price to hover around its current level of 255.12 USD, indicating a balanced outlook. Ingersoll Rand’s consensus target of 91.5 USD suggests a potential price appreciation from the current 85.51 USD market price.
Analyst Opinions Comparison
This section compares analysts’ ratings and grades for Illinois Tool Works Inc. and Ingersoll Rand Inc.:
Rating Comparison
Illinois Tool Works Inc. Rating
- Rating: B, considered Very Favorable
- Discounted Cash Flow Score: 3, Moderate rating
- Return on Equity Score: 5, Very Favorable rating
- Return on Assets Score: 5, Very Favorable rating
- Debt To Equity Score: 1, Very Unfavorable rating
- Overall Score: 3, Moderate rating
Ingersoll Rand Inc. Rating
- Rating: C+, considered Very Favorable
- Discounted Cash Flow Score: 3, Moderate rating
- Return on Equity Score: 2, Moderate rating
- Return on Assets Score: 3, Moderate rating
- Debt To Equity Score: 2, Moderate rating
- Overall Score: 2, Moderate rating
Which one is the best rated?
Illinois Tool Works Inc. holds a higher overall rating of B compared to Ingersoll Rand Inc.’s C+. ITW scores better in return on equity and assets but has a less favorable debt-to-equity rating. Overall, ITW is better rated based on these metrics.
Scores Comparison
Here is a comparison of the Altman Z-Score and Piotroski Score for Illinois Tool Works Inc. and Ingersoll Rand Inc.:
ITW Scores
- Altman Z-Score: 7.93, indicating a safe zone with low bankruptcy risk.
- Piotroski Score: 7, classified as strong financial health.
IR Scores
- Altman Z-Score: 3.27, indicating a safe zone with low bankruptcy risk.
- Piotroski Score: 5, classified as average financial health.
Which company has the best scores?
Based on the provided data, ITW has higher Altman Z-Score and Piotroski Score values than IR, reflecting stronger financial stability and health. IR’s scores are lower but still within safe and average ranges respectively.
Grades Comparison
Here is a comparison of the recent grades assigned to Illinois Tool Works Inc. and Ingersoll Rand Inc.:
Illinois Tool Works Inc. Grades
This table summarizes recent grades given by reputable grading companies for Illinois Tool Works Inc.:
| Grading Company | Action | New Grade | Date |
|---|---|---|---|
| Wells Fargo | Maintain | Underweight | 2026-01-07 |
| Goldman Sachs | Downgrade | Sell | 2025-12-16 |
| B of A Securities | Upgrade | Neutral | 2025-11-18 |
| Barclays | Maintain | Underweight | 2025-10-27 |
| Truist Securities | Maintain | Hold | 2025-10-27 |
| Wells Fargo | Maintain | Underweight | 2025-10-27 |
| Truist Securities | Maintain | Hold | 2025-10-08 |
| Barclays | Downgrade | Underweight | 2025-08-14 |
| Barclays | Maintain | Equal Weight | 2025-08-04 |
| UBS | Maintain | Neutral | 2025-07-31 |
The overall trend for Illinois Tool Works shows predominantly cautious to negative ratings, with multiple underweight and sell grades and a consensus rating of Hold.
Ingersoll Rand Inc. Grades
Below are recent grades provided by reliable grading firms for Ingersoll Rand Inc.:
| Grading Company | Action | New Grade | Date |
|---|---|---|---|
| Wells Fargo | Maintain | Overweight | 2026-01-07 |
| Stifel | Maintain | Hold | 2025-12-16 |
| Citigroup | Maintain | Buy | 2025-12-08 |
| Citigroup | Maintain | Buy | 2025-11-03 |
| Baird | Maintain | Outperform | 2025-11-03 |
| Stifel | Maintain | Hold | 2025-10-20 |
| Wells Fargo | Maintain | Overweight | 2025-10-06 |
| Morgan Stanley | Maintain | Equal Weight | 2025-08-13 |
| Barclays | Maintain | Overweight | 2025-08-04 |
| Stifel | Maintain | Hold | 2025-08-04 |
Ingersoll Rand’s grades predominantly indicate positive sentiment with multiple buy, outperform, and overweight ratings, supported by a consensus rating of Buy.
Which company has the best grades?
Ingersoll Rand Inc. consistently receives better grades than Illinois Tool Works Inc., with more buy and overweight recommendations versus predominantly hold and sell ratings for Illinois Tool Works. This disparity suggests that investors may view Ingersoll Rand as having stronger growth or value prospects.
Strengths and Weaknesses
Below is a comparison table highlighting key strengths and weaknesses of Illinois Tool Works Inc. (ITW) and Ingersoll Rand Inc. (IR) based on their latest financials and strategic positions.
| Criterion | Illinois Tool Works Inc. (ITW) | Ingersoll Rand Inc. (IR) |
|---|---|---|
| Diversification | Highly diversified across 7+ segments with balanced revenue streams (e.g., Automotive OEM $3.19B, Food Equipment $2.65B) | Less diversified, focused mainly on Industrial Technologies & Services ($5.82B) and Precision & Science Technologies ($1.42B) |
| Profitability | Strong profitability: Net margin 21.94%, ROE 105.16%, ROIC 27.19% | Moderate profitability: Net margin 11.59%, ROE 8.24%, ROIC 6.11% |
| Innovation | Demonstrates durable competitive advantage with growing ROIC (+62%), indicating sustained innovation and value creation | ROIC negative vs WACC (-3.1%) but improving sharply (+1067%), signaling recovering innovation momentum |
| Global presence | Established global footprint with diverse industrial applications across sectors | Global presence focused primarily on industrial and precision tech markets |
| Market Share | Leading market positions in multiple industrial and specialty product segments | Strong position in industrial technologies but smaller market scope than ITW |
Key takeaways: ITW stands out for its strong diversification and superior profitability, supported by a very favorable moat and stable financial ratios. IR, while currently shedding value, shows promising ROIC growth and solid balance sheet metrics, suggesting potential for turnaround and future value creation. Investors should weigh ITW’s stability against IR’s growth potential with caution.
Risk Analysis
Below is a comparison of key risks for Illinois Tool Works Inc. (ITW) and Ingersoll Rand Inc. (IR) based on the most recent data from 2024.
| Metric | Illinois Tool Works Inc. (ITW) | Ingersoll Rand Inc. (IR) |
|---|---|---|
| Market Risk | Beta 1.17, moderate volatility | Beta 1.33, higher volatility |
| Debt level | High debt-to-assets 53.6%, unfavorable leverage (D/E 2.44) | Moderate debt-to-assets 27.7%, favorable leverage (D/E 0.49) |
| Regulatory Risk | Moderate, operates globally with exposure to industrial regulations | Moderate, diverse product lines face regulatory scrutiny |
| Operational Risk | Diverse segments reduce risk, stable operations | Focused segments, moderate operational risks |
| Environmental Risk | Medium, industrial manufacturing impact | Medium, includes energy and fluid technologies |
| Geopolitical Risk | Moderate, global footprint including emerging markets | Moderate, wide geographic operations |
The most impactful risks are ITW’s high leverage, which could increase financial vulnerability in downturns, and IR’s higher market volatility and moderate operational risks. Both companies maintain a safe zone Altman Z-Score, indicating low bankruptcy risk, but ITW’s debt level remains a caution point.
Which Stock to Choose?
Illinois Tool Works Inc. (ITW) shows a favorable income evolution with strong profitability metrics, including a net margin of 21.94% and return on equity above 100%. Its debt levels are relatively high, reflected in an unfavorable debt-to-equity ratio, yet it maintains a very favorable credit rating and a durable economic moat with increasing ROIC.
Ingersoll Rand Inc. (IR) exhibits a positive income growth trend with a net margin of 11.59%, but lower profitability ratios overall. Its financial leverage is conservative, with favorable debt metrics and a solid current ratio. However, IR’s economic moat is slightly unfavorable due to ROIC below WACC, despite a recent improvement in profitability, and it holds a favorable rating with moderate scores.
For investors prioritizing durable competitive advantage and high profitability, Illinois Tool Works may appear more favorable given its strong income statement and very favorable moat status. Conversely, investors focused on lower leverage and improving growth might find Ingersoll Rand’s profile more aligned with their preferences, considering its moderate rating and improving ROIC trend.
Disclaimer: Investment carries a risk of loss of initial capital. The past performance is not a reliable indicator of future results. Be sure to understand risks before making an investment decision.
Go Further
I encourage you to read the complete analyses of Illinois Tool Works Inc. and Ingersoll Rand Inc. to enhance your investment decisions: