Home > Comparison > Healthcare > IDXX vs WAT
The strategic rivalry between IDEXX Laboratories, Inc. and Waters Corporation shapes innovation in the healthcare diagnostics sector. IDEXX operates as a diversified provider of veterinary and environmental diagnostic products, while Waters specializes in high-performance analytical instruments for life sciences. This face-off highlights a contrast between broad market reach and specialized technological leadership. This analysis will identify which company’s trajectory offers superior risk-adjusted returns for a diversified portfolio in 2026.
Table of contents
Companies Overview
IDEXX Laboratories and Waters Corporation both command significant influence in the global medical diagnostics sector.
IDEXX Laboratories, Inc.: Leader in Veterinary and Water Diagnostics
IDEXX Laboratories dominates the companion animal veterinary and water testing markets. Its core revenue derives from point-of-care veterinary diagnostic products, including rapid assay test kits and diagnostic imaging systems. In 2026, IDEXX focuses strategically on expanding veterinary software solutions and enhancing water quality testing technologies to strengthen its competitive moat.
Waters Corporation: Specialist in Analytical Measurement Systems
Waters Corporation leads in analytical workflow solutions with a competitive advantage in high-performance liquid chromatography and mass spectrometry instruments. Its revenue engine thrives on selling and servicing advanced measurement systems for pharmaceutical, environmental, and life sciences research. Waters emphasizes innovation in software integration and post-warranty services to maintain its edge in laboratory applications.
Strategic Collision: Similarities & Divergences
Both companies excel in medical diagnostics but diverge sharply in approach. IDEXX targets veterinary and water testing markets with a closed ecosystem of consumables and software, while Waters pursues an open infrastructure with high-end analytical instruments across life sciences. Their primary battleground is precision diagnostics, yet IDEXX offers broad veterinary solutions, whereas Waters specializes in laboratory instrumentation. Each presents distinct investment profiles shaped by differing market scopes and innovation strategies.
Income Statement Comparison
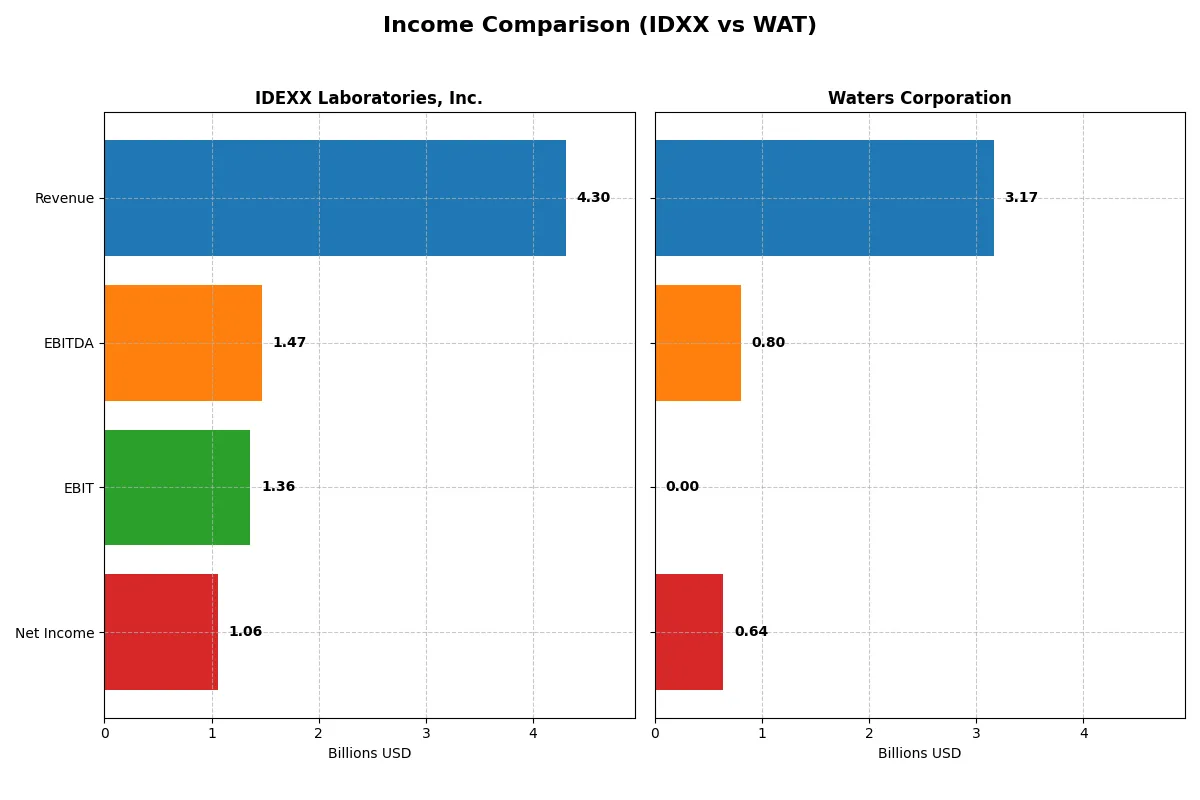
This data dissects the core profitability and scalability of both corporate engines to reveal who dominates the bottom line:
| Metric | IDEXX Laboratories, Inc. (IDXX) | Waters Corporation (WAT) |
|---|---|---|
| Revenue | 4.30B | 3.17B |
| Cost of Revenue | 1.64B | 1.29B |
| Operating Expenses | 1.30B | 1.03B |
| Gross Profit | 2.66B | 1.88B |
| EBITDA | 1.47B | 803M |
| EBIT | 1.36B | — |
| Interest Expense | 38M | -51M |
| Net Income | 1.06B | 643M |
| EPS | 13.17 | 10.80 |
| Fiscal Year | 2025 | 2025 |
Income Statement Analysis: The Bottom-Line Duel
This income statement comparison reveals which company delivers superior operational efficiency and bottom-line growth over recent years.
IDEXX Laboratories, Inc. Analysis
IDEXX shows robust revenue growth, rising from 3.22B in 2021 to 4.30B in 2025, with net income climbing 42% over five years to 1.06B. Gross margins remain healthy at 61.8%, while net margins expanded to 24.6%, reflecting strong cost control. In 2025, EBIT surged 19%, signaling accelerating operational momentum.
Waters Corporation Analysis
Waters’ revenue increased modestly from 2.79B in 2021 to 3.17B in 2025, while net income declined 7% to 643M. Gross margin stays favorable at 59.3%, but EBIT margin dropped sharply to zero, indicating operational challenges. The 2025 net margin slipped to 20.3%, with a 6.99% revenue growth overshadowed by weakening profitability.
Verdict: Margin Power vs. Revenue Scale
IDEXX dominates in margin expansion and net income growth, leveraging higher efficiency and accelerating EBIT gains. Waters shows respectable revenue scale but struggles with declining profitability and EBIT erosion. For investors prioritizing profit quality and growth momentum, IDEXX’s profile stands out as the stronger fundamental performer.
Financial Ratios Comparison
These vital ratios act as a diagnostic tool to expose the underlying fiscal health, valuation premiums, and capital efficiency of the companies analyzed:
| Ratios | IDEXX Laboratories, Inc. (IDXX) | Waters Corporation (WAT) |
|---|---|---|
| ROE | 66.0% | 0% |
| ROIC | 40.7% | 0% |
| P/E | 51.1 | 35.2 |
| P/B | 33.8 | 0 |
| Current Ratio | 1.23 | 0 |
| Quick Ratio | 0.90 | 0 |
| D/E (Debt-to-Equity) | 0.53 | 0 |
| Debt-to-Assets | 25.3% | 0 |
| Interest Coverage | 35.5 | -15.8 |
| Asset Turnover | 1.28 | 0 |
| Fixed Asset Turnover | 5.76 | 0 |
| Payout ratio | 0 | 0 |
| Dividend yield | 0 | 0 |
| Fiscal Year | 2025 | 2025 |
Efficiency & Valuation Duel: The Vital Signs
Financial ratios serve as a company’s DNA, revealing hidden risks and operational excellence crucial for investment decisions.
IDEXX Laboratories, Inc.
IDXX demonstrates exceptional profitability with a 66% ROE and a strong 24.6% net margin, signaling operational efficiency. However, its valuation appears stretched, trading at a high 51.15 P/E and 33.75 P/B. The firm does not pay dividends but reinvests heavily in R&D, fueling growth and sustaining its competitive moat.
Waters Corporation
Waters posts a healthy 20.3% net margin but shows no reported ROE or ROIC, raising concerns on profitability measurement. Its P/E of 35.17 suggests a premium valuation, though other liquidity and leverage ratios are unavailable or unfavorable. The absence of dividends and unclear shareholder returns suggest reinvestment strategies remain opaque.
Operational Strength vs. Valuation Risk
IDXX offers superior operational metrics but carries a high valuation premium, while Waters faces unclear profitability and liquidity challenges. Investors seeking proven efficiency might favor IDXX’s profile, whereas Waters’ riskier financial transparency fits a different, more speculative appetite.
Which one offers the Superior Shareholder Reward?
IDEXX Laboratories (IDXX) and Waters Corporation (WAT) both forgo dividends, focusing on reinvestment and buybacks. IDXX exhibits zero dividend yield and payout ratio, reinvesting heavily in R&D and sustaining a robust free cash flow of 13.2/share in 2025. WAT also pays no dividends but generates slightly lower free cash flow of 9.1/share in 2025. Both companies pursue share buybacks, though IDXX’s superior operating margins (~32%) and consistent FCF coverage suggest it has more capacity for sustainable buybacks. WAT’s weaker interest coverage and higher leverage introduce risk. I conclude IDXX offers a more attractive total return profile in 2026 due to stronger cash flow generation and sustainable capital allocation.
Comparative Score Analysis: The Strategic Profile
The radar chart reveals the fundamental DNA and trade-offs of IDEXX Laboratories and Waters Corporation:
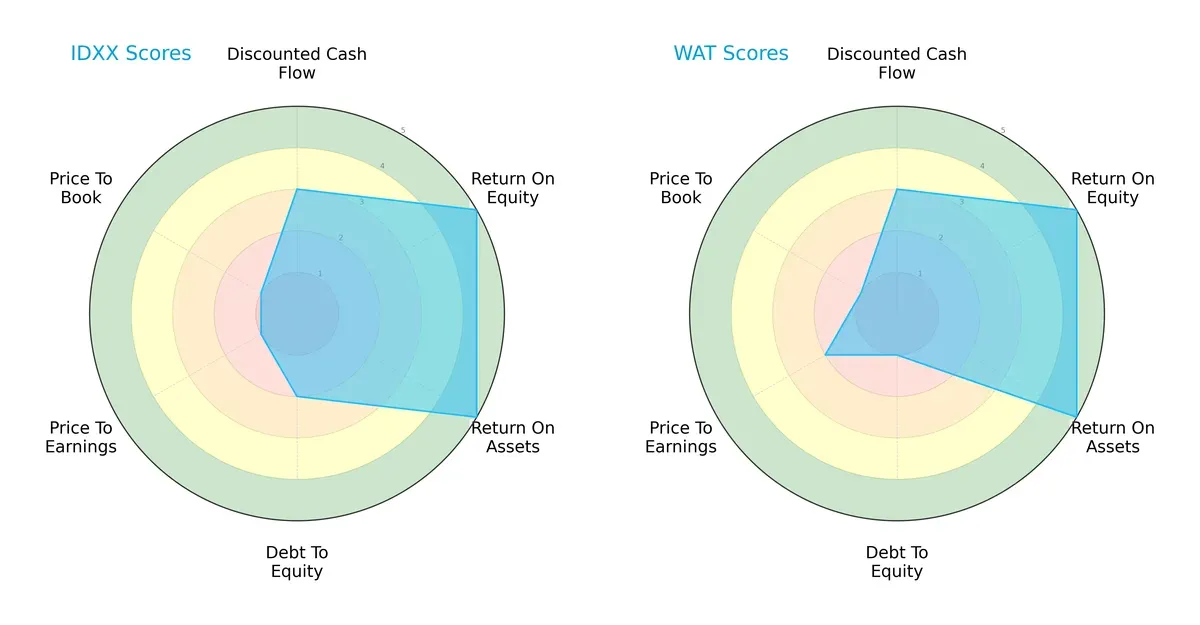
Both firms exhibit identical strength in discounted cash flow, return on equity, and return on assets, indicating robust profitability and cash generation. IDEXX manages its debt slightly better, scoring 2 versus Waters’ 1, but both carry challenges in valuation metrics, with very unfavorable price-to-book scores. Waters shows a marginally better price-to-earnings score, suggesting a relatively more attractive valuation. IDEXX’s profile balances operational efficiency with moderate leverage risk, while Waters relies on a stronger valuation edge amid heavier debt.
Bankruptcy Risk: Solvency Showdown
IDEXX’s Altman Z-Score stands at 20.3, significantly above Waters’ 6.4, placing both comfortably in the safe zone:
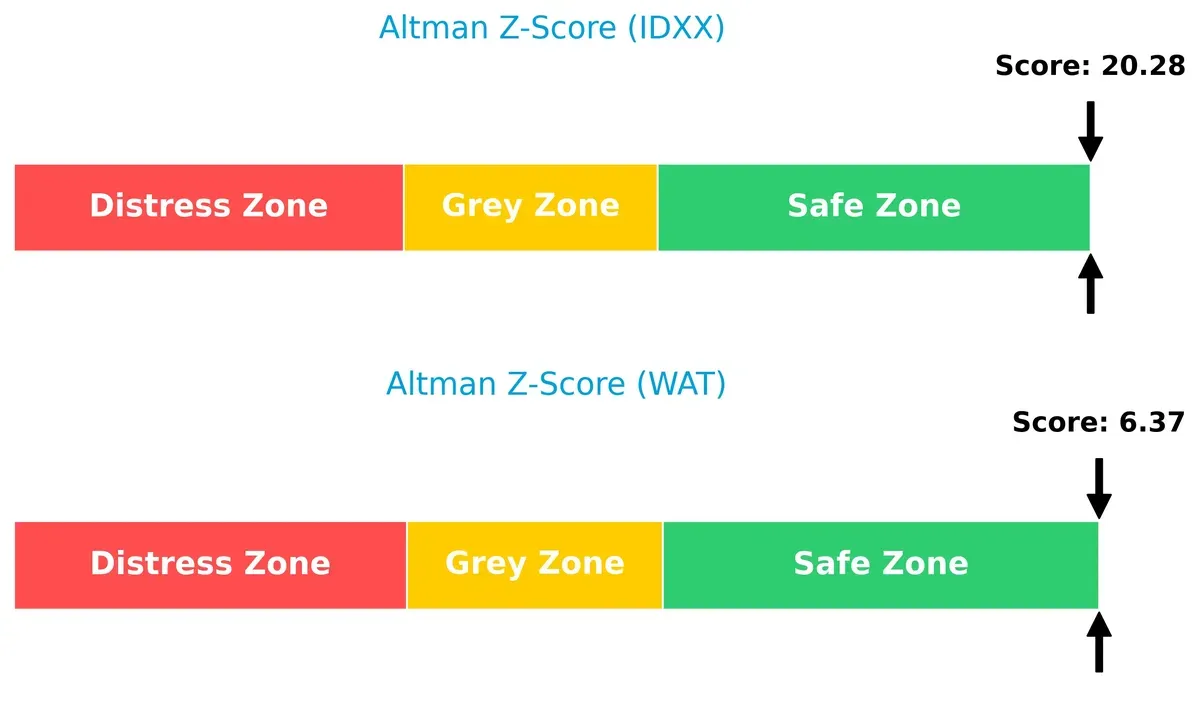
This wide margin highlights IDEXX’s exceptional financial stability, signaling very low bankruptcy risk. Waters, while also safe, shows a higher relative risk, warranting careful monitoring in economic downturns.
Financial Health: Quality of Operations
IDEXX scores an 8 on the Piotroski F-Score, outperforming Waters’ 6, indicating superior financial health and operational quality:
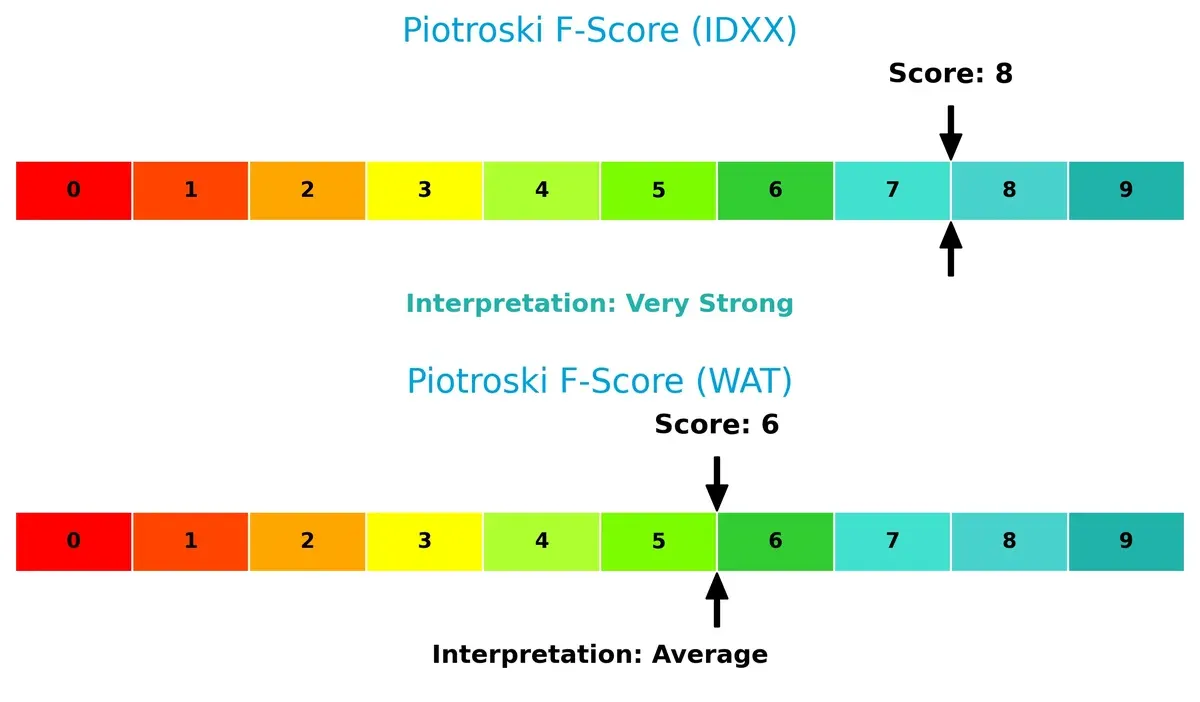
IDEXX’s near-peak score reflects strong profitability, liquidity, and efficient capital allocation. Waters’ average score suggests moderate internal red flags, requiring scrutiny of its operational resilience. I see IDEXX as the healthier operator with clearer internal strengths.
How are the two companies positioned?
This section dissects the operational DNA of IDXX and WAT by comparing their revenue distribution by segment and internal dynamics. The goal is to confront their economic moats to identify which model offers the most resilient, sustainable competitive advantage today.
Revenue Segmentation: The Strategic Mix
This comparison dissects how IDEXX Laboratories and Waters Corporation diversify their income streams and where their primary sector bets lie:
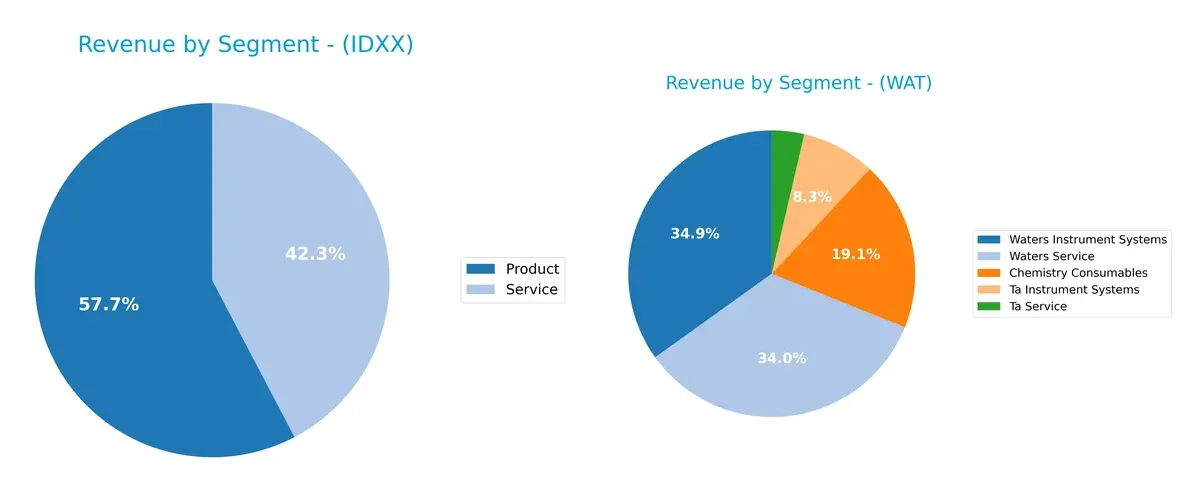
IDEXX leans heavily on Product ($2.25B) and Service ($1.65B) segments, showing a balanced two-pillar model. Waters displays greater segmentation, with Waters Instrument Systems ($1.03B) and Waters Service ($1.01B) nearly equal but supplemented by Chemistry Consumables ($565M) and Ta Instrument Systems plus Service (~$354M total). IDEXX’s concentration on core products and services suggests focused ecosystem lock-in, while Waters’ broader mix reflects infrastructure dominance but with moderate diversification reducing single-segment risk.
Strengths and Weaknesses Comparison
This table compares the Strengths and Weaknesses of IDEXX Laboratories, Inc. (IDXX) and Waters Corporation (WAT):
IDXX Strengths
- High net margin (24.62%) and ROE (65.99%)
- Favorable ROIC (40.68%) well above WACC (11.32%)
- Strong asset turnover metrics
- Diversified revenue from products and services
- Solid global presence with significant US, EMEA, and Asia Pacific sales
- Low debt-to-assets ratio (25.3%) and strong interest coverage
WAT Strengths
- Favorable net margin (20.3%)
- Positive market presence with diversified product and service revenue streams
- Balanced geographic sales across Americas, Asia Pacific, and Europe
- Favorable debt-to-assets and debt-to-equity ratios indicating low leverage
- Favorable price-to-book ratio
IDXX Weaknesses
- High valuation multiples (P/E 51.15, P/B 33.75) may limit upside
- Neutral liquidity ratios (current 1.23, quick 0.9)
- No dividend yield
- WACC above sector average indicates higher capital cost
WAT Weaknesses
- Zero or unavailable key profitability ratios (ROE 0%, ROIC 0%)
- Unfavorable liquidity ratios (current and quick ratio at 0)
- Negative interest coverage suggesting financial strain
- Asset turnover ratios not reported or unfavorable
- No dividend yield and unfavorable P/E
IDXX demonstrates robust profitability and efficient capital use, supported by diversified revenue and global reach. WAT shows strengths in leverage and geographic diversification but faces significant profitability and liquidity challenges, which could affect strategic flexibility.
The Moat Duel: Analyzing Competitive Defensibility
A structural moat is the only reliable barrier shielding long-term profits from relentless competition erosion. Here’s how IDEXX and Waters stack up:
IDEXX Laboratories, Inc.: Intangible Assets and Switching Costs Moat
IDEXX leverages proprietary diagnostic technologies and embedded software that lock customers in. Its 31.7% EBIT margin and 24.6% net margin reflect strong moat-driven pricing power. Expansion in human diagnostics in 2026 could deepen this advantage but requires cautious monitoring.
Waters Corporation: Technology Leadership and Cost Advantage Moat
Waters hinges on high-performance liquid chromatography and mass spectrometry systems with costly switching hurdles. However, flat EBIT and declining net margins signal margin pressure unlike IDEXX. New software integration offers growth, yet competitive threats remain substantial in 2026.
Moat Battle: Intangible Assets vs. Technology Leadership
IDEXX wields a wider moat with robust profitability and value creation (ROIC > WACC by 29%). Waters’ declining returns and margin erosion reveal a weakening moat. IDEXX is better positioned to defend and extend market share in the evolving diagnostics arena.
Which stock offers better returns?
IDEXX Laboratories, Inc. shows strong gains over the past year despite recent weakness. Waters Corporation experiences a steady decline with decelerating bearish momentum.
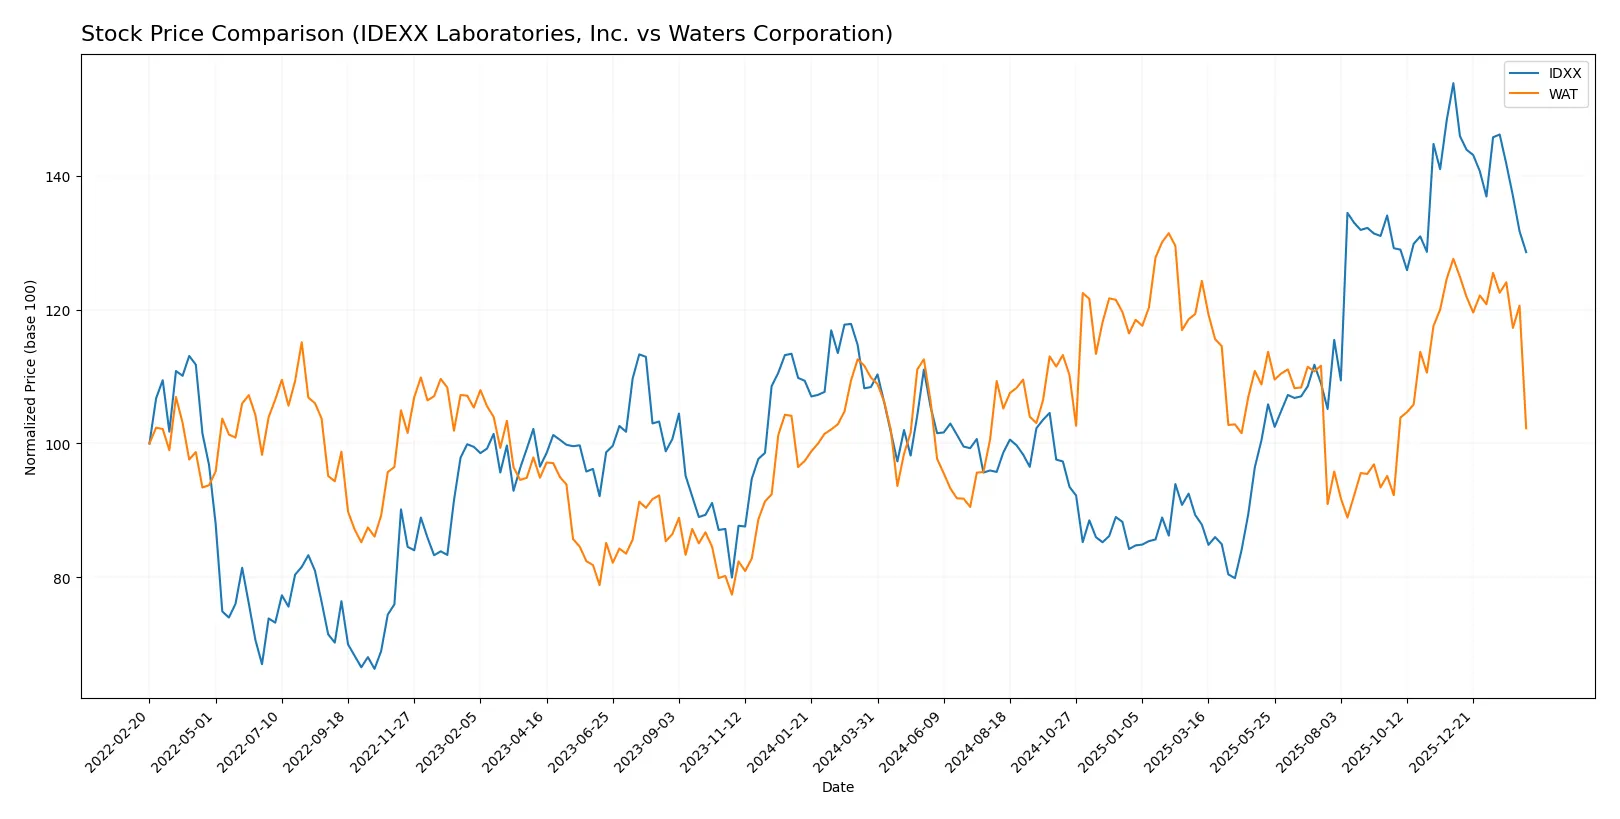
Trend Comparison
IDEXX Laboratories’ stock price rose 18.58% over the last 12 months, indicating a bullish trend with decelerating upward momentum despite recent negative returns. Waters Corporation’s stock fell 6.89% over the same period, reflecting a bearish trend with slowing downward momentum and consistent price declines. IDEXX Laboratories outperformed Waters Corporation, delivering the highest market returns among the two companies.
Target Prices
Analysts present a bullish consensus for IDEXX Laboratories and Waters Corporation, indicating potential upside from current prices.
| Company | Target Low | Target High | Consensus |
|---|---|---|---|
| IDEXX Laboratories, Inc. | 730 | 830 | 784.38 |
| Waters Corporation | 363 | 480 | 410.13 |
IDEXX’s consensus target at 784.38 suggests a 25% premium to its 629.35 price, reflecting confidence in diagnostics growth. Waters’ 410.13 target stands 27% above the 323.37 current price, signaling strong expectations for its analytical solutions.

Don’t Let Luck Decide Your Entry Point
Optimize your entry points with our advanced ProRealTime indicators. You’ll get efficient buy signals with precise price targets for maximum performance. Start outperforming now!
How do institutions grade them?
IDEXX Laboratories, Inc. Grades
The following table summarizes recent grades from verified institutions for IDEXX Laboratories, Inc.:
| Grading Company | Action | New Grade | Date |
|---|---|---|---|
| Piper Sandler | Maintain | Neutral | 2026-02-09 |
| Barclays | Maintain | Overweight | 2026-02-05 |
| UBS | Maintain | Neutral | 2026-02-03 |
| BTIG | Maintain | Buy | 2026-02-03 |
| Morgan Stanley | Maintain | Overweight | 2025-11-04 |
| JP Morgan | Maintain | Overweight | 2025-11-04 |
| BTIG | Maintain | Buy | 2025-11-04 |
| UBS | Maintain | Neutral | 2025-11-04 |
| Stifel | Upgrade | Buy | 2025-10-31 |
| Morgan Stanley | Maintain | Overweight | 2025-08-15 |
Waters Corporation Grades
The following table summarizes recent grades from verified institutions for Waters Corporation:
| Grading Company | Action | New Grade | Date |
|---|---|---|---|
| Wells Fargo | Maintain | Equal Weight | 2026-02-11 |
| UBS | Maintain | Neutral | 2026-02-10 |
| B of A Securities | Maintain | Neutral | 2026-02-10 |
| Guggenheim | Maintain | Buy | 2026-02-10 |
| Wells Fargo | Maintain | Equal Weight | 2025-12-15 |
| Wolfe Research | Upgrade | Outperform | 2025-12-10 |
| Wells Fargo | Maintain | Equal Weight | 2025-11-05 |
| TD Cowen | Maintain | Hold | 2025-11-05 |
| JP Morgan | Maintain | Neutral | 2025-10-09 |
| Deutsche Bank | Maintain | Hold | 2025-08-05 |
Which company has the best grades?
IDEXX Laboratories holds consistently stronger grades, including multiple “Overweight” and “Buy” ratings. Waters Corporation’s grades cluster around “Neutral,” “Hold,” and “Equal Weight,” with fewer upgrades. Investors may perceive IDEXX as having a more favorable outlook from analysts.
Risks specific to each company
The following categories identify the critical pressure points and systemic threats facing both firms in the 2026 market environment:
1. Market & Competition
IDEXX Laboratories, Inc.
- Operates in the highly competitive veterinary and water diagnostics space with strong innovation pressure.
Waters Corporation
- Faces intense competition in analytical instruments and chromatography, relying on technological edge.
2. Capital Structure & Debt
IDEXX Laboratories, Inc.
- Moderate debt-to-equity at 0.53 with favorable debt-to-assets (25.3%). Interest coverage strong at 35.6x.
Waters Corporation
- Very conservative capital structure, minimal debt reported but weak interest coverage signals potential liquidity issues.
3. Stock Volatility
IDEXX Laboratories, Inc.
- Beta of 1.66 indicates above-average volatility compared to the market.
Waters Corporation
- Lower beta at 1.18 suggests more stability than IDEXX but still above market average.
4. Regulatory & Legal
IDEXX Laboratories, Inc.
- Exposure to veterinary and human diagnostics regulation, requiring continuous compliance investment.
Waters Corporation
- Subject to strict regulations in pharmaceutical and environmental testing sectors.
5. Supply Chain & Operations
IDEXX Laboratories, Inc.
- Relies on global supply chains for diagnostic kits; disruptions could impact production and delivery.
Waters Corporation
- Complex manufacturing of high-tech instruments exposes it to component shortages and operational risks.
6. ESG & Climate Transition
IDEXX Laboratories, Inc.
- Increasing pressure to improve sustainability in animal health and water testing products.
Waters Corporation
- Faces demands for greener manufacturing and lifecycle management of chemical analysis instruments.
7. Geopolitical Exposure
IDEXX Laboratories, Inc.
- Global footprint with exposure to trade tensions affecting veterinary and water testing markets.
Waters Corporation
- International sales in sensitive pharma and environmental sectors subject to geopolitical risks.
Which company shows a better risk-adjusted profile?
IDEXX’s key risk is its relatively high stock volatility amid strong capital structure and operational resilience. Waters struggles with liquidity concerns and weaker financial ratios, despite more stable stock behavior. IDEXX’s Altman Z-Score of 20.3 and Piotroski score of 8 signal robust financial health. Waters’ scores, though safe, show more vulnerability. This data justifies caution about Waters’ operational leverage and cash flow stability. Overall, IDEXX exhibits a better risk-adjusted profile given its stronger metrics and manageable volatility.
Final Verdict: Which stock to choose?
IDEXX Laboratories stands out with its superpower: a commanding ability to generate exceptional returns on invested capital, signaling efficient capital allocation and strong value creation. Its slight decline in profitability and stretched valuation remain points of vigilance. It suits portfolios targeting aggressive growth fueled by innovation and operational excellence.
Waters Corporation’s strategic moat lies in its stable recurring revenue streams and solid gross margins, offering a safety cushion amidst volatility. However, its deteriorating profitability trends and weaker financial ratios suggest a more cautious profile. It better fits investors seeking Growth at a Reasonable Price (GARP) with a focus on income stability.
If you prioritize high-return growth backed by a proven economic moat, IDEXX outshines due to superior capital efficiency and consistent income growth. However, if you seek steadier cash flow and a less aggressive risk profile, Waters offers better stability despite its challenges. Both present distinct analytical scenarios, depending on your risk tolerance and growth expectations.
Disclaimer: Investment carries a risk of loss of initial capital. The past performance is not a reliable indicator of future results. Be sure to understand risks before making an investment decision.
Go Further
I encourage you to read the complete analyses of IDEXX Laboratories, Inc. and Waters Corporation to enhance your investment decisions: