Home > Comparison > Healthcare > TMO vs IDXX
The strategic rivalry between Thermo Fisher Scientific Inc. and IDEXX Laboratories, Inc. shapes the healthcare diagnostics and research landscape. Thermo Fisher operates as a capital-intensive industrial giant with diversified life sciences and biopharma services. In contrast, IDEXX specializes in high-margin veterinary and water testing diagnostics. This analysis will assess which company’s operational model delivers superior risk-adjusted returns for a diversified portfolio amid evolving sector dynamics.
Table of contents
Companies Overview
Thermo Fisher Scientific and IDEXX Laboratories dominate distinct niches within the medical diagnostics and research industry.
Thermo Fisher Scientific Inc.: Life Sciences Solutions Powerhouse
Thermo Fisher Scientific leads in life sciences solutions, generating revenue from reagents, instruments, and biopharma services worldwide. Its diversified portfolio spans biosciences, analytical instruments, specialty diagnostics, and laboratory products. In 2026, the company focuses on expanding integrated solutions for pharmaceutical and clinical markets, leveraging its extensive direct sales and service network.
IDEXX Laboratories, Inc.: Veterinary and Water Diagnostics Specialist
IDEXX Laboratories specializes in veterinary diagnostics and water testing, selling instruments and consumables for companion animals, livestock, and water quality markets. Its core revenue comes from rapid assay kits, reference lab services, and diagnostic imaging systems. The 2026 strategy emphasizes innovation in point-of-care diagnostics and expanding software solutions for veterinary practices.
Strategic Collision: Similarities & Divergences
Both companies compete in medical diagnostics but differ in customer focus—Thermo Fisher targets broad biopharma and clinical sectors, while IDEXX zeroes in on veterinary and environmental niches. Their business philosophies diverge with Thermo Fisher’s broad integrated ecosystem versus IDEXX’s specialized, niche-oriented approach. This contrast defines their unique investment profiles: Thermo Fisher offers scale and diversification; IDEXX delivers focused growth in specialized markets.
Income Statement Comparison
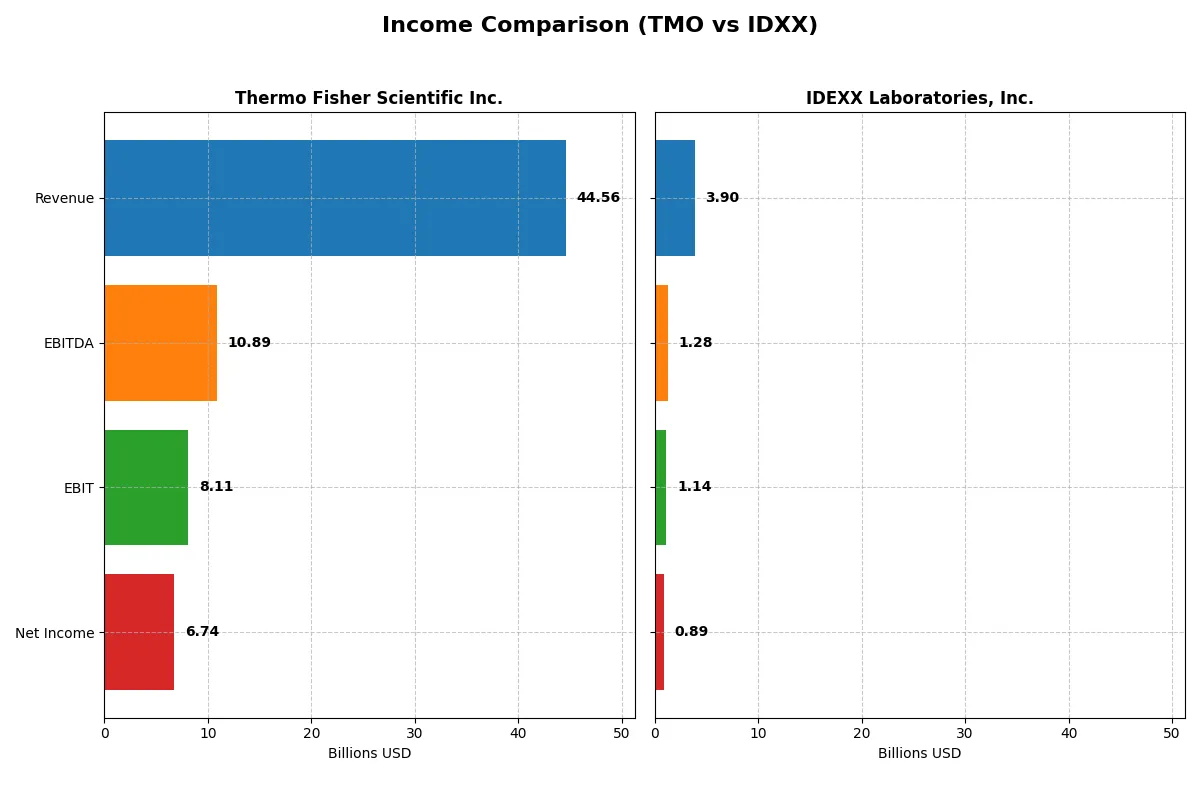
The following data dissects the core profitability and scalability of both corporate engines to reveal who dominates the bottom line:
| Metric | Thermo Fisher Scientific Inc. (TMO) | IDEXX Laboratories, Inc. (IDXX) |
|---|---|---|
| Revenue | 44.6B | 3.9B |
| Cost of Revenue | 27.8B | 1.5B |
| Operating Expenses | 8.7B | 1.3B |
| Gross Profit | 16.8B | 2.4B |
| EBITDA | 10.9B | 1.3B |
| EBIT | 8.1B | 1.1B |
| Interest Expense | 1.4B | 31M |
| Net Income | 6.7B | 888M |
| EPS | 17.77 | 10.77 |
| Fiscal Year | 2025 | 2024 |
Income Statement Analysis: The Bottom-Line Duel
This income statement comparison reveals which company operates as a more efficient and profitable corporate engine.
Thermo Fisher Scientific Inc. Analysis
Thermo Fisher’s revenue grew steadily from 39.2B in 2021 to 44.6B in 2025, but net income declined from 7.7B to 6.7B. Its gross margin contracts slightly to 37.7%, while net margin holds at a solid 15.1%. The 2025 results show cautious efficiency, with stable revenue but margin pressures reducing overall profitability.
IDEXX Laboratories, Inc. Analysis
IDEXX’s revenue increased from 2.7B in 2020 to nearly 3.9B in 2024, with net income surging from 582M to 888M. Gross margin impresses at 61%, and net margin stands at 22.8%. IDEXX shows strong operating momentum, delivering consistent margin expansion and solid bottom-line growth over the period.
Margin Efficiency vs. Growth Momentum
Thermo Fisher offers scale with steady top-line growth but faces margin compression and declining net income. IDEXX delivers superior margin efficiency and robust net income growth, reflecting disciplined capital allocation and operational leverage. For investors, IDEXX’s profile signals a more attractive combination of profitability and growth potential.
Financial Ratios Comparison
These vital ratios act as a diagnostic tool to expose the underlying fiscal health, valuation premiums, and capital efficiency of the companies compared below:
| Ratios | Thermo Fisher Scientific Inc. (TMO) | IDEXX Laboratories, Inc. (IDXX) |
|---|---|---|
| ROE | 12.6% | 55.7% |
| ROIC | 7.6% | 33.9% |
| P/E | 32.3 | 38.4 |
| P/B | 4.08 | 21.37 |
| Current Ratio | 1.89 | 1.31 |
| Quick Ratio | 1.53 | 0.95 |
| D/E | 0.74 | 0.62 |
| Debt-to-Assets | 35.7% | 30.0% |
| Interest Coverage | 5.71 | 36.2 |
| Asset Turnover | 0.40 | 1.18 |
| Fixed Asset Turnover | 4.22 | 4.70 |
| Payout Ratio | 9.4% | 0% |
| Dividend Yield | 0.29% | 0% |
| Fiscal Year | 2025 | 2024 |
Efficiency & Valuation Duel: The Vital Signs
Financial ratios serve as a company’s DNA, exposing hidden risks and operational strengths vital for investment decisions.
Thermo Fisher Scientific Inc.
Thermo Fisher posts a moderate ROE of 12.6% with a net margin of 15.1%, reflecting steady profitability. However, its P/E of 32.3 and P/B of 4.1 suggest the stock is somewhat expensive. The company offers a low dividend yield of 0.29%, signaling a cautious shareholder return approach amid solid reinvestment in R&D.
IDEXX Laboratories, Inc.
IDEXX delivers an exceptional ROE of 55.7% and a strong net margin at 22.8%, indicating operational efficiency. Despite a higher P/E at 38.4 and P/B of 21.4, the valuation appears stretched. It does not pay dividends, focusing instead on aggressive growth and innovation funding. Interest coverage and asset turnover ratios confirm robust financial health.
Premium Valuation vs. Operational Safety
IDEXX commands premium multiples justified by superior profitability and growth, but Thermo Fisher offers a more balanced risk profile with steady returns and solid liquidity. Investors seeking growth may prefer IDEXX’s dynamic profile, while those favoring operational safety might lean toward Thermo Fisher’s stable fundamentals.
Which one offers the Superior Shareholder Reward?
I compare Thermo Fisher Scientific Inc. (TMO) and IDEXX Laboratories, Inc. (IDXX) focusing on their shareholder return strategies. TMO pays a modest 0.29% dividend yield with a low 9.4% payout ratio, ensuring strong free cash flow (16.7/share) covers distributions comfortably. Its buyback program is also significant, enhancing total shareholder returns sustainably. In contrast, IDXX pays no dividends, channeling all cash into aggressive reinvestment and growth, reflected in its higher margins and expanding asset turnover. However, its sky-high valuation multiples (P/E ~38-54) and absence of buybacks increase risk. I find TMO’s balanced dividend plus buybacks offer a more reliable, sustainable total return in 2026.
Comparative Score Analysis: The Strategic Profile
The radar chart reveals the fundamental DNA and trade-offs of Thermo Fisher Scientific and IDEXX Laboratories, highlighting their financial strengths and valuation nuances:
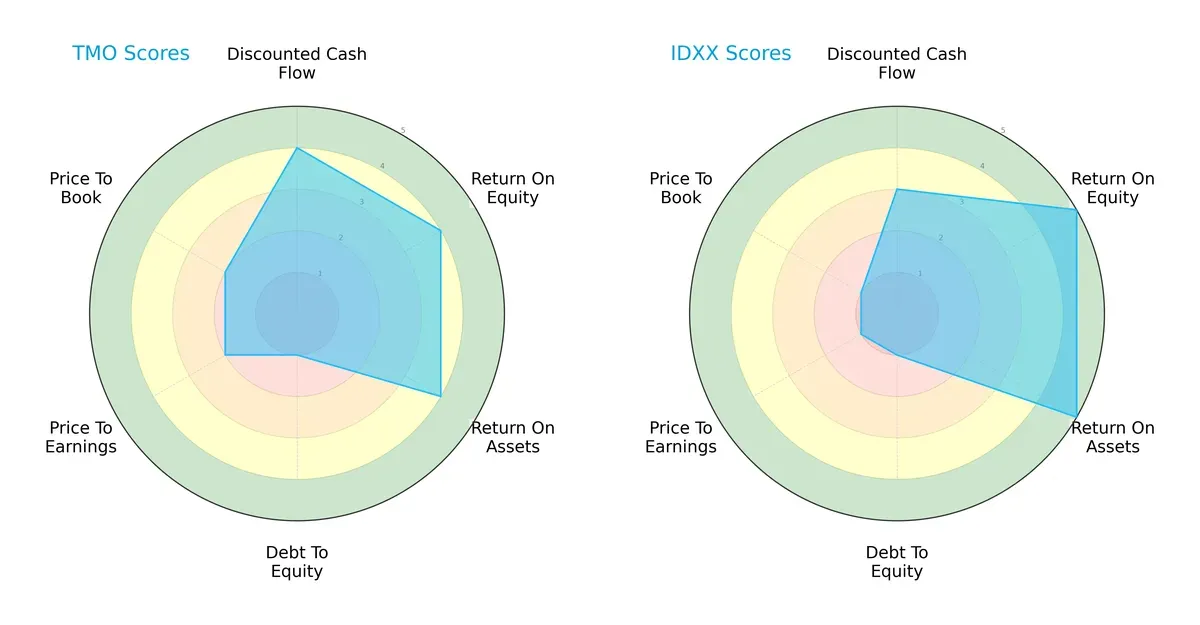
Thermo Fisher shows a balanced profile with favorable DCF, ROE, and ROA scores, but its debt-to-equity score is very unfavorable, signaling higher financial leverage risk. IDEXX excels with top ROE and ROA scores but scores very low on valuation metrics, reflecting premium pricing. Thermo Fisher relies on operational efficiency, while IDEXX leans heavily on profitability at a steep valuation.
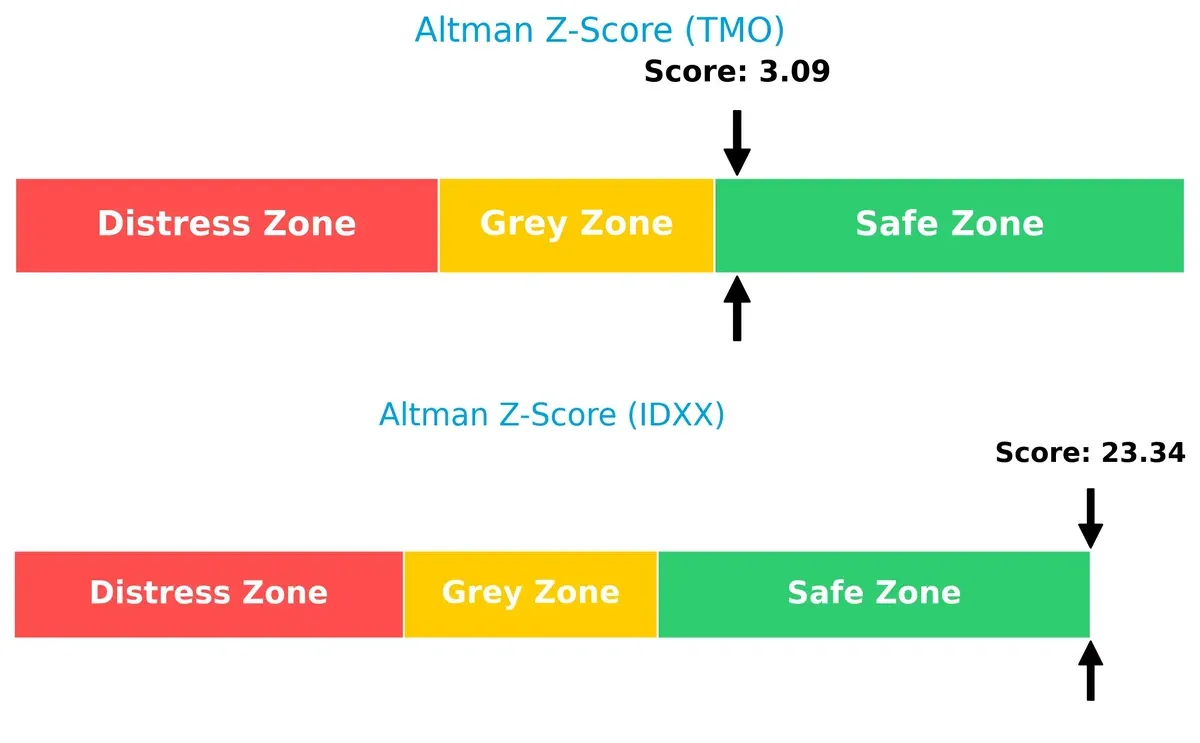
Bankruptcy Risk: Solvency Showdown
IDEXX’s Altman Z-Score far exceeds Thermo Fisher’s, indicating superior solvency and lower bankruptcy risk in the current economic cycle:
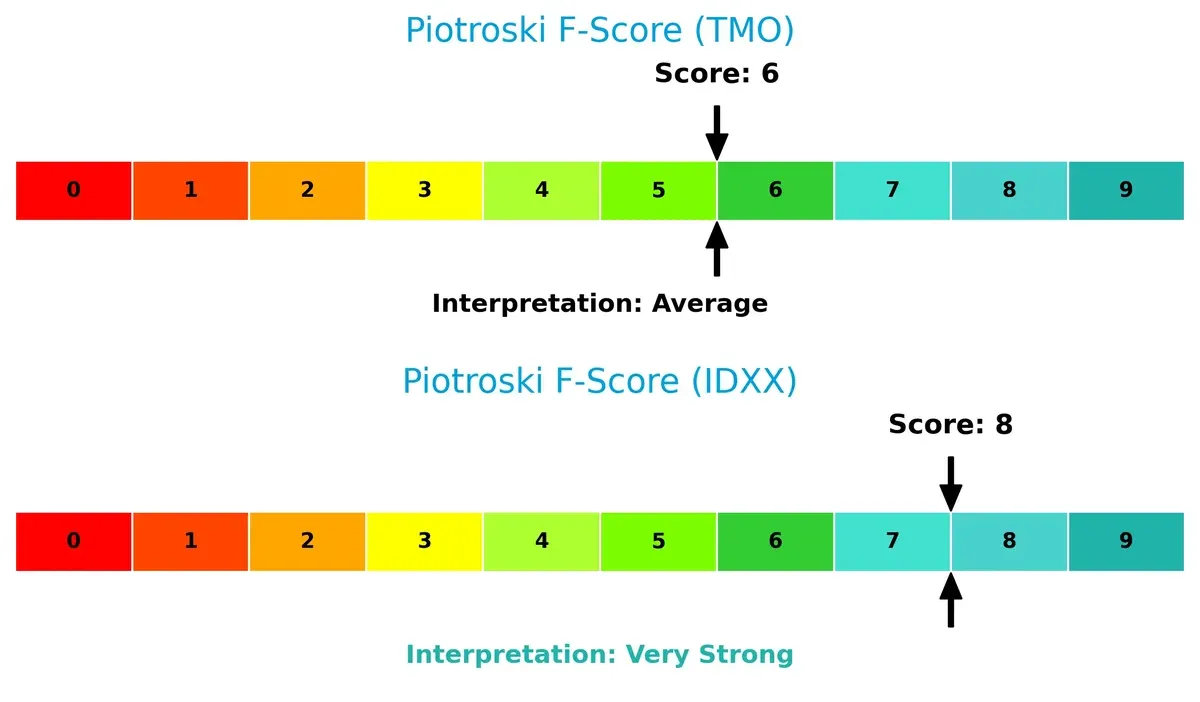
Financial Health: Quality of Operations
IDEXX’s Piotroski F-Score of 8 signals very strong financial health, surpassing Thermo Fisher’s average score of 6, which suggests some internal operational red flags:
How are the two companies positioned?
This section dissects the operational DNA of Thermo Fisher Scientific and IDEXX Laboratories by comparing their revenue distribution and internal dynamics. The goal is to confront their economic moats to reveal which business model offers a more resilient, sustainable competitive advantage today.
Revenue Segmentation: The Strategic Mix
This visual comparison dissects how Thermo Fisher Scientific and IDEXX Laboratories diversify their income streams and where their primary sector bets lie:
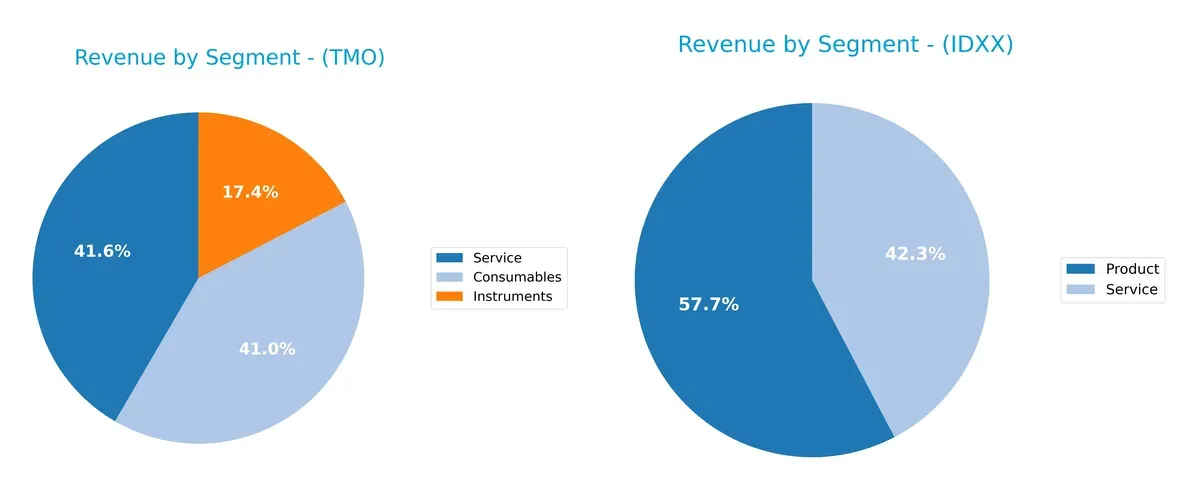
Thermo Fisher dominates with a balanced mix: $17.6B in Consumables, $17.8B in Service, and $7.4B in Instruments. IDEXX leans heavily on Product revenue at $2.25B, with $1.65B from Service. Thermo’s diversified portfolio reduces concentration risk and anchors its ecosystem lock-in. IDEXX’s reliance on product-driven growth suggests a narrower focus, exposing it to greater single-segment volatility despite strong loyalty programs.
Strengths and Weaknesses Comparison
This table compares the Strengths and Weaknesses of Thermo Fisher Scientific Inc. (TMO) and IDEXX Laboratories, Inc. (IDXX):
TMO Strengths
- Diverse revenue streams across consumables, instruments, and services
- Strong global presence with significant US, Europe, and Asia Pacific sales
- Favorable net margin and current/quick ratios indicate solid profitability and liquidity
- Good interest coverage and fixed asset turnover support operational efficiency
IDXX Strengths
- High profitability with excellent net margin, ROE, and ROIC well above WACC
- Favorable debt-to-assets and interest coverage ratios reflect strong financial health
- Asset turnover and fixed asset turnover ratios suggest efficient asset use
- Focused product and service revenue with growing US and international markets
TMO Weaknesses
- Unfavorable PE and PB ratios may indicate overvaluation risk
- Asset turnover is low, suggesting less efficient use of assets
- Dividend yield is minimal, limiting income appeal
- Neutral ROE and ROIC suggest average capital efficiency
IDXX Weaknesses
- Unfavorable high PE and PB ratios point to valuation concerns
- WACC exceeds ROIC, indicating potential capital allocation inefficiency
- Neutral liquidity ratios could signal tighter short-term financial flexibility
- Zero dividend yield limits income potential for investors
Overall, TMO demonstrates a diversified global footprint with steady profitability but faces some valuation and asset efficiency challenges. IDXX excels in profitability and capital efficiency but contends with high valuation and liquidity neutrality. These contrasting profiles imply differing strategic focuses on growth, capital allocation, and market positioning.
The Moat Duel: Analyzing Competitive Defensibility
A structural moat alone shields long-term profits from relentless competitive erosion. Let’s dissect the moats of two healthcare giants:
Thermo Fisher Scientific Inc.: Diversified Innovation Moat
Thermo Fisher’s moat stems from its broad product portfolio and integrated life sciences solutions. Its financials show stable margins but declining ROIC signals emerging pressure. New biopharma services could deepen the moat if execution improves in 2026.
IDEXX Laboratories, Inc.: Niche Diagnostic Dominance
IDEXX’s moat relies on specialized veterinary diagnostics and high-margin proprietary tests, contrasting Thermo Fisher’s scale. It commands superior ROIC and margin expansion, although a slight ROIC decline hints at competitive challenges. Expansion into human diagnostics offers growth potential.
Verdict: Broad Integration vs. Specialized Precision
IDEXX holds a deeper moat, demonstrated by a ROIC far exceeding WACC and superior margin profiles. Thermo Fisher’s diversified moat is wider but less profitable. I see IDEXX as better equipped to defend market share amid evolving diagnostics demand.
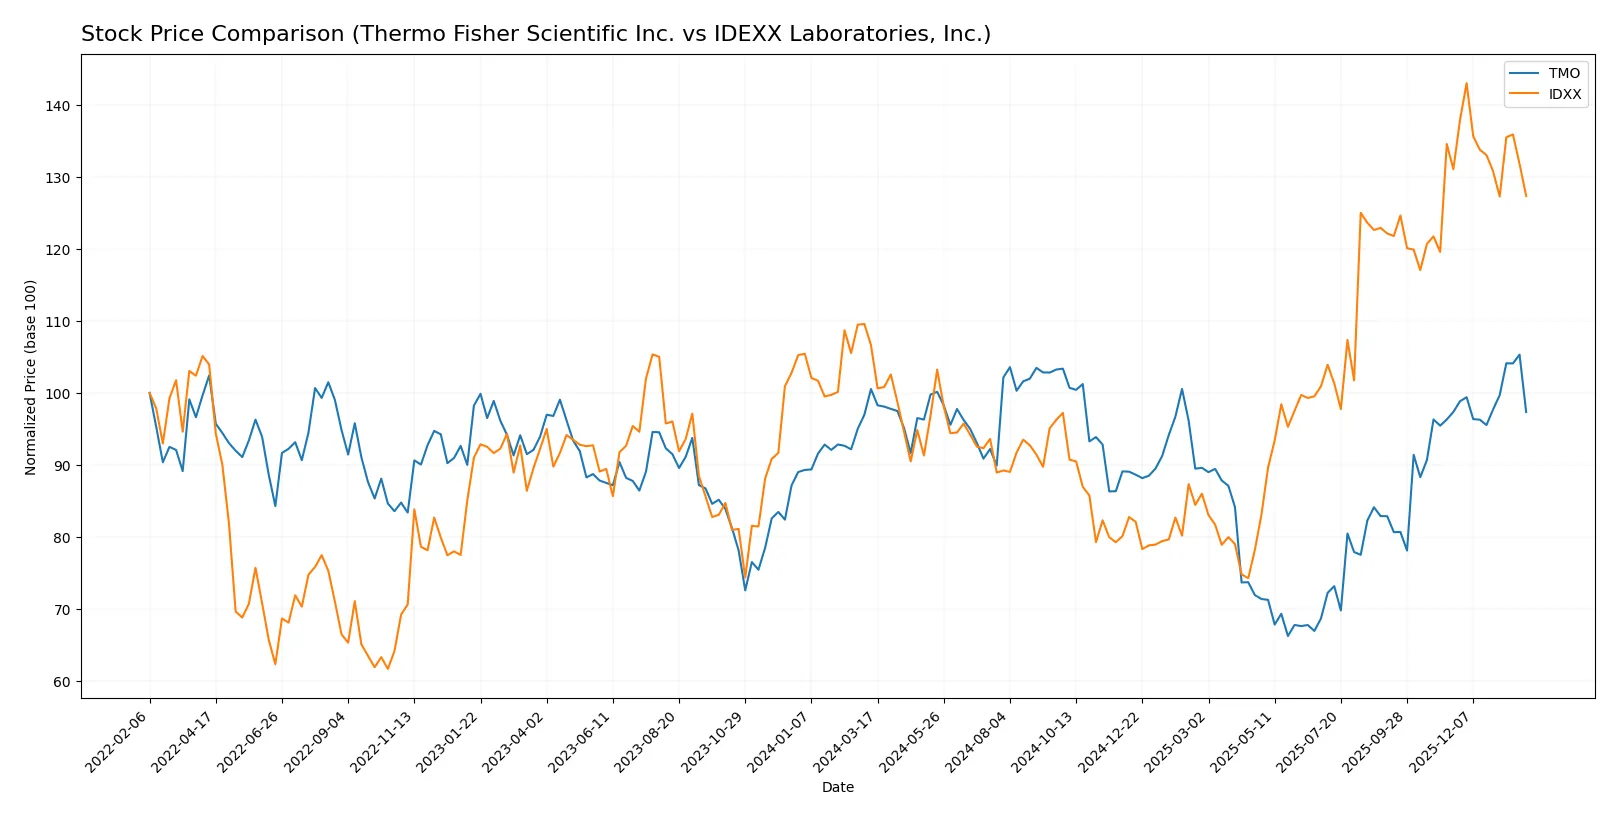
Which stock offers better returns?
Over the past 12 months, Thermo Fisher Scientific and IDEXX Laboratories exhibited contrasting price trajectories with varied acceleration and volume trends shaping their trading dynamics.
Trend Comparison
Thermo Fisher Scientific’s stock declined 3.18% over the past year, marking a bearish trend with accelerating downward momentum and a high price volatility of 64.8.
IDEXX Laboratories gained 19.42% in the same period, showing a bullish trend but with decelerating growth and elevated volatility at 96.06.
IDEXX clearly outperformed Thermo Fisher Scientific, delivering the highest market return despite recent short-term weakness.
Target Prices
Analysts maintain bullish target price consensus for Thermo Fisher Scientific Inc. and IDEXX Laboratories, Inc.
| Company | Target Low | Target High | Consensus |
|---|---|---|---|
| Thermo Fisher Scientific Inc. | 561 | 750 | 644 |
| IDEXX Laboratories, Inc. | 750 | 850 | 804 |
The target consensus for Thermo Fisher at 644 suggests upside versus the current 579 price. IDEXX’s consensus of 804 indicates significant appreciation from its 670 trading level.

Don’t Let Luck Decide Your Entry Point
Optimize your entry points with our advanced ProRealTime indicators. You’ll get efficient buy signals with precise price targets for maximum performance. Start outperforming now!
How do institutions grade them?
The following tables summarize recent institutional grades for Thermo Fisher Scientific Inc. and IDEXX Laboratories, Inc.:
Thermo Fisher Scientific Inc. Grades
This table shows the latest grades from reputable financial institutions for Thermo Fisher Scientific Inc.
| Grading Company | Action | New Grade | Date |
|---|---|---|---|
| TD Cowen | Maintain | Buy | 2026-01-30 |
| Barclays | Maintain | Overweight | 2026-01-30 |
| Citigroup | Maintain | Buy | 2026-01-30 |
| Stifel | Maintain | Buy | 2026-01-09 |
| TD Cowen | Maintain | Buy | 2026-01-07 |
| Wells Fargo | Maintain | Overweight | 2025-12-15 |
| Citigroup | Upgrade | Buy | 2025-12-11 |
| Keybanc | Upgrade | Overweight | 2025-12-08 |
| Morgan Stanley | Maintain | Overweight | 2025-12-02 |
| HSBC | Upgrade | Buy | 2025-12-01 |
IDEXX Laboratories, Inc. Grades
This table presents the recent grades issued by established financial institutions for IDEXX Laboratories, Inc.
| Grading Company | Action | New Grade | Date |
|---|---|---|---|
| UBS | Maintain | Neutral | 2025-11-04 |
| Morgan Stanley | Maintain | Overweight | 2025-11-04 |
| BTIG | Maintain | Buy | 2025-11-04 |
| JP Morgan | Maintain | Overweight | 2025-11-04 |
| Stifel | Upgrade | Buy | 2025-10-31 |
| Morgan Stanley | Maintain | Overweight | 2025-08-15 |
| Piper Sandler | Maintain | Neutral | 2025-08-11 |
| Morgan Stanley | Maintain | Overweight | 2025-08-04 |
| JP Morgan | Maintain | Overweight | 2025-08-04 |
| Morgan Stanley | Maintain | Overweight | 2025-07-29 |
Which company has the best grades?
Thermo Fisher Scientific shows a stronger consensus with multiple “Buy” and “Overweight” ratings, including recent upgrades. IDEXX Laboratories also receives positive grades but features more “Neutral” assessments. This difference suggests Thermo Fisher may attract more investor confidence.
Risks specific to each company
The following categories identify the critical pressure points and systemic threats facing both firms in the 2026 market environment:
1. Market & Competition
Thermo Fisher Scientific Inc.
- Operates in a highly competitive global diagnostics market with diversified product lines, facing pressure from innovation cycles.
IDEXX Laboratories, Inc.
- Faces intense competition in veterinary diagnostics with niche focus but higher beta reflecting sensitivity to market swings.
2. Capital Structure & Debt
Thermo Fisher Scientific Inc.
- Debt-to-equity ratio at 0.74 signals moderate leverage; interest coverage of 5.71 indicates manageable debt service.
IDEXX Laboratories, Inc.
- Lower debt-to-equity at 0.62 and very high interest coverage of 36.57 reflect a stronger balance sheet with less financial risk.
3. Stock Volatility
Thermo Fisher Scientific Inc.
- Beta of 0.91 suggests below-market volatility, offering relative stability in turbulent markets.
IDEXX Laboratories, Inc.
- Beta of 1.67 reveals higher stock price swings, increasing risk for investors sensitive to volatility.
4. Regulatory & Legal
Thermo Fisher Scientific Inc.
- Global footprint exposes it to diverse regulatory regimes, increasing compliance complexity and legal risks.
IDEXX Laboratories, Inc.
- Regulatory risks are more concentrated in veterinary and water testing sectors, with potential for tightening standards.
5. Supply Chain & Operations
Thermo Fisher Scientific Inc.
- Large scale operations and complex supply chain offer resilience but increase exposure to disruption risks globally.
IDEXX Laboratories, Inc.
- Smaller scale and specialized supply chains reduce complexity but may lack flexibility during disruptions.
6. ESG & Climate Transition
Thermo Fisher Scientific Inc.
- Faces pressure to reduce carbon footprint across global operations; ESG initiatives likely impact costs and capital allocation.
IDEXX Laboratories, Inc.
- ESG impact more focused on product sustainability and animal welfare; less exposed to heavy industrial transition risks.
7. Geopolitical Exposure
Thermo Fisher Scientific Inc.
- Extensive international presence subjects it to geopolitical tensions, tariffs, and trade restrictions.
IDEXX Laboratories, Inc.
- Primarily North American exposure limits geopolitical risks but reduces growth opportunities abroad.
Which company shows a better risk-adjusted profile?
Thermo Fisher’s largest risk stems from geopolitical exposure and supply chain complexity, while IDEXX faces significant stock volatility and valuation risks. Despite higher leverage risks for Thermo Fisher, its lower beta and diversified operations suggest more stable earnings. IDEXX’s exceptional profitability and financial strength are offset by its very high valuation multiples and volatility. I see Thermo Fisher showing a better risk-adjusted profile due to its balanced leverage and market stability, despite geopolitical headwinds.
Final Verdict: Which stock to choose?
Thermo Fisher Scientific’s superpower lies in its robust operational scale and efficiency, maintaining a solid cash conversion cycle and strong liquidity. Its point of vigilance is the declining return on invested capital, hinting at pressure on value creation. It suits portfolios aiming for steady, industrial healthcare exposure with moderate growth ambitions.
IDEXX Laboratories commands a strategic moat through its high-margin, recurring revenue model and superior capital returns. It offers stronger profitability and a safer balance sheet compared to Thermo Fisher but trades at a premium that reflects growth expectations. It fits well with GARP investors seeking high-quality growth with defensible pricing power.
If you prioritize consistent value creation and operational resilience, Thermo Fisher appears compelling for moderate-growth portfolios. However, if you seek superior profitability and a fortress-like moat with higher growth potential, IDEXX outshines with better stability despite its premium valuation. Both present analytical scenarios for different risk-return appetites in healthcare investing.
Disclaimer: Investment carries a risk of loss of initial capital. The past performance is not a reliable indicator of future results. Be sure to understand risks before making an investment decision.
Go Further
I encourage you to read the complete analyses of Thermo Fisher Scientific Inc. and IDEXX Laboratories, Inc. to enhance your investment decisions: