Home > Comparison > Healthcare > IDXX vs RVTY
The strategic rivalry between IDEXX Laboratories, Inc. and Revvity, Inc. shapes the Healthcare diagnostics and research sector’s evolution. IDEXX operates as a market leader in companion animal and water testing diagnostics, focusing on point-of-care solutions. Revvity delivers diversified life sciences and applied analytical instruments, blending discovery with diagnostics. This head-to-head contrasts specialization against integrated service breadth. I will evaluate which trajectory offers superior risk-adjusted returns for a diversified portfolio in this dynamic industry.
Table of contents
Companies Overview
IDEXX Laboratories and Revvity stand as influential players in the medical diagnostics and research sector.
IDEXX Laboratories, Inc.: Leader in Veterinary Diagnostics
IDEXX dominates the companion animal veterinary market with point-of-care diagnostic products. Its core revenue stems from instruments, consumables, and rapid assay test kits supporting veterinarians worldwide. In 2026, IDEXX focuses strategically on expanding its veterinary software and diagnostic imaging services to enhance customer integration and clinical outcomes.
Revvity, Inc.: Innovator in Life Sciences and Diagnostics
Revvity operates at the intersection of diagnostics and life sciences with a diversified portfolio spanning instruments, reagents, and informatics. Its revenue engines include genomic and infectious disease testing platforms, alongside analytical solutions for research and industrial markets. The company’s 2026 strategy prioritizes advancing genomic workflows and expanding applications in oncology and drug discovery.
Strategic Collision: Similarities & Divergences
Both companies excel in diagnostic innovation but diverge in market focus—IDEXX emphasizes a closed ecosystem for veterinary care, while Revvity pursues an open infrastructure supporting diverse research and diagnostics. Their primary battleground lies in diagnostic technology adoption and customer service excellence. This contrast shapes distinct investment profiles: IDEXX offers niche specialization with steady growth; Revvity targets broad innovation with exposure to multiple industries.
Income Statement Comparison
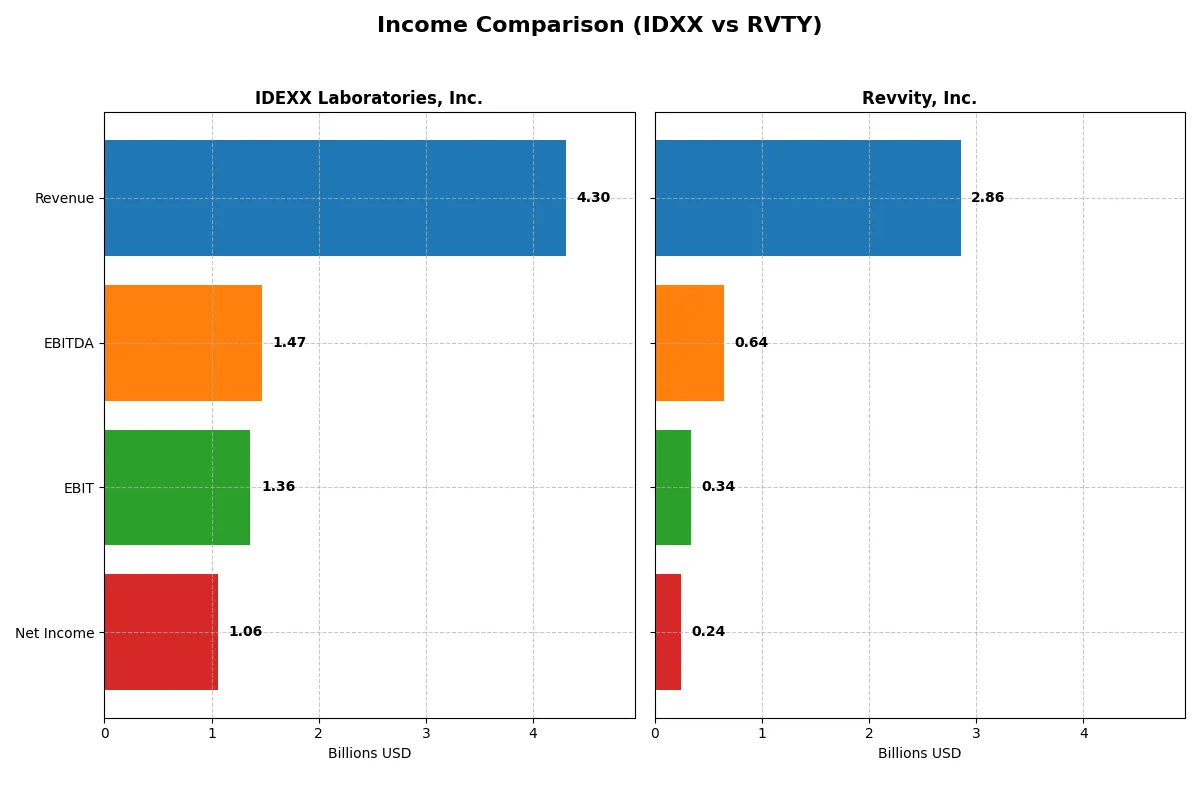
This data dissects the core profitability and scalability of both corporate engines to reveal who dominates the bottom line:
| Metric | IDEXX Laboratories, Inc. (IDXX) | Revvity, Inc. (RVTY) |
|---|---|---|
| Revenue | 4.3B | 2.9B |
| Cost of Revenue | 1.6B | 1.3B |
| Operating Expenses | 1.3B | 1.2B |
| Gross Profit | 2.7B | 1.5B |
| EBITDA | 1.5B | 644M |
| EBIT | 1.4B | 341M |
| Interest Expense | 38M | 92M |
| Net Income | 1.1B | 242M |
| EPS | 13.17 | 2.08 |
| Fiscal Year | 2025 | 2025 |
Income Statement Analysis: The Bottom-Line Duel
This income statement comparison reveals which company runs a more efficient and profitable corporate engine through recent financial cycles.
IDEXX Laboratories, Inc. Analysis
IDEXX Laboratories grows revenue steadily, reaching 4.3B in 2025 with net income up 20% year-over-year to 1.06B. Its gross margin holds a robust 61.8%, and net margin expands to 24.6%, reflecting strong cost control. The company’s EBIT margin surges to 31.7%, showcasing impressive operational leverage and momentum.
Revvity, Inc. Analysis
Revvity posts 2.86B revenue in 2025, a modest 3.7% rise from 2024, but net income declines sharply to 242M. Gross margin at 53.1% and net margin at 8.5% lag industry leaders. EBIT margin contracts to 12%, signaling pressure on operational efficiency. The overall trajectory shows weakening profitability despite stable top-line growth.
Margin Strength vs. Profitability Decline
IDEXX outperforms Revvity across all key profitability metrics, with superior margins and consistent earnings growth. Revvity’s declining net income and compressed margins highlight operational challenges. For investors, IDEXX’s profile offers a more resilient, high-margin business model, while Revvity’s results warrant caution given its deteriorating profitability.
Financial Ratios Comparison
These vital ratios act as a diagnostic tool to expose the underlying fiscal health, valuation premiums, and capital efficiency of the companies analyzed:
| Ratios | IDEXX Laboratories, Inc. (IDXX) | Revvity, Inc. (RVTY) |
|---|---|---|
| ROE | 66.0% | 3.3% |
| ROIC | 40.7% | 2.8% |
| P/E | 51.1 | 45.3 |
| P/B | 33.8 | 1.51 |
| Current Ratio | 1.23 | 1.68 |
| Quick Ratio | 0.90 | 1.40 |
| D/E | 0.05 | 0.46 |
| Debt-to-Assets | 2.2% | 27.7% |
| Interest Coverage | 35.5 | 3.87 |
| Asset Turnover | 1.28 | 0.23 |
| Fixed Asset Turnover | 5.76 | 4.43 |
| Payout ratio | 0% | 13.6% |
| Dividend yield | 0% | 0.30% |
| Fiscal Year | 2025 | 2025 |
Efficiency & Valuation Duel: The Vital Signs
Financial ratios serve as a company’s DNA, uncovering hidden risks and operational strengths that shape investor outcomes.
IDEXX Laboratories, Inc.
IDEXX exhibits commanding profitability with a 66% ROE and 25% net margin, signaling exceptional operational efficiency. Its valuation multiples stretch high, with a P/E of 51.15 and P/B at 33.75, reflecting premium pricing. The company returns value through reinvestment in R&D over dividends, fueling sustainable growth.
Revvity, Inc.
Revvity posts a modest 3.33% ROE and 8.46% net margin, indicating limited profitability compared to IDEXX. Its P/E of 45.32 suggests valuation pressure despite weaker returns. The firm supports shareholders with a small dividend yield but primarily focuses on growth investments, balancing risk amid operational challenges.
Premium Valuation vs. Operational Safety
IDEXX commands a premium valuation justified by robust profitability and disciplined capital allocation. Revvity offers a more conservative valuation but struggles with efficiency and returns. IDEXX suits investors prioritizing strong operational performance; Revvity fits those willing to accept higher risk for growth potential.
Which one offers the Superior Shareholder Reward?
I compare IDEXX Laboratories, Inc. (IDXX) and Revvity, Inc. (RVTY) in their shareholder return strategies. IDXX pays no dividends, reinvesting heavily in growth, with a 0% payout and strong free cash flow (13.2/share in 2025). It also executes modest buybacks, supporting valuation at high P/E (51x). RVTY offers a small dividend yield (~0.3%), with a payout ratio near 13.6%, but its net margin and free cash flow per share (4.55/share) lag IDXX. RVTY’s buyback intensity is lower, reflecting more conservative capital allocation amid weaker profitability. IDXX’s reinvestment and buyback balance signals a more sustainable, superior total return in 2026.
Comparative Score Analysis: The Strategic Profile
The radar chart reveals the fundamental DNA and trade-offs of both firms, illustrating their financial strengths and valuation challenges side by side:
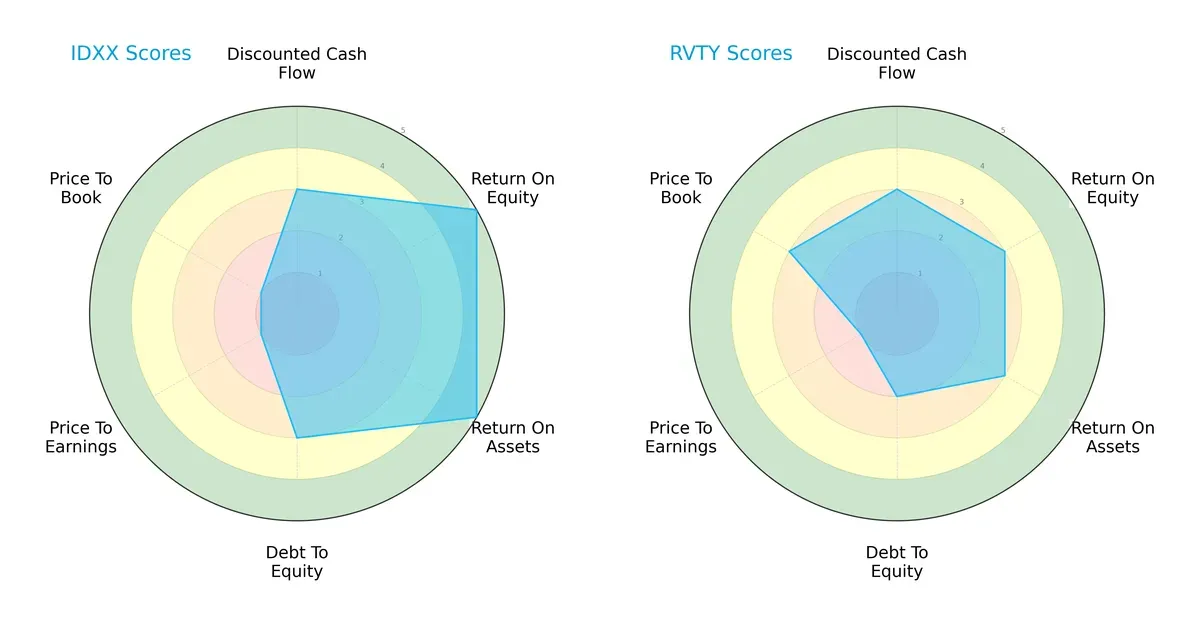
IDEXX Laboratories dominates in profitability metrics, scoring very favorable 5s in ROE and ROA, signaling superior asset and equity efficiency. Revvity shows moderate returns but a weaker debt profile with an unfavorable debt-to-equity score of 2. Both firms suffer from very unfavorable valuation scores, but Revvity holds a slightly better price-to-book score, suggesting less market undervaluation than IDEXX. IDEXX offers a more balanced profile driven by operational excellence, while Revvity leans on valuation bargains and moderate leverage risk.
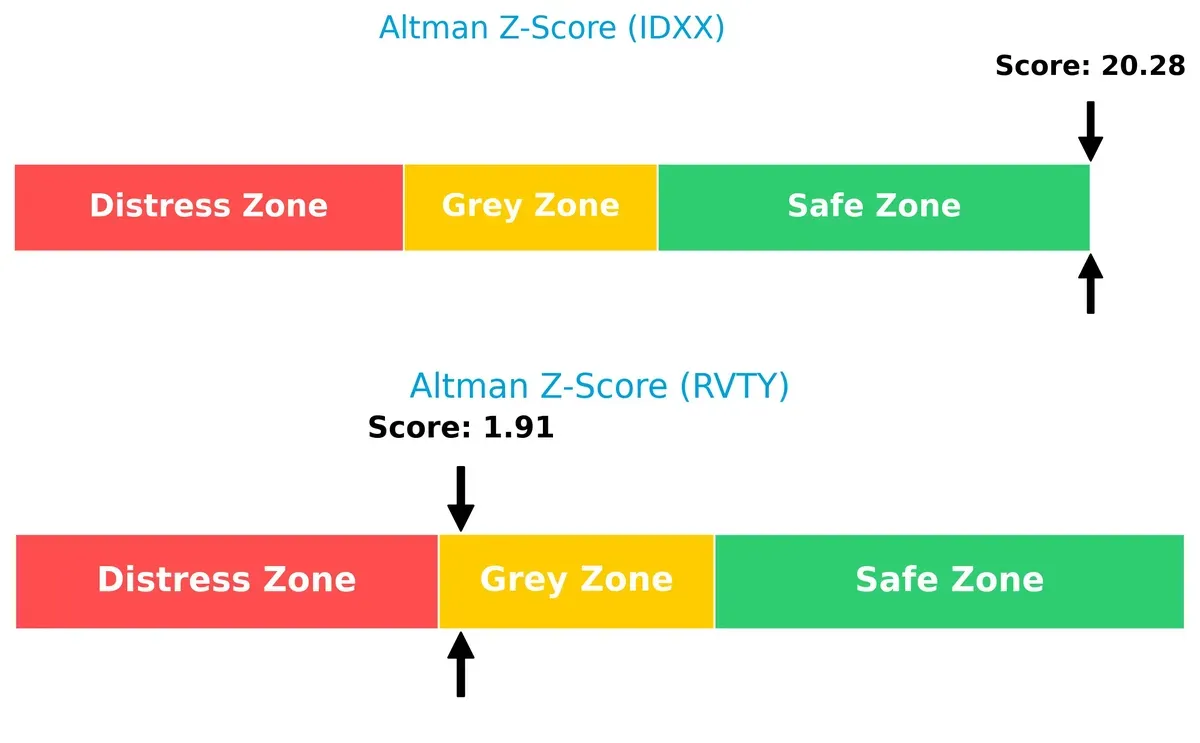
Bankruptcy Risk: Solvency Showdown
IDEXX’s Altman Z-Score of 20.3 places it comfortably in the safe zone, signaling robust long-term solvency. Revvity’s 1.9 score situates it in the grey zone, implying elevated bankruptcy risk under market stress:
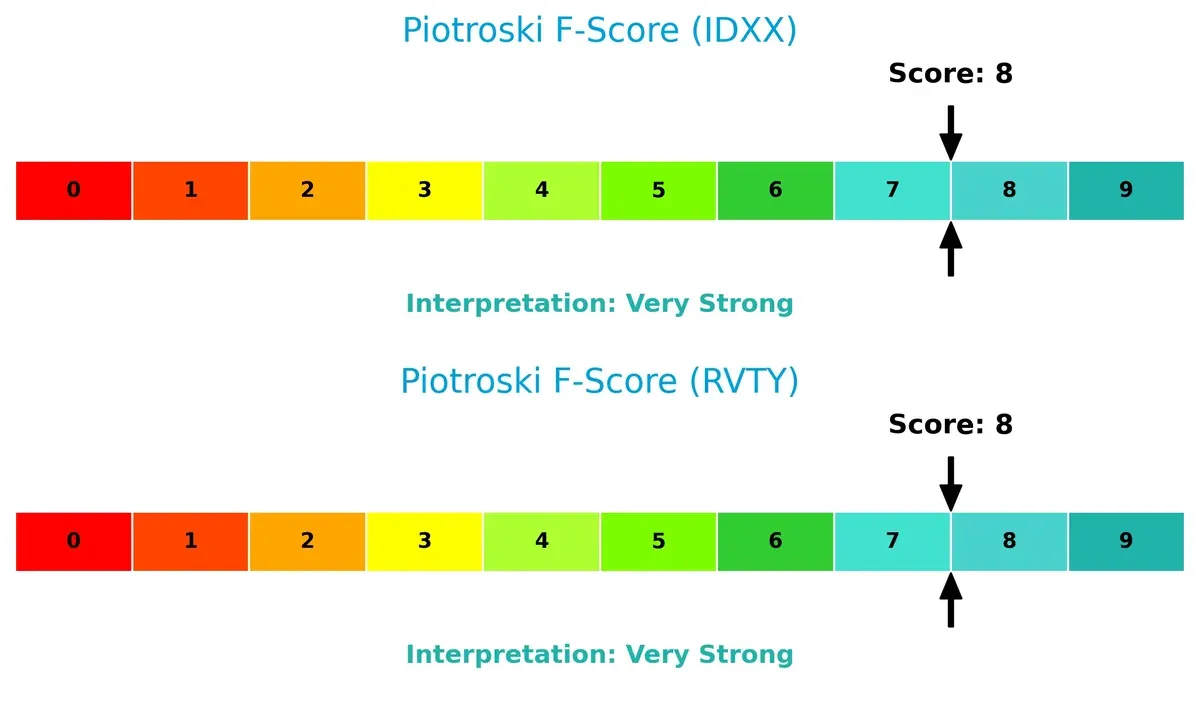
Financial Health: Quality of Operations
Both companies score an 8 on the Piotroski F-Score, indicating very strong financial health. This suggests solid profitability, liquidity, and operational efficiency without red flags for either firm:
How are the two companies positioned?
This section dissects the operational DNA of IDEXX and Revvity by comparing their revenue distribution and internal dynamics. The goal is to confront their economic moats to reveal which business model offers the most resilient, sustainable competitive advantage today.
Revenue Segmentation: The Strategic Mix
This visual comparison dissects how IDEXX Laboratories and Revvity diversify their income streams and where their primary sector bets lie:
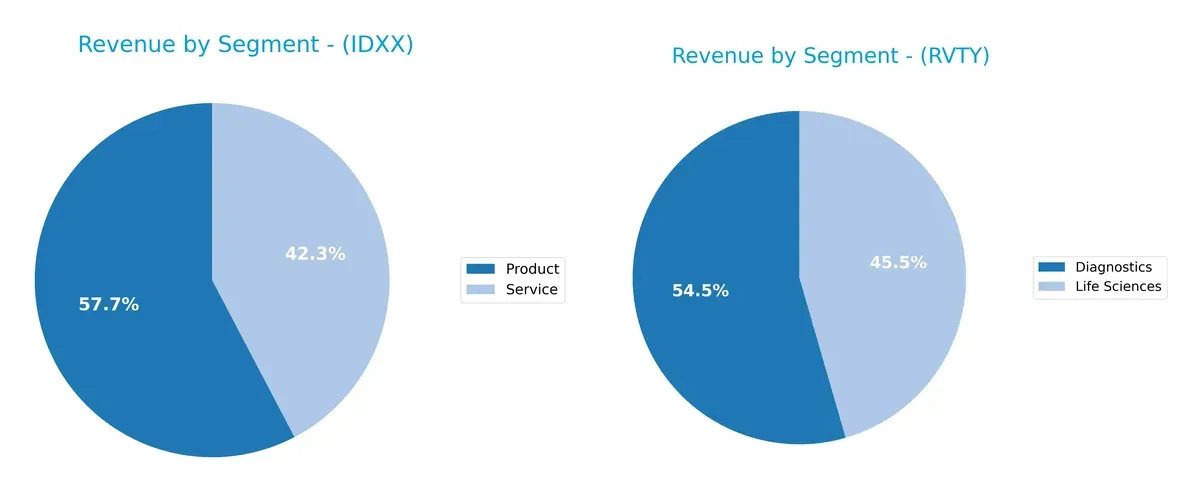
IDEXX anchors its revenue in two main segments: Products at $2.25B and Services at $1.65B, showing a moderately diversified portfolio. Revvity splits its revenue more evenly between Diagnostics at $1.5B and Life Sciences at $1.25B, reflecting a balanced strategic mix. IDEXX’s reliance on product dominance suggests strong ecosystem lock-in, while Revvity’s dual focus mitigates concentration risk and leverages cross-sector innovation.
Strengths and Weaknesses Comparison
This table compares the Strengths and Weaknesses of IDEXX Laboratories, Inc. and Revvity, Inc.:
IDXX Strengths
- High net margin at 24.62%
- Strong ROE at 65.99% and ROIC at 40.68%
- Low debt-to-assets at 2.24%
- Favorable interest coverage at 35.61
- Broad U.S. and EMEA presence
- Robust product and service revenue streams
RVTY Strengths
- Favorable WACC at 7.43% supports lower capital costs
- Strong liquidity ratios (current 1.68, quick 1.4)
- Moderate debt levels with 27.68% debt-to-assets
- Diverse revenue from Diagnostics and Life Sciences
- Significant international exposure, especially in China and Other International markets
IDXX Weaknesses
- High valuation multiples (PE 51.15, PB 33.75) signal expensive stock
- WACC at 11.46% above ROIC may imply inefficient capital use
- Neutral liquidity ratios (current 1.23, quick 0.9) could limit flexibility
- No dividend yield
- Reliance on U.S. market with 2.5B revenue
RVTY Weaknesses
- Low profitability with net margin 8.46%, ROE 3.33%, ROIC 2.82%
- Asset turnover weak at 0.23 indicating low operational efficiency
- PE ratio at 45.32 still high relative to returns
- Slight dividend yield of 0.3% may not attract income investors
- Lower interest coverage at 3.7 raises risk under stress
IDXX shows strong profitability and conservative leverage but faces valuation and capital efficiency challenges. Revvity has solid liquidity and geographic diversification but struggles with profitability and asset utilization. Both companies exhibit distinct strategic strengths and areas requiring attention for future growth.
The Moat Duel: Analyzing Competitive Defensibility
A structural moat is the only shield protecting long-term profits from competitive erosion. Let’s dissect how IDEXX and Revvity defend their turf:
IDEXX Laboratories, Inc.: Intangible Asset Fortress
IDEXX leverages proprietary diagnostic technology and strong brand loyalty. Its high ROIC above WACC at 29% confirms efficient capital use and margin stability. Expansion into human point-of-care diagnostics could deepen this moat in 2026.
Revvity, Inc.: Innovation-Driven but Vulnerable
Revvity’s moat relies on product innovation and diversified life science solutions, unlike IDEXX’s niche focus. However, its negative ROIC spread signals value destruction. New genomic and oncology tools offer growth, but profitability risks persist.
Moat Strength Showdown: Intangible Assets vs. Innovation Execution
IDEXX holds the deeper moat, proven by consistent value creation and stable margins. Revvity’s innovation potential is promising but undermined by declining profitability and negative ROIC. IDEXX stands better poised to defend market share.
Which stock offers better returns?
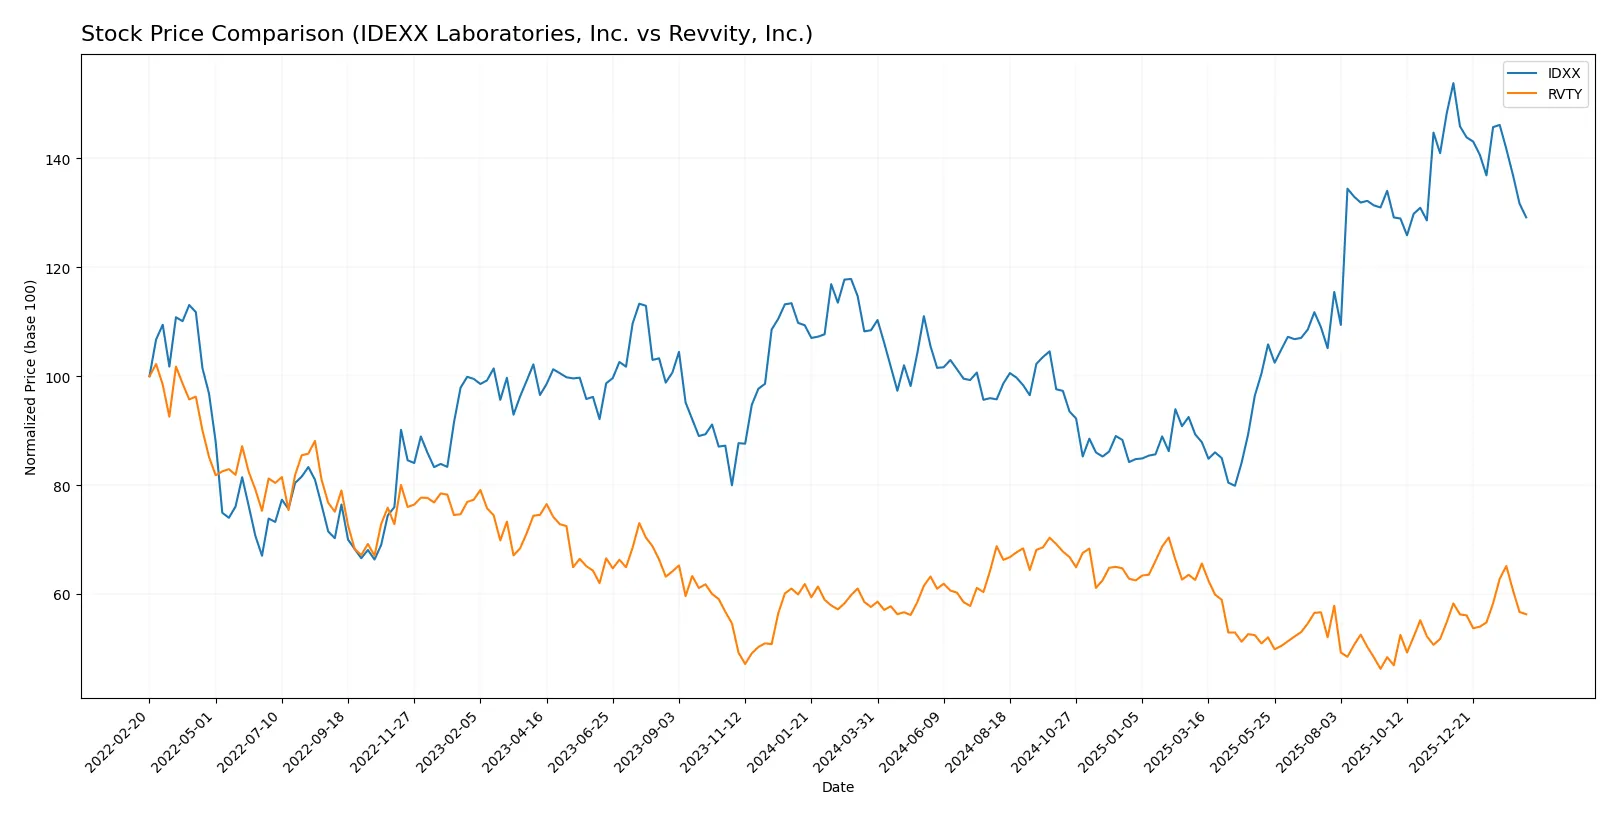
Over the past 12 months, both stocks showed distinct price movements. IDXX gained significant ground but slowed recently, while RVTY faced a steady decline with slight recent stabilization.
Trend Comparison
IDEXX Laboratories, Inc. recorded a bullish 19.13% price increase over the past year, despite recent deceleration and a -16.02% drop since November 2025. Volatility remains high at 97.28.
Revvity, Inc. experienced a bearish 2.32% decline over 12 months, with accelerating downtrend pressure. Recent months show a mild -3.4% decrease but a slight positive slope, indicating tentative support.
IDXX clearly outperformed RVTY over the year, delivering stronger market returns despite recent weakness, while RVTY’s trend remains negative with limited recovery signs.
Target Prices
Analysts present a bullish consensus for both IDEXX Laboratories and Revvity, Inc., reflecting growth optimism.
| Company | Target Low | Target High | Consensus |
|---|---|---|---|
| IDEXX Laboratories, Inc. | 730 | 830 | 784.38 |
| Revvity, Inc. | 105 | 129 | 115.14 |
For IDEXX, the consensus target price at 784.38 suggests a significant 24% upside from the current 633.85 price. Revvity’s target consensus of 115.14 implies roughly 14% growth from the 101.12 stock price.

Don’t Let Luck Decide Your Entry Point
Optimize your entry points with our advanced ProRealTime indicators. You’ll get efficient buy signals with precise price targets for maximum performance. Start outperforming now!
How do institutions grade them?
Here is a summary of recent grade updates from established grading firms for both companies:
IDEXX Laboratories, Inc. Grades
This table shows the latest grades and actions from recognized institutions for IDEXX Laboratories:
| Grading Company | Action | New Grade | Date |
|---|---|---|---|
| Barclays | Maintain | Overweight | 2026-02-05 |
| BTIG | Maintain | Buy | 2026-02-03 |
| UBS | Maintain | Neutral | 2026-02-03 |
| UBS | Maintain | Neutral | 2025-11-04 |
| JP Morgan | Maintain | Overweight | 2025-11-04 |
| BTIG | Maintain | Buy | 2025-11-04 |
| Morgan Stanley | Maintain | Overweight | 2025-11-04 |
| Stifel | Upgrade | Buy | 2025-10-31 |
| Morgan Stanley | Maintain | Overweight | 2025-08-15 |
| Piper Sandler | Maintain | Neutral | 2025-08-11 |
Revvity, Inc. Grades
Below are the recent institutional grades and recommendations for Revvity, Inc.:
| Grading Company | Action | New Grade | Date |
|---|---|---|---|
| Evercore ISI Group | Maintain | Outperform | 2026-02-03 |
| Jefferies | Maintain | Hold | 2026-02-03 |
| Wells Fargo | Maintain | Equal Weight | 2026-02-03 |
| TD Cowen | Maintain | Buy | 2026-02-03 |
| Barclays | Maintain | Overweight | 2026-02-03 |
| JP Morgan | Maintain | Neutral | 2026-02-03 |
| Wells Fargo | Maintain | Equal Weight | 2025-12-15 |
| Barclays | Maintain | Overweight | 2025-12-15 |
| Barclays | Maintain | Overweight | 2025-10-28 |
| Baird | Maintain | Outperform | 2025-10-28 |
Which company has the best grades?
IDEXX Laboratories holds consistently higher grades, including multiple “Buy” and “Overweight” ratings. Revvity shows a mix of “Outperform,” “Buy,” and more neutral “Hold” or “Equal Weight” grades. Investors may see IDEXX as favored by institutions, potentially signaling stronger confidence.
Risks specific to each company
The following categories identify the critical pressure points and systemic threats facing both firms in the 2026 market environment:
1. Market & Competition
IDEXX Laboratories, Inc.
- Dominates companion animal diagnostics but faces high competition in human diagnostics growth areas.
Revvity, Inc.
- Competes broadly in life sciences and diagnostics with diverse product lines but lower market share.
2. Capital Structure & Debt
IDEXX Laboratories, Inc.
- Very low debt ratio (2.24%) and strong interest coverage (35.6x) signals financial stability.
Revvity, Inc.
- Moderate leverage (27.7% debt/assets), interest coverage is weaker (3.7x), increasing financial risk.
3. Stock Volatility
IDEXX Laboratories, Inc.
- High beta of 1.66 indicates elevated stock price volatility relative to the market.
Revvity, Inc.
- Lower beta at 1.09 suggests more stable price movements amid sector volatility.
4. Regulatory & Legal
IDEXX Laboratories, Inc.
- Operates in heavily regulated veterinary and human diagnostics markets, with ongoing compliance costs.
Revvity, Inc.
- Faces complex regulatory scrutiny across diagnostics, genomic workflows, and environmental testing segments.
5. Supply Chain & Operations
IDEXX Laboratories, Inc.
- Relies on specialized consumables; supply disruptions could impact rapid assay test kit availability.
Revvity, Inc.
- Diverse supply chain across instruments, reagents, and software poses operational complexity risks.
6. ESG & Climate Transition
IDEXX Laboratories, Inc.
- Focus on water testing products aligns with environmental sustainability trends but pressures remain.
Revvity, Inc.
- Needs to advance ESG disclosures and climate strategies amid growing investor and regulatory expectations.
7. Geopolitical Exposure
IDEXX Laboratories, Inc.
- Global presence but largely US-based operations limit major geopolitical risk exposure.
Revvity, Inc.
- More international operations increase exposure to global trade tensions and regulatory variance.
Which company shows a better risk-adjusted profile?
IDEXX Laboratories faces its largest risk in market competition and valuation multiples, with a sky-high P/E and P/B reflecting premium pricing. Revvity’s greatest risk lies in its capital structure and weaker profitability metrics, signaling financial vulnerability. Despite IDEXX’s volatility, its strong balance sheet and profitability create a superior risk-adjusted profile. The sharply higher debt-to-assets ratio for Revvity (27.7% vs. 2.2%) justifies concern over its financial leverage amid a cautious 2026 market.
Final Verdict: Which stock to choose?
IDEXX Laboratories excels as a powerhouse of operational efficiency and value creation. Its stellar return on invested capital far outpaces its cost of capital, signaling a durable competitive edge. The point of vigilance lies in its lofty valuation multiples, which could temper near-term upside. This stock suits portfolios seeking aggressive growth with a tolerance for premium pricing.
Revvity stands out for its strategic moat built on recurring revenue streams and a strong balance sheet liquidity profile. Though its profitability metrics lag behind IDEXX, it offers greater financial stability and less aggressive valuation. This makes Revvity a fitting choice for investors favoring Growth at a Reasonable Price (GARP) strategies.
If you prioritize robust value creation and operational excellence, IDEXX outshines due to its superior profitability and moat sustainability. However, if your focus is on enhanced financial safety and more conservative valuation, Revvity offers better stability and a lower risk profile. Both stocks present distinct analytical scenarios aligned with specific investor profiles.
Disclaimer: Investment carries a risk of loss of initial capital. The past performance is not a reliable indicator of future results. Be sure to understand risks before making an investment decision.
Go Further
I encourage you to read the complete analyses of IDEXX Laboratories, Inc. and Revvity, Inc. to enhance your investment decisions: