Home > Comparison > Healthcare > IDXX vs DGX
The strategic rivalry between IDEXX Laboratories, Inc. and Quest Diagnostics Incorporated shapes the future of medical diagnostics and research. IDEXX operates as a specialized, innovation-driven provider focused on veterinary and water testing markets. Quest Diagnostics, by contrast, is a large-scale diagnostic services network emphasizing routine and advanced clinical testing. This analysis will evaluate which company’s business model delivers superior risk-adjusted returns for a diversified healthcare portfolio.
Table of contents
Companies Overview
IDEXX Laboratories and Quest Diagnostics define the competitive landscape of medical diagnostics in the U.S.
IDEXX Laboratories, Inc.: Leader in Veterinary and Water Diagnostics
IDEXX Laboratories dominates the companion animal veterinary diagnostics market with point-of-care diagnostic products and veterinary reference lab services. Its revenue stems mainly from instruments, consumables, and rapid assay kits. In 2026, IDEXX focuses on expanding veterinary software solutions and water quality testing products, reinforcing its integrated ecosystem approach for animal health and environmental diagnostics.
Quest Diagnostics Incorporated: Powerhouse in Human Diagnostic Testing
Quest Diagnostics specializes in human diagnostic information services, leveraging a vast network of labs, patient centers, and mobile professionals. Its core revenue comes from routine, advanced clinical, and anatomic pathology testing. Quest’s 2026 strategy emphasizes enhancing IT solutions and expanding risk assessment services, reinforcing its broad service infrastructure across healthcare providers and insurers.
Strategic Collision: Similarities & Divergences
Both companies excel in diagnostic services but differ in focus: IDEXX pursues a closed ecosystem in veterinary and environmental markets, while Quest operates an open infrastructure targeting diverse healthcare segments. They mainly compete on diagnostic innovation and customer reach. IDEXX’s niche specialization contrasts with Quest’s scale and service breadth, creating distinct investment profiles in diagnostics.
Income Statement Comparison
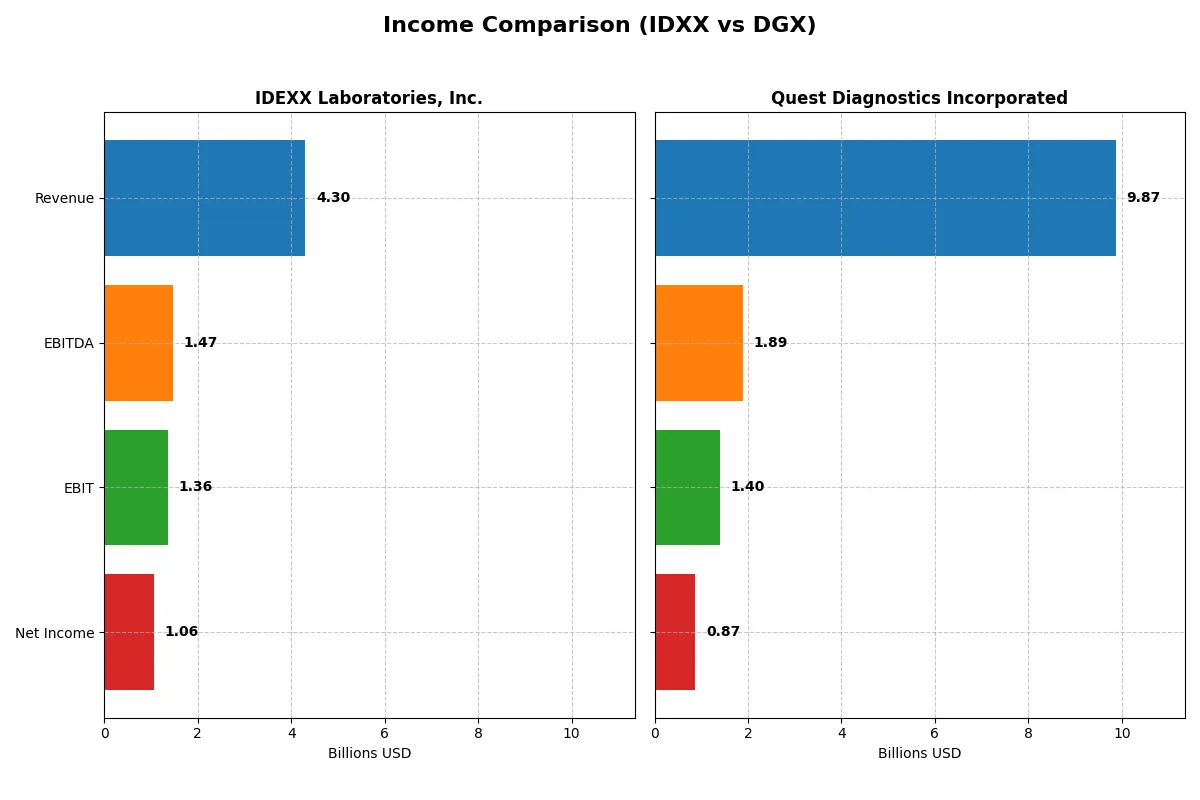
This data dissects the core profitability and scalability of both corporate engines to reveal who dominates the bottom line:
| Metric | IDEXX Laboratories, Inc. (IDXX) | Quest Diagnostics Incorporated (DGX) |
|---|---|---|
| Revenue | 4.30B | 9.87B |
| Cost of Revenue | 1.64B | 6.63B |
| Operating Expenses | 1.30B | 1.90B |
| Gross Profit | 2.66B | 3.24B |
| EBITDA | 1.47B | 1.89B |
| EBIT | 1.36B | 1.40B |
| Interest Expense | 38M | 226M |
| Net Income | 1.06B | 871M |
| EPS | 13.17 | 7.80 |
| Fiscal Year | 2025 | 2024 |
Income Statement Analysis: The Bottom-Line Duel
This income statement comparison exposes which company operates with superior efficiency and sustainable profitability in their respective markets.
IDEX Laboratories, Inc. Analysis
IDEXX Laboratories shows a robust revenue climb from 3.2B in 2021 to 4.3B in 2025, with net income rising 42% over five years to 1.06B. Its gross margin stands at a strong 61.8%, and net margin at 24.6%, indicating exceptional cost control and pricing power. The 2025 results reflect accelerating profit growth, with EBIT up 19.4% year-over-year, signaling sustained operational momentum.
Quest Diagnostics Incorporated Analysis
Quest Diagnostics reports revenues around 9.9B in 2024, relatively flat over recent years, while net income has declined 39% since 2020, reaching 871M in 2024. Its gross margin of 32.9% and net margin of 8.8% are modest by industry standards. Despite modest revenue growth, profitability pressures persist, highlighted by a 4.4% net margin contraction last year, suggesting margin compression challenges.
Margin Strength vs. Revenue Scale
IDEXX clearly outperforms Quest Diagnostics in both margin quality and profit growth. IDEXX’s superior gross and net margins reflect a highly efficient business model with expanding earnings power. Quest’s scale is notable, but its stagnant revenue and declining net income weaken its fundamental profile. For investors prioritizing margin resilience and profit growth, IDEXX presents a more compelling earnings trajectory.
Financial Ratios Comparison
These vital ratios act as a diagnostic tool to expose the underlying fiscal health, valuation premiums, and capital efficiency of the firms compared below:
| Ratios | IDEXX Laboratories, Inc. (IDXX) | Quest Diagnostics Incorporated (DGX) |
|---|---|---|
| ROE | 66.0% | 12.9% |
| ROIC | 40.7% | 7.0% |
| P/E | 51.1 | 19.2 |
| P/B | 33.8 | 2.47 |
| Current Ratio | 1.23 | 1.10 |
| Quick Ratio | 0.90 | 1.02 |
| D/E | 0.05 | 1.05 |
| Debt-to-Assets | 2.2% | 43.9% |
| Interest Coverage | 35.5 | 6.0 |
| Asset Turnover | 1.28 | 0.61 |
| Fixed Asset Turnover | 5.76 | 3.57 |
| Payout ratio | 0 | 38.0% |
| Dividend yield | 0 | 1.98% |
| Fiscal Year | 2025 | 2024 |
Efficiency & Valuation Duel: The Vital Signs
Financial ratios serve as a company’s DNA, exposing hidden risks and operational strength that shape investor confidence and portfolio decisions.
IDEXX Laboratories, Inc.
IDEXX displays exceptional profitability with a 66% ROE and strong 25% net margin, reflecting operational excellence. However, its valuation is stretched, marked by a 51.15 P/E and 33.75 P/B, signaling premium pricing. The company retains earnings to fuel growth, with no dividend payout, prioritizing reinvestment in R&D and innovation.
Quest Diagnostics Incorporated
Quest Diagnostics reports moderate profitability, with a 12.85% ROE and an 8.82% net margin, indicating steady but unspectacular returns. Valuation ratios like a 19.23 P/E and 2.47 P/B remain reasonable, suggesting fair pricing. The company delivers a modest 1.98% dividend yield, balancing shareholder returns with capital allocation discipline.
Premium Valuation vs. Operational Safety
IDEXX commands higher profitability but at a stretched valuation, increasing risk despite growth potential. Quest Diagnostics offers a more conservative profile with stable returns and reasonable valuation. Investors seeking aggressive growth might prefer IDEXX, while those favoring income and valuation stability may lean towards Quest Diagnostics.
Which one offers the Superior Shareholder Reward?
IDEXX Laboratories (IDXX) prioritizes reinvestment over dividends, with zero payout and a strong free cash flow per share of $13.2B fueling R&D and growth. Quest Diagnostics (DGX) delivers steady dividends with a 2% yield and a 37% payout ratio but has lower free cash flow at $8.2B. DGX’s share buybacks are moderate, while IDXX’s buyback activity is minimal, focusing instead on expanding its moat via innovation. Given IDXX’s higher operating margins, superior free cash flow coverage, and conservative capital structure, its reinvestment strategy promises stronger long-term total returns, despite the lack of dividends. I conclude that IDXX offers a more attractive and sustainable shareholder reward in 2026.
Comparative Score Analysis: The Strategic Profile
The radar chart reveals the fundamental DNA and trade-offs of both firms, highlighting their strategic financial strengths and vulnerabilities:
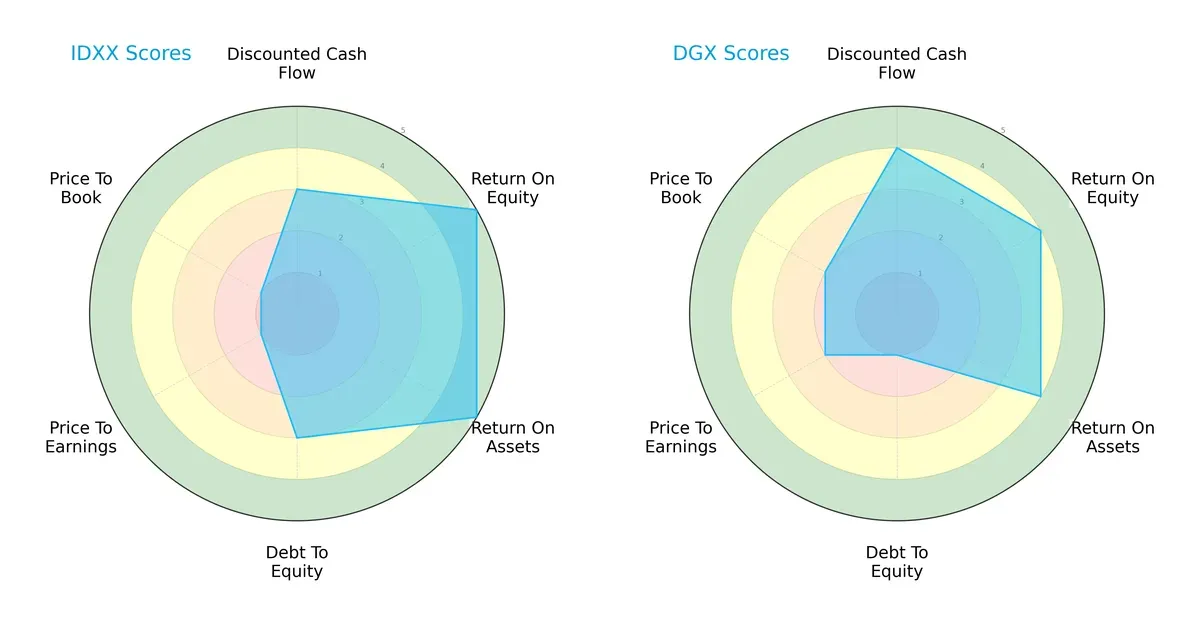
IDEXX Laboratories, Inc. (IDXX) excels in return metrics with top ROE and ROA scores of 5, signaling superior profit generation and asset utilization. Quest Diagnostics (DGX) leads in discounted cash flow (4) and maintains a favorable valuation profile (P/E:2, P/B:2), though with a weaker debt position (Debt/Equity:1). IDXX shows a more balanced operational efficiency, while DGX leverages valuation and cash flow advantages despite heavier leverage risks.
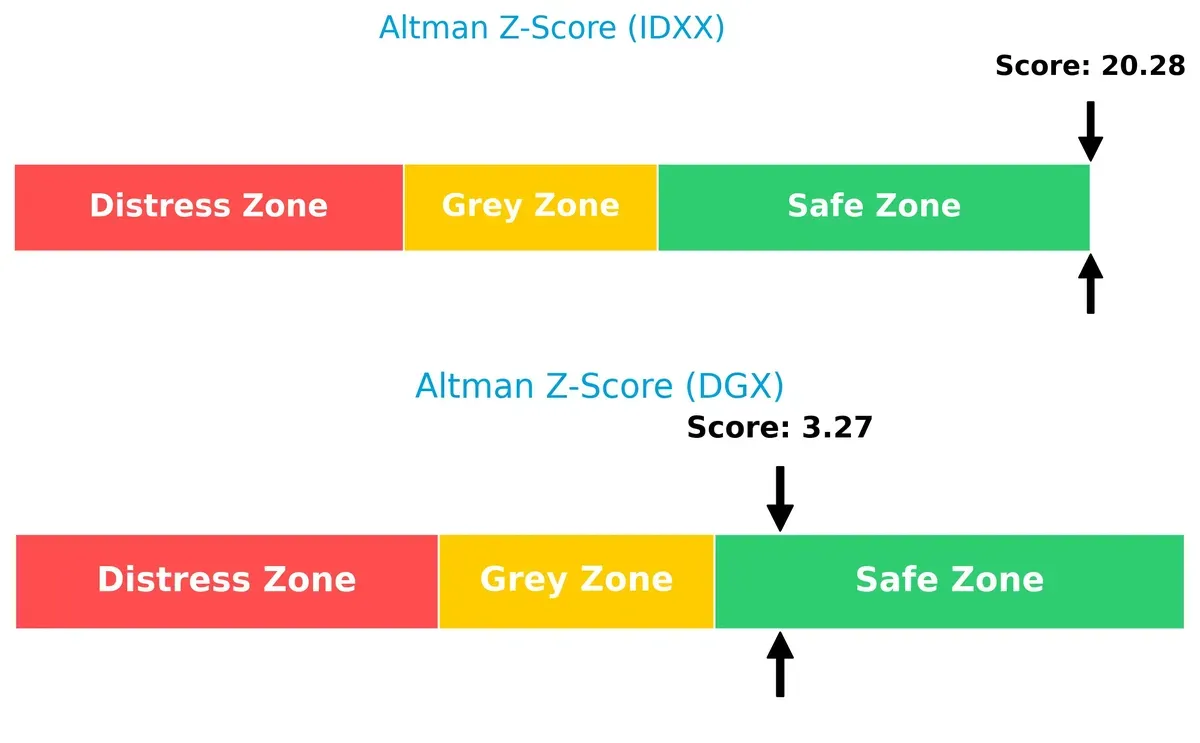
Bankruptcy Risk: Solvency Showdown
The Altman Z-Scores place both firms comfortably in the safe zone, but IDXX’s exceptionally high score (20.3) underscores a rock-solid solvency position compared to DGX’s moderate 3.3 score, implying superior long-term survival prospects in volatile markets:
Financial Health: Quality of Operations
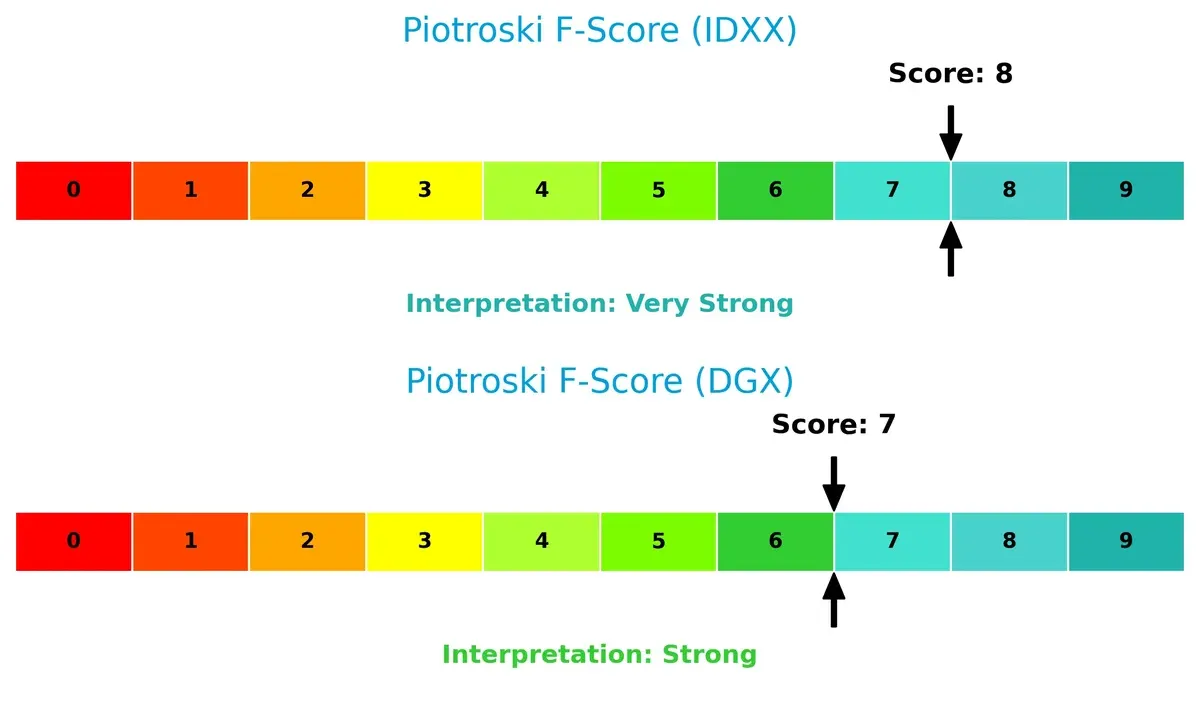
IDXX’s Piotroski F-Score of 8 indicates very strong financial health, slightly edging out DGX’s strong 7. This suggests IDXX’s internal metrics demonstrate a higher quality of operations and fewer red flags for investors considering financial robustness:
How are the two companies positioned?
This section dissects the operational DNA of IDXX and DGX by comparing their revenue distribution and internal dynamics. The goal is to confront their economic moats to reveal which model offers the most resilient, sustainable advantage today.
Revenue Segmentation: The Strategic Mix
This comparison dissects how IDEXX Laboratories and Quest Diagnostics diversify income streams and reveals their dominant sector bets for strategic insights:
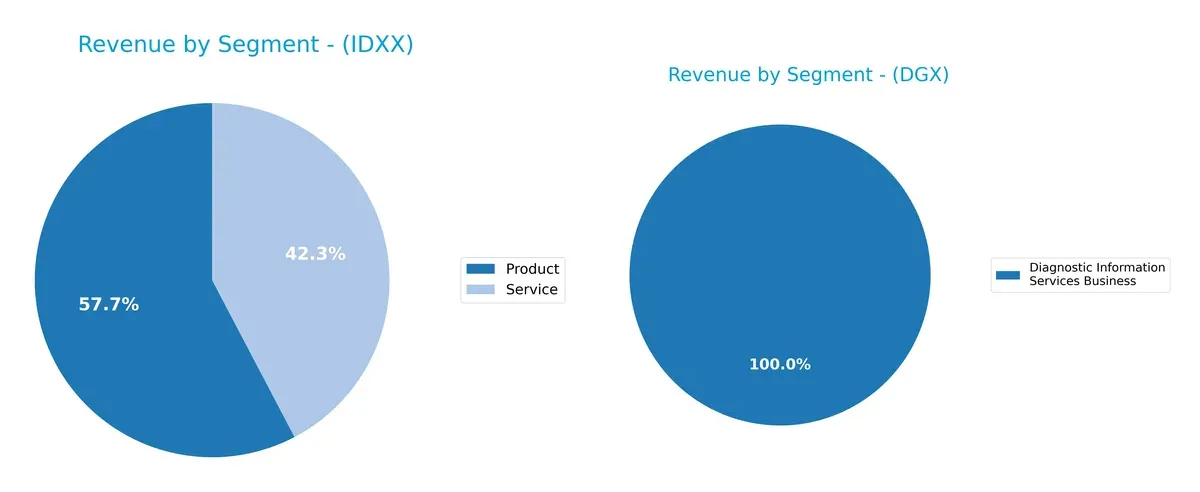
IDEXX Laboratories splits revenue chiefly between Products ($2.25B) and Services ($1.65B), showing a balanced dual-stream approach. Quest Diagnostics leans heavily on its Diagnostic Information Services Business, which dwarfs other segments with $9.61B in 2024, signaling concentration risk but strong infrastructure dominance. IDEXX’s diversified mix suggests resilience, while Quest pivots on ecosystem lock-in within diagnostics.
Strengths and Weaknesses Comparison
This table compares the strengths and weaknesses of IDEXX Laboratories and Quest Diagnostics based on explicit financial and operational data:
IDXX Strengths
- High profitability with 24.62% net margin
- Strong ROE at 65.99% and ROIC at 40.68%
- Low debt-to-equity of 0.05 and strong interest coverage of 35.61
- Solid asset turnover ratios indicating efficient use of assets
- Diverse revenue streams from products and services
- Significant global presence, especially in the US and EMEA
DGX Strengths
- Favorable cost of capital with WACC at 5.91%
- Good interest coverage at 6.2 and favorable fixed asset turnover
- Diversified testing services including gene-based and routine clinical
- Moderate dividend yield of 1.98%
- Neutral to favorable liquidity ratios, quick ratio at 1.02
- Large revenue base from diagnostic information services
IDXX Weaknesses
- High valuation multiples with P/E at 51.15 and P/B at 33.75
- WACC above ROIC indicating potential capital efficiency issues
- Neutral current and quick ratios suggest modest liquidity buffer
- No dividend yield, limiting income appeal
- High proportion of revenue from US market, less geographic diversification
DGX Weaknesses
- High debt-to-equity at 1.05 indicating leveraged balance sheet
- Moderate profitability metrics: net margin 8.82%, ROE 12.85%
- Lower asset turnover ratios pointing to less efficient asset use
- Neutral P/E and P/B ratios imply average market valuation
- Limited geographic revenue data restricts visibility on global reach
IDXX’s strengths lie in robust profitability and capital efficiency, but high valuation and limited dividend may concern some investors. DGX shows stable operational metrics and dividend income but carries higher leverage and less impressive profitability, impacting its capital structure and risk profile.
The Moat Duel: Analyzing Competitive Defensibility
A structural moat is the only barrier protecting long-term profits from relentless competition erosion. Let’s dissect how each company defends its turf:
IDEXX Laboratories, Inc.: Intangible Assets and Innovation Moat
IDEXX leverages proprietary diagnostic technology and strong brand trust, reflected in a robust 29% ROIC premium over WACC. Its high 31.7% EBIT margin confirms durable pricing power. New product launches in veterinary and human diagnostics deepen this moat in 2026.
Quest Diagnostics Incorporated: Scale and Network Moat
Quest’s moat centers on its expansive laboratory network and healthcare partnerships, unlike IDEXX’s tech focus. While it maintains scale advantages, a slim 1% ROIC premium over WACC and declining profitability raise caution. Expansion into advanced clinical testing offers growth but faces intense competition.
Innovation Edge vs. Scale Muscle: Which Moat Holds Firm?
IDEXX’s intangible asset moat delivers a wider, deeper competitive advantage with superior profitability and growth metrics. Quest’s scale is formidable but currently yields weaker value creation. IDEXX stands better equipped to defend and expand its market share in 2026.
Which stock offers better returns?
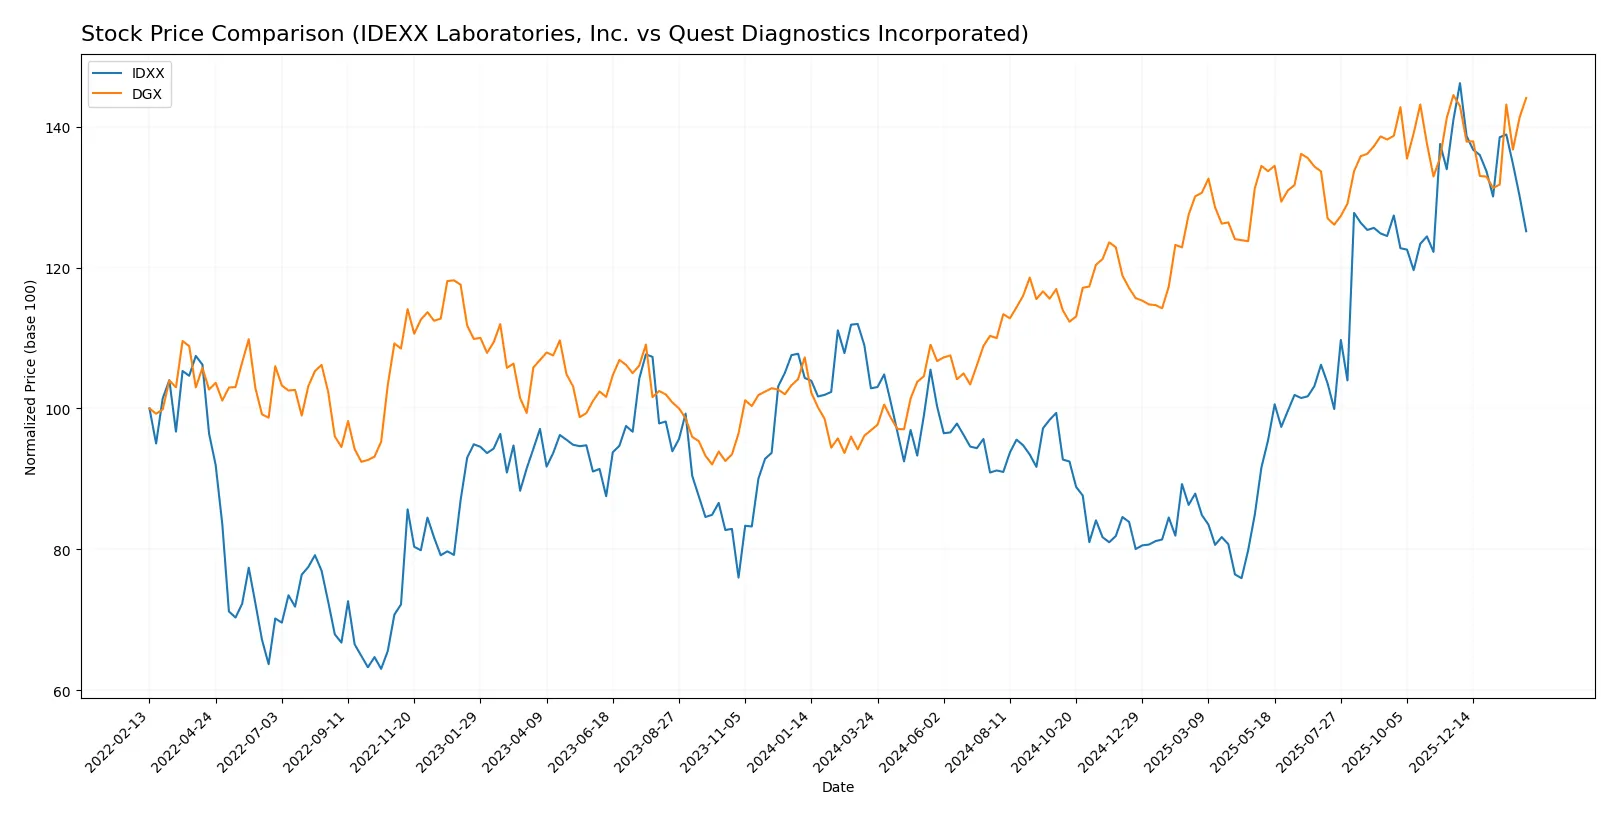
Stock prices for IDEXX Laboratories and Quest Diagnostics showed distinct movements over the past year, with notable highs and shifts in trading dominance emerging in each.
Trend Comparison
IDEXX Laboratories saw a 21.68% price increase over the last 12 months, indicating a bullish trend but with decelerating momentum and significant volatility. The recent three-month trend reversed, dropping 11.2%.
Quest Diagnostics posted a stronger 48.67% gain over the year, also bullish with deceleration. Volatility was lower than IDEXX. The recent three-month trend was nearly flat, down just 0.28%.
Quest Diagnostics outperformed IDEXX with higher annual returns and steadier recent price movement, reflecting stronger market performance through 2026.
Target Prices
Analysts present a bullish consensus for IDEXX Laboratories and a moderately positive outlook for Quest Diagnostics.
| Company | Target Low | Target High | Consensus |
|---|---|---|---|
| IDEXX Laboratories, Inc. | 730 | 830 | 789.29 |
| Quest Diagnostics Incorporated | 190 | 215 | 203.1 |
IDEXX targets exceed the current 645 price by over 20%, signaling strong growth expectations. Quest Diagnostics’ consensus is slightly above its 191 share price, suggesting modest upside potential.

Don’t Let Luck Decide Your Entry Point
Optimize your entry points with our advanced ProRealTime indicators. You’ll get efficient buy signals with precise price targets for maximum performance. Start outperforming now!
How do institutions grade them?
IDEXX Laboratories, Inc. Grades
The following table summarizes recent institutional grades for IDEXX Laboratories, Inc.:
| Grading Company | Action | New Grade | Date |
|---|---|---|---|
| Barclays | Maintain | Overweight | 2026-02-05 |
| BTIG | Maintain | Buy | 2026-02-03 |
| UBS | Maintain | Neutral | 2026-02-03 |
| UBS | Maintain | Neutral | 2025-11-04 |
| JP Morgan | Maintain | Overweight | 2025-11-04 |
| BTIG | Maintain | Buy | 2025-11-04 |
| Morgan Stanley | Maintain | Overweight | 2025-11-04 |
| Stifel | Upgrade | Buy | 2025-10-31 |
| Morgan Stanley | Maintain | Overweight | 2025-08-15 |
| Piper Sandler | Maintain | Neutral | 2025-08-11 |
Quest Diagnostics Incorporated Grades
The following table summarizes recent institutional grades for Quest Diagnostics Incorporated:
| Grading Company | Action | New Grade | Date |
|---|---|---|---|
| Piper Sandler | Maintain | Neutral | 2025-10-27 |
| Barclays | Maintain | Equal Weight | 2025-10-22 |
| Truist Securities | Maintain | Hold | 2025-10-22 |
| Jefferies | Maintain | Buy | 2025-10-21 |
| Leerink Partners | Maintain | Outperform | 2025-10-21 |
| UBS | Maintain | Neutral | 2025-10-17 |
| Mizuho | Maintain | Outperform | 2025-10-17 |
| Evercore ISI Group | Maintain | In Line | 2025-10-08 |
| Barclays | Maintain | Equal Weight | 2025-10-02 |
| Baird | Downgrade | Neutral | 2025-08-25 |
Which company has the best grades?
IDEXX Laboratories holds consistently stronger ratings, with multiple “Buy” and “Overweight” grades from top firms. Quest Diagnostics shows more mixed grades, including several “Neutral” and “Equal Weight” ratings. Investors may view IDEXX’s higher grades as a sign of stronger institutional confidence.
Risks specific to each company
The following categories identify the critical pressure points and systemic threats facing both firms in the 2026 market environment:
1. Market & Competition
IDEXX Laboratories, Inc.
- Operates in a specialized companion animal diagnostics niche with strong innovation but high valuation risks.
Quest Diagnostics Incorporated
- Faces broad diagnostic services competition with moderate margins and slower growth.
2. Capital Structure & Debt
IDEXX Laboratories, Inc.
- Low debt-to-equity ratio (0.05) signals conservative leverage and strong balance sheet.
Quest Diagnostics Incorporated
- High debt-to-equity ratio (1.05) raises financial risk and potential interest burden.
3. Stock Volatility
IDEXX Laboratories, Inc.
- Beta of 1.66 indicates higher volatility and sensitivity to market swings.
Quest Diagnostics Incorporated
- Beta of 0.675 shows lower volatility, offering more stability in turbulent markets.
4. Regulatory & Legal
IDEXX Laboratories, Inc.
- Exposure to veterinary and human diagnostics regulations; innovation demands compliance agility.
Quest Diagnostics Incorporated
- Faces complex healthcare regulations and potential legal claims impacting diagnostics services.
5. Supply Chain & Operations
IDEXX Laboratories, Inc.
- Diverse product lines with reliance on specialized manufacturing and distribution channels.
Quest Diagnostics Incorporated
- Operates an extensive network of labs and service centers, vulnerable to labor and logistics disruptions.
6. ESG & Climate Transition
IDEXX Laboratories, Inc.
- Growing focus on sustainable animal health products and water quality testing with moderate ESG risks.
Quest Diagnostics Incorporated
- Increasing pressure to reduce carbon footprint and enhance social governance in healthcare operations.
7. Geopolitical Exposure
IDEXX Laboratories, Inc.
- Primarily US-based but expanding globally with emerging market risks.
Quest Diagnostics Incorporated
- Strong US focus with some international exposure, sensitive to trade and healthcare policies.
Which company shows a better risk-adjusted profile?
IDEXX Laboratories faces significant valuation and stock volatility risks but benefits from a conservative capital structure and very strong financial health scores. Quest Diagnostics carries higher financial leverage and operational complexity but offers lower stock volatility and stable dividend income. The most impactful risk for IDEXX is its stretched valuation (high P/E and P/B), which could pressure returns if growth slows. For Quest, high debt levels pose a serious financial risk amid moderate profitability. Overall, IDEXX demonstrates a cleaner balance sheet and stronger profitability, suggesting a better risk-adjusted profile despite market volatility.
Final Verdict: Which stock to choose?
IDEXX Laboratories shines with unmatched capital efficiency, delivering stellar returns on equity and invested capital. Its superpower lies in sustaining high profitability while managing low debt. The main point of vigilance is its premium valuation, which demands patience and conviction. It suits an aggressive growth portfolio that can tolerate elevated multiples.
Quest Diagnostics offers a strategic moat grounded in steady cash flow and a more conservative capital structure. Its recurring revenue and solid income quality provide a safety cushion compared to IDEXX. This stock fits well within a Growth at a Reasonable Price (GARP) portfolio seeking stability with moderate upside.
If you prioritize high return on invested capital and are comfortable with paying a premium, IDEXX Laboratories is the compelling choice due to its value creation and growth trajectory. However, if you seek better stability and a margin of safety, Quest Diagnostics offers superior resilience with less valuation risk. Both present distinct analytical scenarios tailored to different investor profiles.
Disclaimer: Investment carries a risk of loss of initial capital. The past performance is not a reliable indicator of future results. Be sure to understand risks before making an investment decision.
Go Further
I encourage you to read the complete analyses of IDEXX Laboratories, Inc. and Quest Diagnostics Incorporated to enhance your investment decisions: