In the rapidly evolving healthcare diagnostics and research sector, IDEX Laboratories, Inc. (IDXX) and IQVIA Holdings Inc. (IQV) stand out as two influential players. Both companies leverage innovation to serve the medical industry, with overlapping interests in diagnostics, data analytics, and clinical services. This comparison focuses on their market strategies and growth potential, helping you identify which stock might be the most compelling addition to your investment portfolio. Let’s explore their strengths and opportunities together.
Table of contents
Companies Overview
I will begin the comparison between IDEXX Laboratories and IQVIA Holdings by providing an overview of these two companies and their main differences.
IDEXX Laboratories Overview
IDEXX Laboratories, Inc. focuses on developing, manufacturing, and distributing diagnostic products and services primarily for companion animals, livestock, poultry, dairy, and water testing markets worldwide. The company operates in veterinary diagnostics, reference laboratory services, and water quality testing. Headquartered in Westbrook, Maine, IDEXX is a key player in veterinary diagnostic instruments and consumables, serving independent clinics and corporate groups.
IQVIA Holdings Overview
IQVIA Holdings Inc. delivers advanced analytics, technology solutions, and clinical research services to the life sciences sector globally. Its operations span Technology & Analytics Solutions, Research & Development Solutions, and Contract Sales & Medical Solutions. Based in Durham, North Carolina, IQVIA supports pharmaceutical, biotechnology, and consumer health companies with cloud applications, clinical trial services, and medical engagement.
Key similarities and differences
Both IDEXX and IQVIA operate within the healthcare diagnostics and research industry, serving specialized markets. IDEXX focuses more on veterinary diagnostics and water testing, whereas IQVIA emphasizes life sciences analytics, clinical trials, and commercial services. IDEXX’s business model centers on diagnostic instruments and test kits, while IQVIA integrates technology-driven solutions with research and sales support, reflecting their distinct market approaches.
Income Statement Comparison
This table compares key income statement metrics for IDEXX Laboratories, Inc. and IQVIA Holdings Inc. for the fiscal year 2024, highlighting their financial performance.

| Metric | IDEXX Laboratories, Inc. | IQVIA Holdings Inc. |
|---|---|---|
| Market Cap | 57B | 41B |
| Revenue | 3.90B | 15.41B |
| EBITDA | 1.28B | 3.45B |
| EBIT | 1.14B | 2.34B |
| Net Income | 888M | 1.37B |
| EPS | 10.77 | 7.57 |
| Fiscal Year | 2024 | 2024 |
Income Statement Interpretations
IDEXX Laboratories, Inc.
IDEXX Laboratories displayed steady revenue growth from 2020 to 2024, with a 44% increase overall, reaching $3.9B in 2024. Net income rose 53% over the period, hitting $888M in 2024. Margins remained solid, with gross margin at 61.04% and net margin near 23%. In 2024, revenue growth slowed to 6.5%, while EPS increased by 6.1%, despite a slight dip in net margin.
IQVIA Holdings Inc.
IQVIA’s revenue rose steadily from $11.4B in 2020 to $15.4B in 2024, a 35.6% increase, with net income surging 392% to $1.37B. Margins improved notably, gross margin at 34.9% and net margin at 8.9% in 2024. However, revenue growth slowed to 2.8% in the latest year, with EBIT growth at 9.8% and EPS growing 2.7%, though net margin declined slightly.
Which one has the stronger fundamentals?
Both companies show favorable fundamentals, but IDEXX exhibits higher profitability margins and steadier revenue growth, while IQVIA demonstrates remarkable net income and EPS growth over the long term. IDEXX’s superior gross and net margins contrast with IQVIA’s stronger overall growth in net income and earnings per share, reflecting differing strengths in operational efficiency and scale expansion.
Financial Ratios Comparison
The table below presents key financial ratios for IDEXX Laboratories, Inc. (IDXX) and IQVIA Holdings Inc. (IQV) based on their fiscal year 2024 data, facilitating a side-by-side comparison.
| Ratios | IDEXX Laboratories, Inc. (IDXX) | IQVIA Holdings Inc. (IQV) |
|---|---|---|
| ROE | 55.7% | 22.6% |
| ROIC | 33.9% | 8.6% |
| P/E | 38.4 | 25.9 |
| P/B | 21.4 | 5.9 |
| Current Ratio | 1.31 | 0.84 |
| Quick Ratio | 0.95 | 0.84 |
| D/E (Debt-to-Equity) | 0.62 | 2.33 |
| Debt-to-Assets | 30.0% | 52.6% |
| Interest Coverage | 36.2 | 3.29 |
| Asset Turnover | 1.18 | 0.57 |
| Fixed Asset Turnover | 4.70 | 19.93 |
| Payout Ratio | 0% | 0% |
| Dividend Yield | 0% | 0% |
Interpretation of the Ratios
IDEXX Laboratories, Inc.
IDEXX shows a strong profitability profile with favorable net margin (22.78%), ROE (55.65%), and ROIC (33.87%), while its valuation multiples (PE 38.4, PB 21.37) and WACC (11.5%) are unfavorable. Liquidity and leverage ratios are mostly neutral or favorable, suggesting balanced financial health. The company does not pay dividends, likely reinvesting earnings to support growth.
IQVIA Holdings Inc.
IQV presents mixed ratio results: ROE is favorable at 22.63%, but net margin (8.91%) and ROIC (8.59%) are neutral. The firm struggles with liquidity (current ratio 0.84, unfavorable) and high leverage (debt-to-equity 2.33, debt-to-assets 52.63%, both unfavorable). No dividends are paid, indicating a focus on reinvestment or other capital uses amid these financial constraints.
Which one has the best ratios?
IDEXX holds a more favorable ratio profile overall, with half of its key metrics positive and solid profitability measures. IQV faces more challenges in liquidity and leverage, reflected in a higher proportion of unfavorable ratios. Consequently, IDEXX’s ratios appear stronger and more consistent than IQV’s based on the 2024 fiscal year data.
Strategic Positioning
This section compares the strategic positioning of IDEXX Laboratories and IQVIA Holdings, focusing on market position, key segments, and exposure to technological disruption:
IDEXX Laboratories, Inc.
- Leading in veterinary and water testing diagnostics with moderate beta.
- Focuses on veterinary diagnostics, water testing, and biomedical research.
- Exposed to disruption via veterinary diagnostic innovations and software.
IQVIA Holdings Inc.
- Provides advanced analytics and clinical research with lower beta.
- Operates in technology, R&D solutions, and contract sales for life sciences.
- Faces disruption from cloud-based analytics and virtual trial technologies.
IDEXX Laboratories, Inc. vs IQVIA Holdings Inc. Positioning
IDXX has a concentrated focus on animal diagnostics and water testing, relying on consumables and instruments, while IQVIA diversifies across technology, analytics, and clinical research, serving broader life sciences. IDXX benefits from specialized niche expertise; IQVIA leverages scale and multiple service lines.
Which has the best competitive advantage?
IDXX shows a slightly favorable moat with value creation despite a declining ROIC trend. IQVIA has a slightly unfavorable moat, shedding value but with improving profitability. IDXX currently holds a stronger competitive advantage based on MOAT evaluation.
Stock Comparison
The stock prices of IDEXX Laboratories, Inc. (IDXX) and IQVIA Holdings Inc. (IQV) have shown distinct movements and trading dynamics over the past year, with IDXX exhibiting a strong upward trajectory and IQV maintaining a more subdued growth pattern.
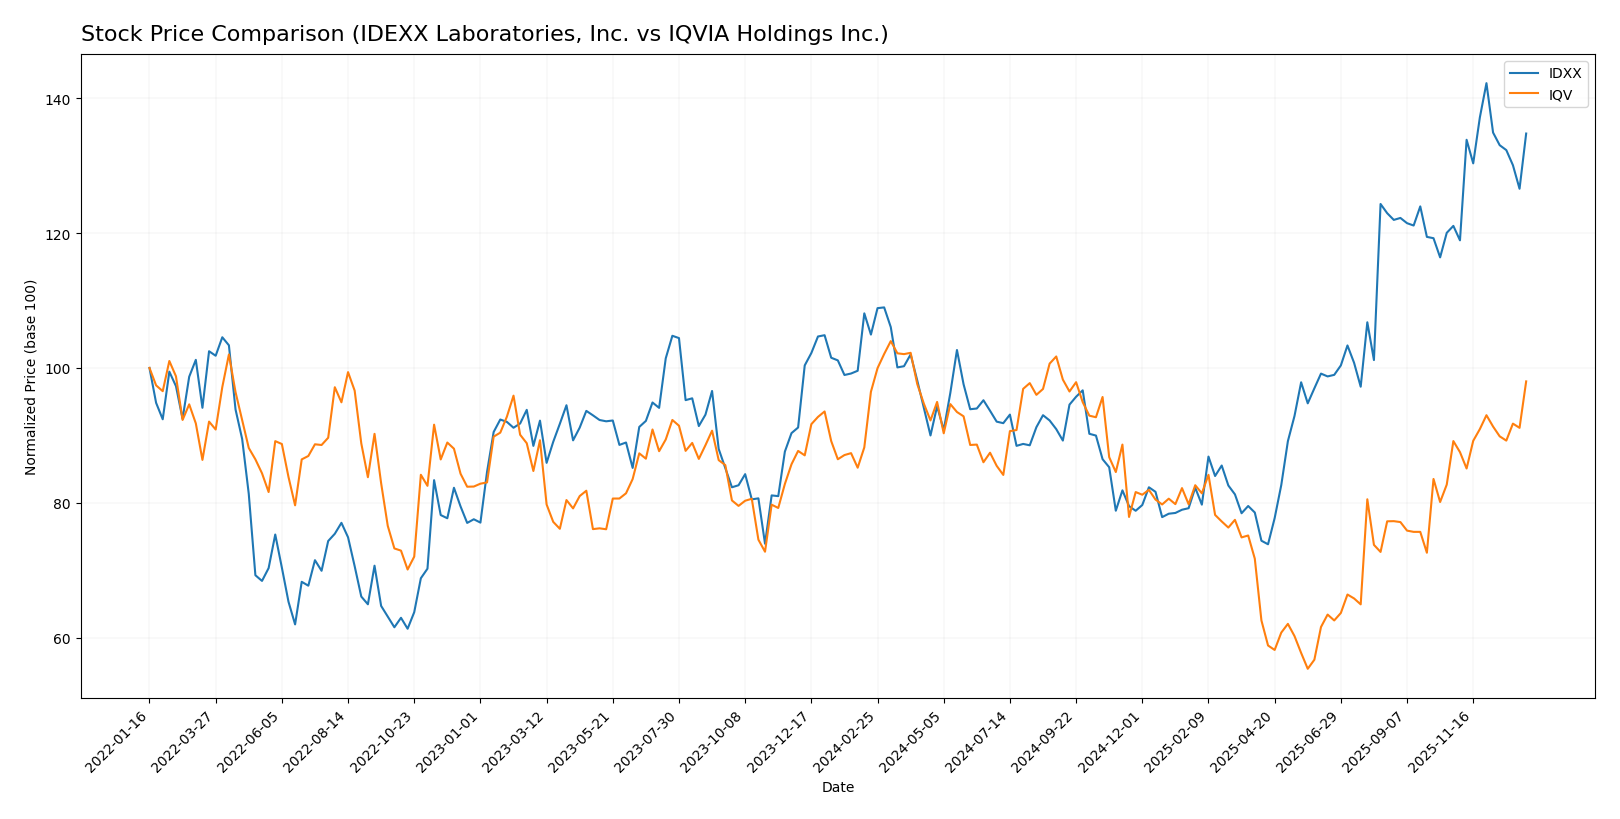
Trend Analysis
IDXX’s stock price increased by 28.41% over the past 12 months, indicating a bullish trend with acceleration. The stock reached a high of 752.88 and a low of 390.94, supported by high volatility (std deviation 91.81).
IQV’s stock price rose by 1.6% over the same period, reflecting a neutral trend despite acceleration. Its price ranged from 137.0 to 257.18, with lower volatility (std deviation 30.97).
Comparing both, IDXX delivered the highest market performance with a significantly stronger price appreciation and volatility than IQV over the last year.
Target Prices
Here is the current target price consensus from recognized analysts for IDEXX Laboratories, Inc. and IQVIA Holdings Inc.
| Company | Target High | Target Low | Consensus |
|---|---|---|---|
| IDEXX Laboratories, Inc. | 850 | 750 | 803.57 |
| IQVIA Holdings Inc. | 290 | 214 | 253.2 |
Analysts expect both stocks to appreciate, with IDEXX’s target consensus about 12.6% above its current price of 713.35, and IQVIA’s target consensus roughly 4.5% higher than its current 242.41 price. This suggests moderate upside potential for both.
Analyst Opinions Comparison
This section compares analysts’ ratings and grades for IDEXX Laboratories, Inc. and IQVIA Holdings Inc.:
Rating Comparison
IDXX Rating
- Rating: B, considered Very Favorable overall by analysts.
- Discounted Cash Flow Score: Moderate at 3, indicating fair valuation outlook.
- ROE Score: Very Favorable at 5, reflecting efficient profit generation.
- ROA Score: Very Favorable at 5, showing excellent asset utilization.
- Debt To Equity Score: Very Unfavorable at 1, implying high financial risk.
IQV Rating
- Rating: B+, also rated Very Favorable overall by analysts.
- Discounted Cash Flow Score: Favorable at 4, suggesting better valuation view.
- ROE Score: Very Favorable at 5, also indicating strong profit efficiency.
- ROA Score: Favorable at 4, demonstrating good but slightly lower asset use.
- Debt To Equity Score: Very Unfavorable at 1, indicating similar financial risk.
Which one is the best rated?
IQV holds a slightly better rating with a B+ compared to IDXX’s B, driven by a more favorable discounted cash flow and return on assets scores. Both share very favorable ROE but face similar debt-related risks.
Scores Comparison
The scores comparison between IDEXX Laboratories, Inc. and IQVIA Holdings Inc. is as follows:
IDXX Scores
- Altman Z-Score: 23.01, indicating a safe financial zone
- Piotroski Score: 8, reflecting very strong financial health
IQV Scores
- Altman Z-Score: 2.15, indicating a grey financial zone
- Piotroski Score: 5, reflecting average financial health
Which company has the best scores?
Based on the provided data, IDXX has significantly higher Altman Z-Score and Piotroski Score values than IQV, indicating stronger financial stability and health. IQV shows moderate financial risk and average strength by comparison.
Grades Comparison
Here is a comparison of the recent grades assigned to the two companies by recognized grading firms:
IDEXX Laboratories, Inc. Grades
This table summarizes the latest grades from established grading companies for IDEXX Laboratories, Inc.:
| Grading Company | Action | New Grade | Date |
|---|---|---|---|
| BTIG | Maintain | Buy | 2025-11-04 |
| JP Morgan | Maintain | Overweight | 2025-11-04 |
| UBS | Maintain | Neutral | 2025-11-04 |
| Morgan Stanley | Maintain | Overweight | 2025-11-04 |
| Stifel | Upgrade | Buy | 2025-10-31 |
Overall, IDEXX Laboratories has consistently received favorable grades, mostly “Buy” and “Overweight,” with one recent upgrade indicating positive momentum.
IQVIA Holdings Inc. Grades
This table presents recent grades from recognized grading companies for IQVIA Holdings Inc.:
| Grading Company | Action | New Grade | Date |
|---|---|---|---|
| Truist Securities | Maintain | Buy | 2026-01-08 |
| UBS | Maintain | Buy | 2026-01-08 |
| Morgan Stanley | Maintain | Overweight | 2025-12-02 |
| TD Cowen | Downgrade | Hold | 2025-11-03 |
| Baird | Upgrade | Outperform | 2025-10-29 |
IQVIA’s grades show a mix of strong buy signals with some recent downgrades, reflecting a more varied analyst outlook but still an overall positive consensus.
Which company has the best grades?
Both companies have a consensus “Buy” rating, but IQVIA holds a larger number of “Buy” and “Strong Buy” ratings overall, reflecting stronger analyst conviction. This may lead to greater investor interest and perceived growth potential compared to IDEXX Laboratories.
Strengths and Weaknesses
Below is a comparison of key strengths and weaknesses of IDEXX Laboratories, Inc. (IDXX) and IQVIA Holdings Inc. (IQV) based on recent performance and financial metrics.
| Criterion | IDEXX Laboratories, Inc. (IDXX) | IQVIA Holdings Inc. (IQV) |
|---|---|---|
| Diversification | Moderate diversification with strong product and service segments; significant revenue from product sales (2.25B) and services (1.65B) in 2024. | Highly diversified with three major segments: R&D solutions (8.53B), technology & analytics (6.16B), and contract sales (718M) in 2024. |
| Profitability | High profitability with net margin at 22.78%, ROE 55.65%, and ROIC 33.87%; however, PE (38.4) and PB (21.37) ratios are high, indicating premium valuation. | Moderate profitability: net margin 8.91%, ROE 22.63%, ROIC 8.59%; valuation multiples (PE 25.95, PB 5.87) are lower but still relatively elevated. |
| Innovation | Consistent product innovation in veterinary diagnostics, supported by stable revenue growth in product lines. | Strong focus on innovation via R&D and technology analytics, showing growing ROIC and expanding solutions portfolio. |
| Global presence | Solid global footprint in veterinary markets but less diversified geographically compared to IQV. | Extensive global presence in healthcare services and clinical research, leveraging broad analytics capabilities. |
| Market Share | Leader in veterinary diagnostic markets with growing customer loyalty programs. | Major player in healthcare analytics and contract research services with strong competitive positioning. |
Key takeaways: IDEXX shows strong profitability and value creation but faces a slightly declining ROIC trend and premium valuation. IQV, while currently shedding value, demonstrates improving profitability with significant diversification and innovation potential. Both require careful assessment of valuation and growth sustainability before investment.
Risk Analysis
Below is a comparative overview of key risks for IDEXX Laboratories, Inc. (IDXX) and IQVIA Holdings Inc. (IQV) based on the most recent data from 2024.
| Metric | IDEXX Laboratories, Inc. (IDXX) | IQVIA Holdings Inc. (IQV) |
|---|---|---|
| Market Risk | Beta 1.67 indicates higher volatility risk | Beta 1.37, moderate market volatility risk |
| Debt level | Debt-to-Equity 0.62 (neutral), Debt-to-Assets 30% (favorable) | Debt-to-Equity 2.33 (unfavorable), Debt-to-Assets 53% (unfavorable) |
| Regulatory Risk | Moderate, healthcare diagnostics sector is regulated but stable | Moderate to high, extensive global clinical research subject to evolving regulations |
| Operational Risk | Medium, reliant on product innovation and supply chain | Medium-high, complex global operations in technology and clinical trials |
| Environmental Risk | Low, limited direct environmental impact noted | Low to moderate, some operational environmental footprint |
| Geopolitical Risk | Low, primarily US-based with some international exposure | Moderate, significant global footprint across multiple regions |
IDEXX presents higher market volatility but maintains a healthier debt profile and strong financial stability (Altman Z-score in safe zone). IQV faces higher leverage risks and geopolitical exposure due to its global operations. Debt and regulatory challenges pose the most impactful risks for IQV, while market fluctuations and valuation concerns are more prominent for IDEXX.
Which Stock to Choose?
IDEXX Laboratories, Inc. (IDXX) shows a favorable income evolution with strong net margin at 22.78% and consistent revenue growth over 44% from 2020 to 2024. Its financial ratios indicate high profitability, with ROE at 55.65%, and moderate debt levels, while its overall rating is very favorable.
IQVIA Holdings Inc. (IQV) presents a positive income trend with an 8.91% net margin and significant net income growth over 392% in the same period. Financial ratios reveal moderate profitability, ROE at 22.63%, but higher leverage with unfavorable debt metrics, supported by a very favorable rating as well.
For investors prioritizing strong profitability and moderate debt, IDXX might appear more favorable due to its robust income and financial ratios alongside a solid rating. Conversely, IQV could be interpreted as suitable for those focusing on growth potential despite higher leverage, given its income growth and improving profitability metrics.
Disclaimer: Investment carries a risk of loss of initial capital. The past performance is not a reliable indicator of future results. Be sure to understand risks before making an investment decision.
Go Further
I encourage you to read the complete analyses of IDEXX Laboratories, Inc. and IQVIA Holdings Inc. to enhance your investment decisions: