Home > Comparison > Industrials > XYL vs IEX
The strategic rivalry between Xylem Inc. and IDEX Corporation shapes the competitive landscape of the industrial machinery sector. Xylem operates as a capital-intensive powerhouse specializing in water and wastewater solutions, while IDEX excels as a diversified applied solutions provider with a focus on fluidics and safety technologies. This head-to-head pits scale and infrastructure against specialization and innovation. This analysis aims to identify which trajectory offers superior risk-adjusted potential for a balanced portfolio.
Table of contents
Companies Overview
Xylem Inc. and IDEX Corporation both hold pivotal roles in the industrial machinery sector with distinct market approaches.
Xylem Inc.: Water Technology Leader
Xylem Inc. dominates the water and wastewater solutions market, generating revenue through engineered products and services. Its three segments—Water Infrastructure, Applied Water, and Measurement & Control—offer pumps, filtration, and smart metering technologies. In 2026, Xylem sharpens its focus on integrated water management and advanced analytics to optimize global water systems.
IDEX Corporation: Applied Solutions Specialist
IDEX Corporation excels in applied fluidics and precision engineered products worldwide. Revenue streams flow from its Fluid & Metering Technologies, Health & Science Technologies, and Fire & Safety/Diversified Products segments. For 2026, IDEX emphasizes innovation in fluid handling and safety equipment, targeting diverse industries from pharmaceuticals to firefighting.
Strategic Collision: Similarities & Divergences
Both companies compete in industrial machinery but diverge in focus. Xylem pursues a water-centric ecosystem blending hardware and software, while IDEX prioritizes precision engineered components across varied sectors. Their primary battleground lies in fluid management solutions. Investors will find Xylem’s profile tied to infrastructure modernization, whereas IDEX offers a diversified industrial exposure.
Income Statement Comparison
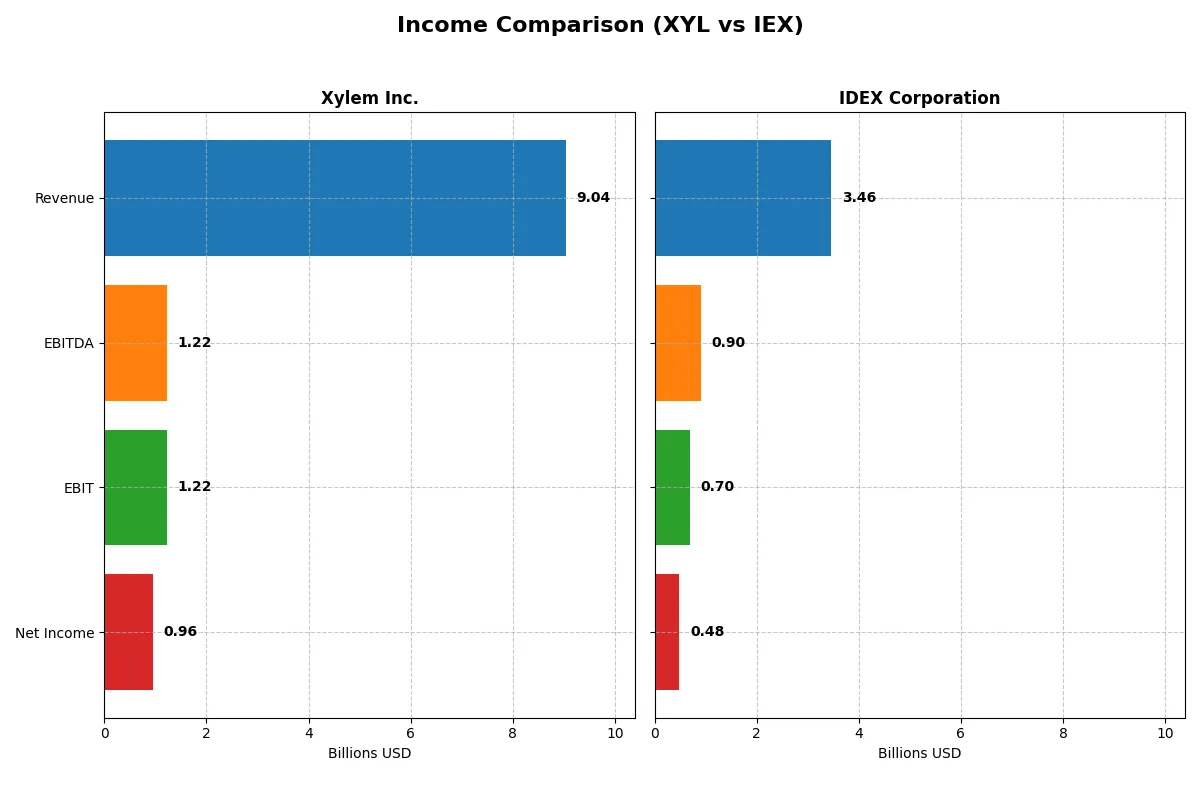
This data dissects the core profitability and scalability of both corporate engines to reveal who dominates the bottom line:
| Metric | Xylem Inc. (XYL) | IDEX Corporation (IEX) |
|---|---|---|
| Revenue | 9.04B | 3.46B |
| Cost of Revenue | 5.56B | 1.92B |
| Operating Expenses | 2.25B | 819M |
| Gross Profit | 3.48B | 1.54B |
| EBITDA | 1.22B | 904M |
| EBIT | 1.22B | 697M |
| Interest Expense | 29M | 64M |
| Net Income | 957M | 483M |
| EPS | 3.93 | 6.41 |
| Fiscal Year | 2025 | 2025 |
Income Statement Analysis: The Bottom-Line Duel
The following income statement comparison reveals which company operates its business with stronger efficiency and profitability dynamics.
Xylem Inc. Analysis
Xylem Inc. shows a robust revenue climb, reaching $9.04B in 2025, up 5.5% from 2024. Net income rose to $957M, reflecting healthy expansion. Gross margin steadies at 38.5%, while net margin holds a solid 10.6%. Xylem’s operating income surged 8.1% year-over-year, signaling improving operational efficiency and strong bottom-line momentum.
IDEX Corporation Analysis
IDEX Corporation’s revenue grew modestly to $3.46B in 2025, a 5.8% increase from 2024. Net income slipped to $483M, down 4.3%, despite favorable gross margin of 44.5%. EBIT margin stands superior at 20.2%, but net margin contracted to 14.0%. Recent results show margin pressure and a decline in net profitability, tempering top-line gains.
Margin Strength vs. Growth Trajectory
Xylem leads with stronger earnings growth and expanding margins, achieving 124% net income growth over five years versus IDEX’s 7.5%. While IDEX boasts higher gross and EBIT margins, its net margin and EPS declined recently. Xylem’s profile suits investors prioritizing accelerating profit momentum, whereas IDEX appeals for margin stability amid growth challenges.
Financial Ratios Comparison
These vital ratios act as a diagnostic tool to expose the underlying fiscal health, valuation premiums, and capital efficiency of the companies analyzed:
| Ratios | Xylem Inc. (XYL) | IDEX Corporation (IEX) |
|---|---|---|
| ROE | 8.34% | 12.00% |
| ROIC | 6.42% | 8.65% |
| P/E | 34.64 | 27.73 |
| P/B | 2.89 | 3.33 |
| Current Ratio | 1.63 | 2.86 |
| Quick Ratio | 1.28 | 2.02 |
| D/E | 0.17 | 0.45 |
| Debt-to-Assets | 11.0% | 26.3% |
| Interest Coverage | 42.17 | 11.18 |
| Asset Turnover | 0.51 | 0.50 |
| Fixed Asset Turnover | 7.80 | 7.39 |
| Payout ratio | 40.9% | 44.0% |
| Dividend yield | 1.18% | 1.59% |
| Fiscal Year | 2025 | 2025 |
Efficiency & Valuation Duel: The Vital Signs
Financial ratios act as a company’s DNA, uncovering hidden risks and operational strengths that define its market standing and growth potential.
Xylem Inc.
Xylem’s ROE stands at a modest 8.34%, reflecting moderate profitability, while its net margin of 10.59% signals operational efficiency. The stock trades at a stretched P/E of 34.64, suggesting premium valuation. Shareholders receive a 1.18% dividend yield, balancing income with reinvestment in R&D for future growth.
IDEX Corporation
IDEX posts a stronger ROE of 12.0% and a superior net margin of 13.98%, showcasing robust profitability. Its P/E of 27.73 remains elevated but less stretched than Xylem’s. The company offers a 1.59% dividend yield, signaling steady shareholder returns alongside efficient capital allocation.
Premium Valuation vs. Operational Safety
IDEX offers a better profitability and margin profile, though with a relatively high valuation. Xylem’s premium price reflects growth expectations but lags in ROE. Investors seeking operational strength may prefer IDEX, while those favoring growth and reinvestment might lean toward Xylem.
Which one offers the Superior Shareholder Reward?
I see IDEX (IEX) delivers a stronger shareholder reward than Xylem (XYL) in 2026. IEX’s dividend yield stands at 1.59%, outpacing XYL’s 1.18%, with a more conservative payout ratio around 44%, supporting sustainability. Both firms prioritize buybacks, but IEX’s robust free cash flow per share of 8.19B versus XYL’s 3.74B powers a more intense repurchase program. IEX’s leaner capital expenditure coverage and higher operating margin underpin a durable distribution model. IEX offers a more attractive total return profile through balanced dividends and aggressive buybacks, ensuring long-term value creation.
Comparative Score Analysis: The Strategic Profile
The radar chart reveals the fundamental DNA and trade-offs of Xylem Inc. and IDEX Corporation, highlighting their key financial strengths and weaknesses:
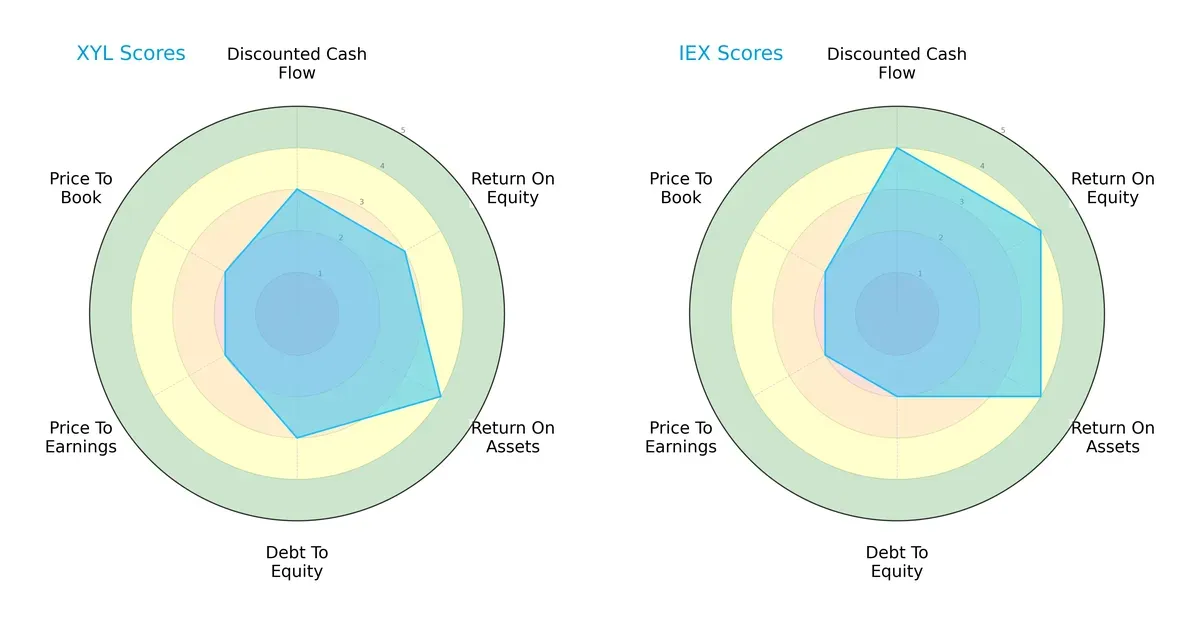
IEX shows a stronger profile in discounted cash flow, return on equity, and return on assets, signaling efficient capital use. Xylem offers a more balanced debt-to-equity stance but lags in valuation metrics where both firms score low. IEX leans on operational efficiency, while Xylem maintains moderate leverage discipline.
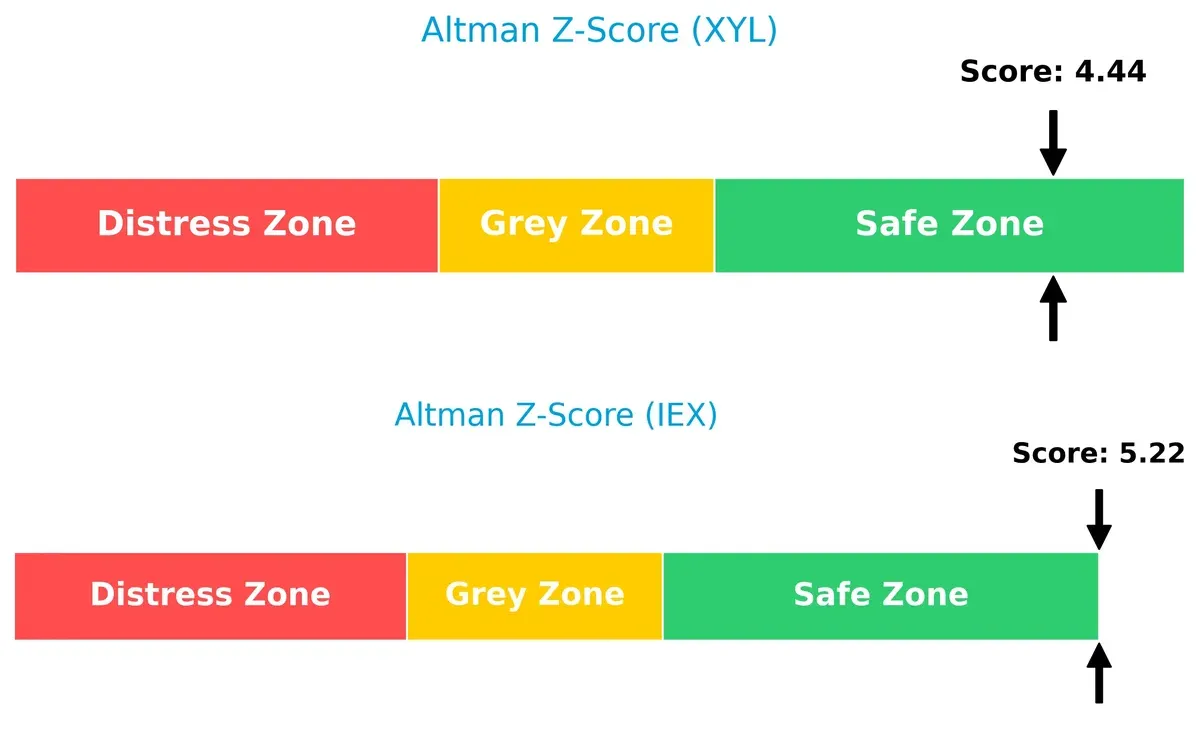
Bankruptcy Risk: Solvency Showdown
I observe both companies firmly in the safe zone, with IEX’s higher Altman Z-Score suggesting a marginally stronger buffer against financial distress in this cycle:
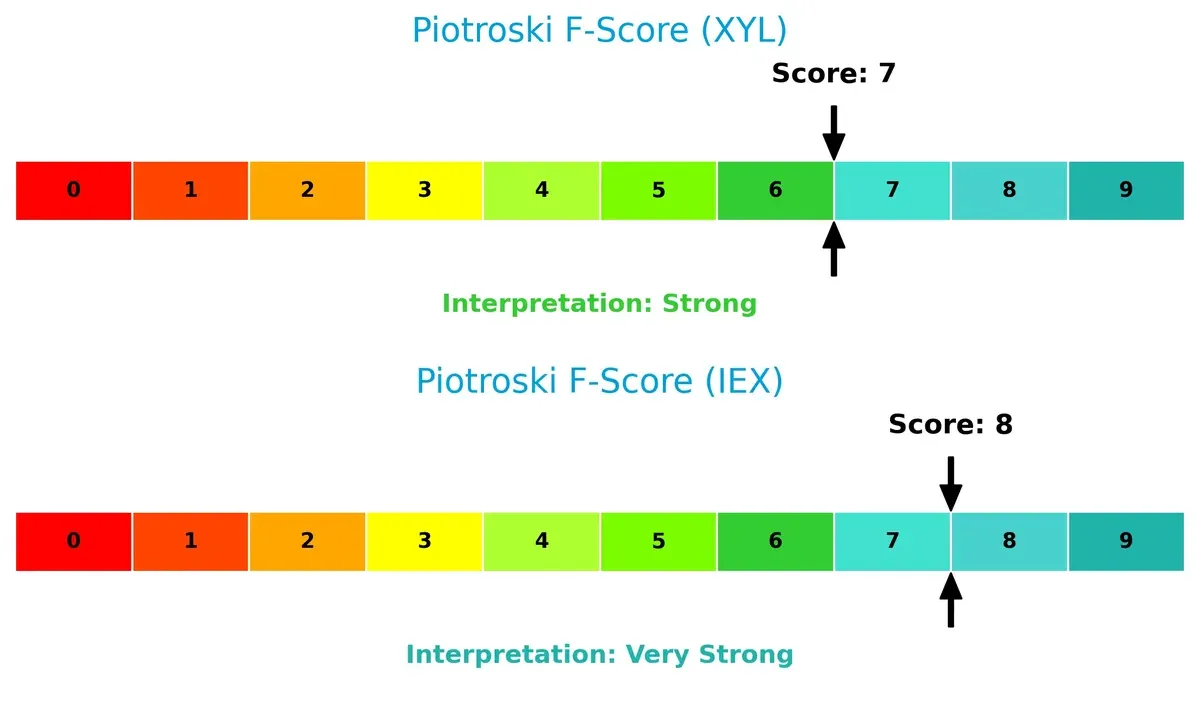
Financial Health: Quality of Operations
IEX’s Piotroski F-Score of 8 indicates very strong financial health, outperforming Xylem’s solid but lesser score of 7. This signals fewer red flags in IEX’s internal metrics compared to Xylem:
How are the two companies positioned?
This section dissects the operational DNA of XYL and IEX by comparing their revenue distribution and internal strengths and weaknesses. The goal is to confront their economic moats to reveal which model offers the most resilient, sustainable competitive advantage today.
Revenue Segmentation: The Strategic Mix
This visual comparison dissects how Xylem Inc. and IDEX Corporation diversify their income streams and highlights each firm’s primary sector focus:
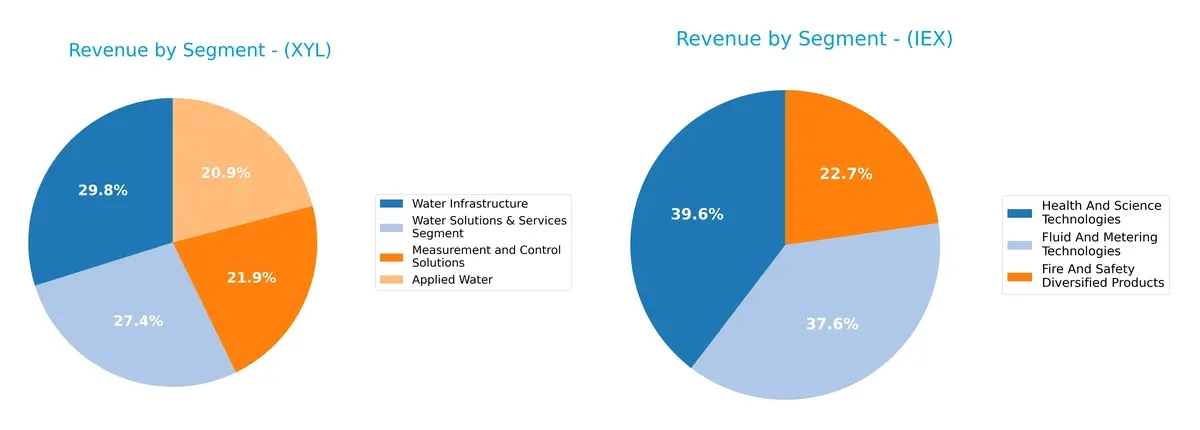
Xylem Inc. shows a balanced revenue mix with Water Infrastructure at $2.56B and Water Solutions & Services at $2.34B anchoring its portfolio. Measurement and Control Solutions at $1.87B adds diversification. In contrast, IDEX Corporation’s segments cluster near $1.3B in Health and Science Technologies, with Fire and Safety and Fluid and Metering near $0.74B and $1.23B. Xylem’s broader base mitigates risk, while IDEX’s concentration pivots on specialized technologies, suggesting higher segment concentration risk but deeper domain expertise.
Strengths and Weaknesses Comparison
This table compares the strengths and weaknesses of Xylem Inc. and IDEX Corporation based on diversification, profitability, financials, innovation, global presence, and market share:
Xylem Inc. Strengths
- Diversified segments including Water Infrastructure and Measurement Solutions
- Favorable net margin at 10.59%
- Strong liquidity with current ratio of 1.62
- Low leverage with debt-to-assets at 11.01%
- High fixed asset turnover at 7.8
- Significant revenue from US and Europe markets
IDEX Corporation Strengths
- Higher net margin at 13.98%
- Favorable WACC at 7.69% indicating efficient capital cost
- Strong liquidity with current ratio of 2.86
- Moderate leverage with debt-to-assets at 26.29%
- Diversified product segments including Health and Safety
- Solid US market revenue with growing Asia and Europe presence
Xylem Inc. Weaknesses
- Unfavorable ROE at 8.34% below WACC (8.75%)
- High P/E of 34.64 may indicate overvaluation
- Neutral ROIC at 6.42%
- Moderate asset turnover at 0.51
- Heavy reliance on US market (approx. 55% of revenue)
- Neutral dividend yield at 1.18%
IDEX Corporation Weaknesses
- Unfavorable P/B ratio at 3.33 above industry norms
- Unfavorable asset turnover at 0.5
- Neutral ROIC at 8.65% close to WACC (7.69%)
- Higher leverage ratio compared to XYL
- Unfavorable P/E at 27.73
- Reliance on US market despite some geographic diversification
Overall, Xylem shows strengths in liquidity, low debt, and asset efficiency but faces concerns with returns below capital costs and valuation. IDEX exhibits better profitability and capital efficiency but carries higher leverage and valuation risks. Both companies lean heavily on the US market, implying geographic concentration risk for their growth strategies.
The Moat Duel: Analyzing Competitive Defensibility
A structural moat is the only reliable shield protecting long-term profits from relentless competitive erosion in industrial machinery sectors:
Xylem Inc.: Intangible Assets and Service Network Moat
Xylem’s moat stems from its broad brand portfolio and integrated water solutions. Its stable margins reflect pricing power. Yet, declining ROIC warns of emerging value destruction by 2026.
IDEX Corporation: Cost Advantage and Diverse Applied Solutions
IDEX leverages efficient capital use and a diversified product mix to sustain higher margins than Xylem. However, shrinking ROIC signals weakening competitive leverage despite superior profitability.
Verdict: Intangible Assets vs. Cost Leadership in Industrial Machinery
Xylem’s intangible asset base offers deeper, though fragile, moat qualities than IDEX’s cost advantage. Yet, both show declining returns, leaving Xylem better poised to defend market share through innovation and service breadth.
Which stock offers better returns?
The past year reveals contrasting dynamics: Xylem Inc. shows a mild overall decline with decelerating losses, while IDEX Corporation exhibits a sharper yearly drop offset by strong recent gains.
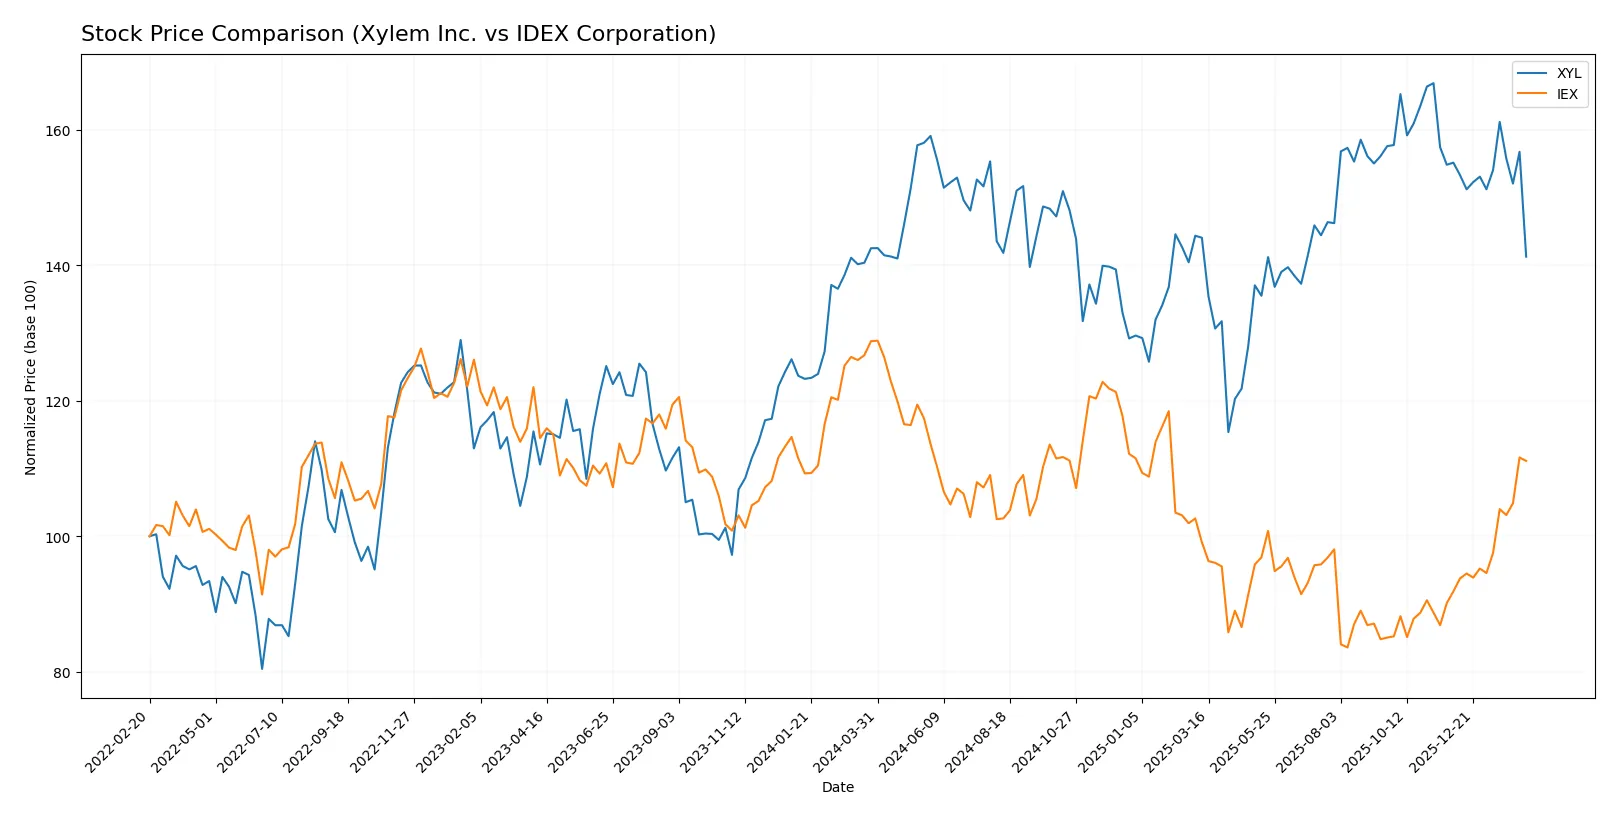
Trend Comparison
Xylem Inc.’s stock fell 0.87% over 12 months, marking a bearish trend with decelerating losses. Its price ranged between 104.6 and 151.31, showing moderate volatility (9.59 std dev).
IDEX Corporation declined 13.72% over the year, a bearish trend with accelerating losses. However, recent months reversed sharply, gaining 20.97%, amid higher volatility (22.27 std dev).
IDEX experienced a stronger overall decline but outperformed Xylem recently with a 20.97% rebound, delivering a superior market return in the latest period.
Target Prices
Analysts present a bullish consensus for both Xylem Inc. and IDEX Corporation.
| Company | Target Low | Target High | Consensus |
|---|---|---|---|
| Xylem Inc. | 138 | 176 | 162.67 |
| IDEX Corporation | 220 | 247 | 236.83 |
The consensus targets exceed current prices significantly, signaling analysts expect substantial upside from 128.09 for Xylem and 210.41 for IDEX. This suggests confidence in their industrial machinery market positioning.

Don’t Let Luck Decide Your Entry Point
Optimize your entry points with our advanced ProRealTime indicators. You’ll get efficient buy signals with precise price targets for maximum performance. Start outperforming now!
How do institutions grade them?
Here is a summary of recent institutional grades for Xylem Inc. and IDEX Corporation:
Xylem Inc. Grades
This table shows the latest grades from key financial institutions for Xylem Inc.
| Grading Company | Action | New Grade | Date |
|---|---|---|---|
| Citigroup | Maintain | Buy | 2026-02-11 |
| Stifel | Maintain | Buy | 2026-02-11 |
| RBC Capital | Maintain | Outperform | 2026-02-11 |
| Barclays | Maintain | Overweight | 2026-02-11 |
| Barclays | Maintain | Overweight | 2026-01-07 |
| Mizuho | Maintain | Neutral | 2026-01-05 |
| TD Cowen | Maintain | Hold | 2025-12-05 |
| UBS | Maintain | Buy | 2025-11-06 |
| Stifel | Maintain | Buy | 2025-10-29 |
| RBC Capital | Maintain | Outperform | 2025-10-29 |
IDEX Corporation Grades
This table presents the recent grades from major financial firms for IDEX Corporation.
| Grading Company | Action | New Grade | Date |
|---|---|---|---|
| Argus Research | Upgrade | Buy | 2026-02-06 |
| RBC Capital | Maintain | Outperform | 2026-02-05 |
| Citigroup | Maintain | Buy | 2026-02-05 |
| DA Davidson | Maintain | Neutral | 2026-02-05 |
| TD Cowen | Maintain | Buy | 2026-02-05 |
| Stifel | Maintain | Buy | 2026-01-23 |
| Citigroup | Maintain | Buy | 2025-12-08 |
| RBC Capital | Maintain | Outperform | 2025-10-30 |
| Stifel | Maintain | Buy | 2025-10-20 |
| Oppenheimer | Maintain | Outperform | 2025-10-07 |
Which company has the best grades?
Both companies receive predominantly positive grades, but IDEX Corporation shows a recent upgrade and more consistent “Buy” and “Outperform” ratings. This suggests stronger institutional confidence, potentially attracting more investor interest.
Risks specific to each company
The following categories identify the critical pressure points and systemic threats facing both firms in the 2026 market environment:
1. Market & Competition
Xylem Inc.
- Faces intense competition in water infrastructure and smart metering solutions globally, requiring continuous innovation.
IDEX Corporation
- Operates in diverse segments, facing competitive pressure in fluid technologies and safety equipment markets.
2. Capital Structure & Debt
Xylem Inc.
- Maintains very low leverage with debt/equity of 0.17 and strong interest coverage (42.17x), reflecting solid financial stability.
IDEX Corporation
- Holds moderate leverage (debt/equity 0.45) with lower interest coverage (10.82x), increasing risk under tightening credit conditions.
3. Stock Volatility
Xylem Inc.
- Beta of 1.16 suggests slightly higher volatility than the market, exposing investors to moderate price swings.
IDEX Corporation
- Beta near 1.0 indicates stock volatility closely aligns with the overall market, implying more predictable price behavior.
4. Regulatory & Legal
Xylem Inc.
- Subject to water industry regulations and environmental compliance across multiple jurisdictions, which may increase costs.
IDEX Corporation
- Faces regulatory scrutiny in health, safety, and environmental sectors, especially in medical and fire safety products.
5. Supply Chain & Operations
Xylem Inc.
- Global supply chain complexities could disrupt production, especially for specialized water and wastewater equipment.
IDEX Corporation
- Relies on diverse suppliers for precision components; supply disruptions could impair manufacturing and delivery timelines.
6. ESG & Climate Transition
Xylem Inc.
- Strong focus on sustainable water solutions positions it well but requires ongoing investment to meet evolving ESG standards.
IDEX Corporation
- ESG efforts span multiple industries with varying regulations, demanding flexible adaptation to climate-related risks.
7. Geopolitical Exposure
Xylem Inc.
- Operates internationally with exposure to trade policies and geopolitical tensions affecting global water infrastructure projects.
IDEX Corporation
- Less geographically diversified, with concentration in the U.S. and limited exposure to geopolitical volatility.
Which company shows a better risk-adjusted profile?
Xylem’s most impactful risk lies in market competition and operational complexity amid global supply chains. IDEX faces heightened financial risk due to its higher leverage and regulatory compliance across diverse sectors. IDEX’s stronger profitability and financial scores are offset by capital structure vulnerabilities. Xylem demonstrates a slightly better risk-adjusted profile supported by superior debt metrics and interest coverage. Recent data highlight IDEX’s rising debt-to-equity ratio (0.45) as a notable concern relative to Xylem’s conservative 0.17, indicating Xylem’s stronger balance sheet resilience under current market conditions.
Final Verdict: Which stock to choose?
Xylem Inc. (XYL) excels as a cash-generating powerhouse with solid operational efficiency and a disciplined balance sheet. Its main point of vigilance is the declining return on invested capital, signaling caution on its long-term value creation. XYL suits investors with an appetite for cyclical exposure in industrial growth portfolios.
IDEX Corporation (IEX) stands out with a strategic moat rooted in recurring revenue streams and operational resilience. It offers better financial stability and a safer liquidity profile than XYL. IEX fits well in Growth at a Reasonable Price (GARP) portfolios seeking steady income and moderate capital appreciation.
If you prioritize resilient cash flow and operational discipline, IEX is the compelling choice due to its stronger moat and financial safety. However, if you seek higher cyclicality with potential upside from efficiency gains, XYL offers an intriguing scenario despite its value creation challenges. Both require close monitoring of profitability trends amid evolving market conditions.
Disclaimer: Investment carries a risk of loss of initial capital. The past performance is not a reliable indicator of future results. Be sure to understand risks before making an investment decision.
Go Further
I encourage you to read the complete analyses of Xylem Inc. and IDEX Corporation to enhance your investment decisions: