Symbotic Inc. and IDEX Corporation are two prominent players in the industrial machinery sector, each driving innovation in automation and fluid-handling technologies. Symbotic focuses on robotics to optimize warehouse efficiency, while IDEX offers diverse applied solutions across multiple industries. Their overlapping market presence and distinct innovation strategies make them ideal candidates for comparison. In this article, I will help you identify which company presents the most compelling investment opportunity.
Table of contents
Companies Overview
I will begin the comparison between Symbotic Inc. and IDEX Corporation by providing an overview of these two companies and their main differences.
Symbotic Inc. Overview
Symbotic Inc. is an automation technology company focused on improving efficiency for retailers and wholesalers in the US. It provides The Symbotic System, a full-service warehouse automation solution designed to reduce costs, enhance operational efficiency, and optimize inventory management. The company operates within the industrial machinery sector and is headquartered in Wilmington, Massachusetts.
IDEX Corporation Overview
IDEX Corporation offers applied industrial solutions globally through three segments: Fluid & Metering Technologies, Health & Science Technologies, and Fire & Safety/Diversified Products. It designs and manufactures pumps, fluidics, medical devices, firefighting equipment, and precision instruments serving diverse markets including food, chemical, pharmaceutical, and defense. IDEX is based in Northbrook, Illinois, with a broad industrial machinery presence.
Key similarities and differences
Both companies operate in the industrial machinery sector and provide specialized equipment and technologies aimed at improving industrial processes. Symbotic focuses on warehouse automation primarily for retail and wholesale customers, while IDEX offers a diversified product portfolio across fluid handling, health sciences, and fire safety markets. Symbotic is younger with a smaller workforce and market cap compared to IDEX’s well-established global operations and broader industrial reach.
Income Statement Comparison
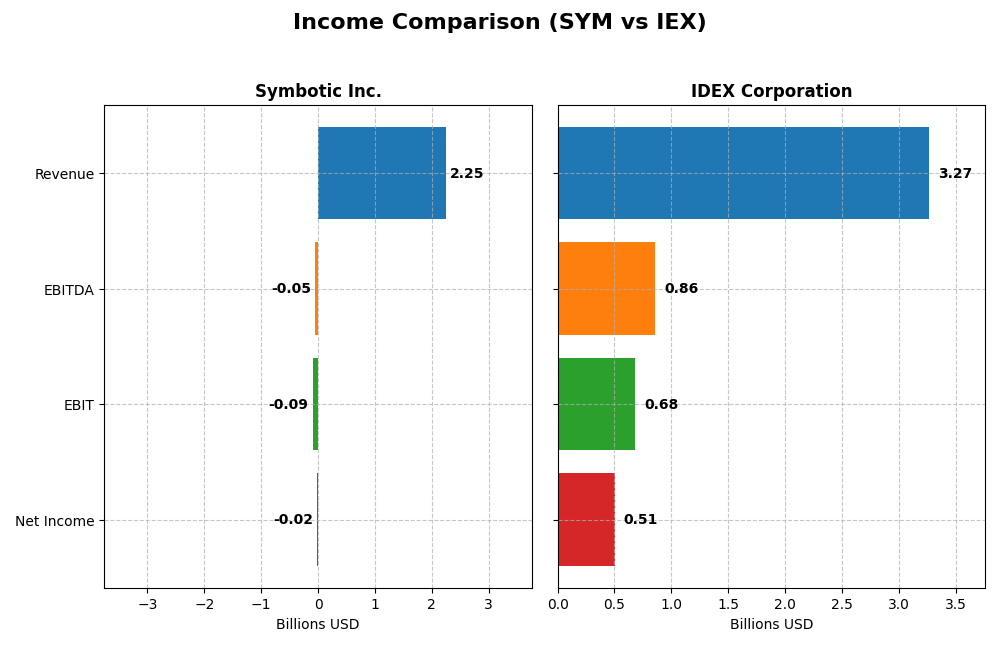
The table below compares the most recent full fiscal year income statement metrics for Symbotic Inc. and IDEX Corporation, providing a snapshot of their financial performance.
| Metric | Symbotic Inc. (SYM) | IDEX Corporation (IEX) |
|---|---|---|
| Market Cap | 42.8B | 13.9B |
| Revenue | 2.25B | 3.27B |
| EBITDA | -48.0M | 859.4M |
| EBIT | -92.1M | 683.8M |
| Net Income | -16.9M | 505.0M |
| EPS | -0.16 | 6.67 |
| Fiscal Year | 2025 | 2024 |
Income Statement Interpretations
Symbotic Inc.
Symbotic Inc. has experienced strong revenue growth from 2021 to 2025, rising from 251M to 2.25B, with net income losses narrowing from -122M to -17M. Gross margins remain neutral at 18.8%, while EBIT and net margins are unfavorable, reflecting ongoing operating losses. In 2025, revenue growth was favorable at 25.7%, but EBIT declined by 10.6%, indicating margin pressure despite top-line expansion.
IDEX Corporation
IDEX Corporation shows stable revenues around 3.3B with net income improving from 378M in 2020 to 505M in 2024. Margins are strong and favorable: gross margin at 46.4%, EBIT margin near 21%, and net margin at 15.5%. However, 2024 saw slight declines in revenue (-0.16%) and net margin (-15.1%), signaling some softness following steady growth over the prior years.
Which one has the stronger fundamentals?
IDEX Corporation exhibits stronger fundamentals with robust profitability margins and positive net income. Despite recent margin contractions, its earnings remain solid. Symbotic shows rapid revenue growth and improving net income but continues to report losses and weak EBIT margins. Overall, IDEX’s stable profitability contrasts with Symbotic’s ongoing operational challenges.
Financial Ratios Comparison
The table below presents a side-by-side comparison of key financial ratios for Symbotic Inc. (SYM) and IDEX Corporation (IEX) based on their most recent fiscal year data.
| Ratios | Symbotic Inc. (2025) | IDEX Corporation (2024) |
|---|---|---|
| ROE | -7.65% | 13.31% |
| ROIC | -16.63% | 8.81% |
| P/E | -335 | 31.37 |
| P/B | 25.60 | 4.18 |
| Current Ratio | 1.08 | 2.53 |
| Quick Ratio | 0.99 | 1.85 |
| D/E (Debt/Equity) | 0.14 | 0.52 |
| Debt-to-Assets | 1.32% | 29.45% |
| Interest Coverage | 0 | 15.66 |
| Asset Turnover | 0.94 | 0.48 |
| Fixed Asset Turnover | 15.92 | 7.10 |
| Payout Ratio | 0 | 40.65% |
| Dividend Yield | 0% | 1.30% |
Interpretation of the Ratios
Symbotic Inc.
Symbotic Inc. presents a mixed financial profile with a majority of unfavorable ratios, including negative net margin (-0.75%) and return on equity (-7.65%), indicating profitability challenges. The company shows a strong leverage position with favorable debt-to-equity (0.14) and debt-to-assets (1.32%) ratios but struggles with interest coverage at zero. Symbotic does not pay dividends, reflecting either reinvestment priorities or ongoing growth and profitability recovery efforts.
IDEX Corporation
IDEX Corporation exhibits generally favorable ratios, such as a solid net margin of 15.45% and a healthy current ratio of 2.53, supporting liquidity strength. The company’s return on equity (13.31%) and return on invested capital (8.81%) are neutral, while debt levels are manageable with a debt-to-assets ratio of 29.45%. IDEX pays dividends with a 1.3% yield, indicating steady shareholder returns supported by good interest coverage (15.37).
Which one has the best ratios?
IDEX Corporation shows a more favorable overall financial position with stronger profitability, liquidity, and dividend payment metrics compared to Symbotic Inc., which struggles with negative returns and no dividend payout. IDEX’s balanced leverage and coverage ratios further support its slightly favorable rating, while Symbotic’s profile remains slightly unfavorable due to persistent profitability and coverage concerns.
Strategic Positioning
This section compares the strategic positioning of Symbotic Inc. and IDEX Corporation, including their market position, key segments, and exposure to technological disruption:
Symbotic Inc.
- Market position and competitive pressure: Mid-cap automation tech firm with high beta, facing industrial machinery competition.
- Key segments and business drivers: Focus on warehouse automation systems, operation services, and software support.
- Exposure to technological disruption: Robotics-driven automation in retail and wholesale supply chains, reliant on tech advances.
IDEX Corporation
- Smaller market cap industrial machinery provider with stable beta, competing globally across segments.
- Diversified across Fluid & Metering, Health & Science, and Fire & Safety segments with broad applications.
- Applied solutions in fluidics, safety, and health sectors with less emphasis on robotics innovation.
Symbotic Inc. vs IDEX Corporation Positioning
Symbotic’s strategy is concentrated on warehouse automation and robotics technology, driving efficiency in retail and wholesale. IDEX pursues diversification with multiple industrial segments, spreading exposure across fluid technology, health science, and safety, which may offer broader market coverage but less tech specialization.
Which has the best competitive advantage?
Both companies exhibit declining ROIC trends and shed value relative to WACC, with Symbotic rated very unfavorable and IDEX slightly unfavorable in MOAT evaluation, indicating neither currently holds a strong sustainable competitive advantage.
Stock Comparison
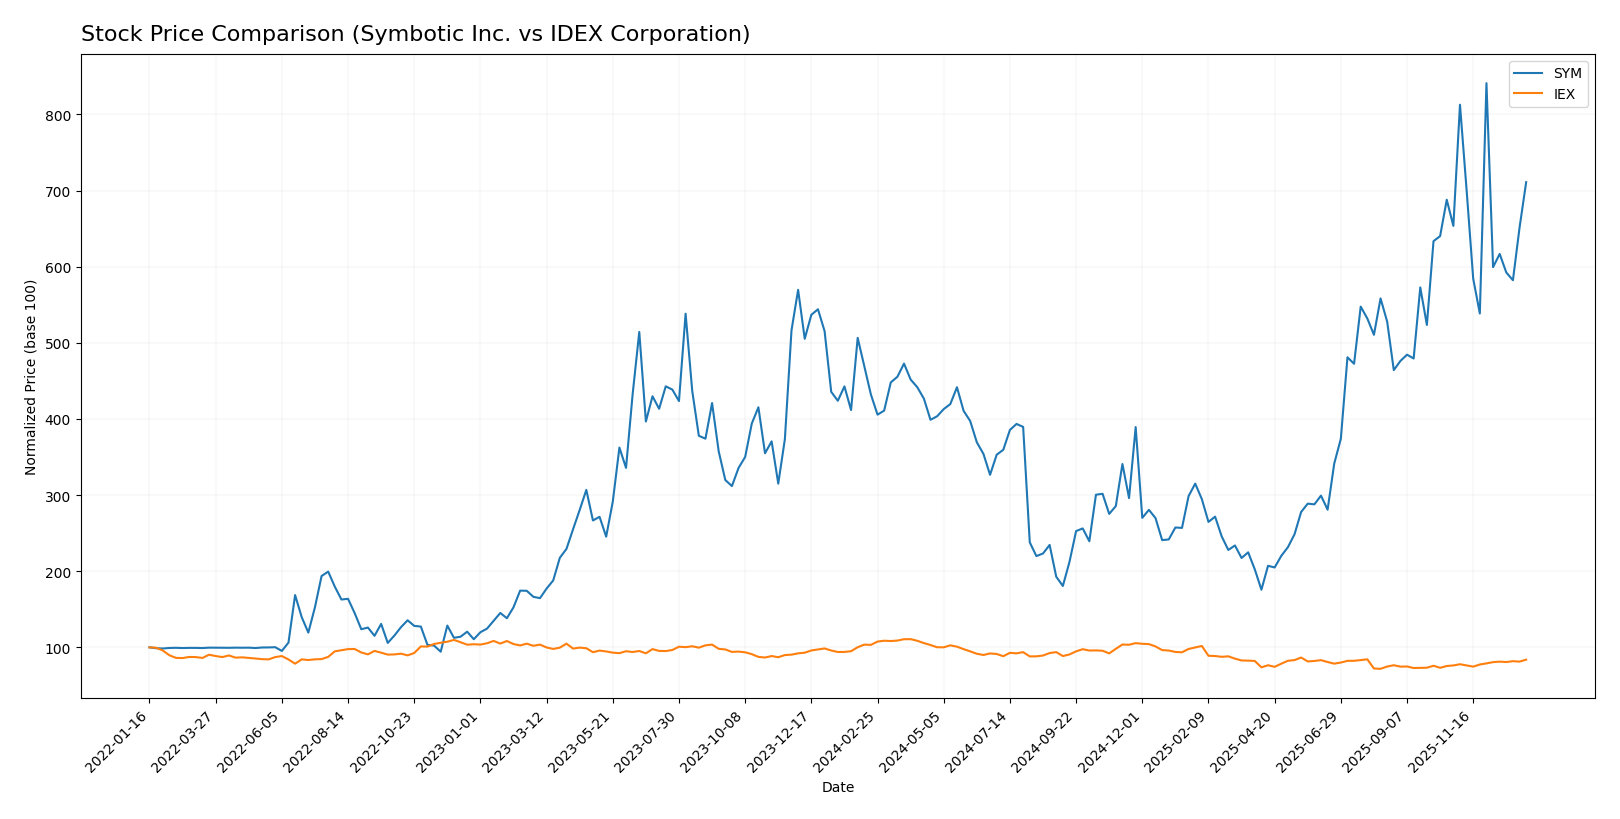
The stock price movements of Symbotic Inc. and IDEX Corporation over the past year reveal contrasting trends with significant shifts in market dynamics and trading volumes.
Trend Analysis
Symbotic Inc. (SYM) shows a strong bullish trend over the past 12 months with a 64.58% price increase, though momentum has decelerated. The stock experienced a low of 17.5 and a high of 83.77, with moderate volatility (std dev 15.15).
IDEX Corporation (IEX) displays a bearish trend over the same period with an 18.8% price decline, yet the downward trend has accelerated. The stock ranged from 158.26 to 244.02, showing higher volatility (std dev 24.02).
Comparing both, Symbotic Inc. delivered the highest market performance with a strong positive return, while IDEX’s overall trend remained negative despite recent gains.
Target Prices
Analysts present a moderately optimistic consensus for Symbotic Inc. and IDEX Corporation based on their current valuations.
| Company | Target High | Target Low | Consensus |
|---|---|---|---|
| Symbotic Inc. | 83 | 41 | 65.11 |
| IDEX Corporation | 210 | 180 | 194 |
Symbotic’s consensus target price of 65.11 is slightly below its current price of 70.82, suggesting cautious expectations. IDEX shows a higher consensus target of 194 versus a current price of 184.71, indicating moderate upside potential.
Analyst Opinions Comparison
This section compares analysts’ ratings and grades for Symbotic Inc. and IDEX Corporation:
Rating Comparison
SYM Rating
- Rating: C+ with a very favorable status.
- Discounted Cash Flow Score: 5, very favorable.
- ROE Score: 1, very unfavorable.
- ROA Score: 1, very unfavorable.
- Debt To Equity Score: 3, moderate.
- Overall Score: 2, moderate.
IEX Rating
- Rating: B+ with a very favorable status.
- Discounted Cash Flow Score: 4, favorable.
- ROE Score: 4, favorable.
- ROA Score: 4, favorable.
- Debt To Equity Score: 2, moderate.
- Overall Score: 3, moderate.
Which one is the best rated?
Based strictly on the provided data, IEX holds higher ratings overall, including a better letter grade and stronger financial scores in ROE, ROA, and discounted cash flow, compared to SYM’s weaker profitability metrics.
Scores Comparison
Here is a comparison of the Altman Z-Score and Piotroski Score for Symbotic Inc. and IDEX Corporation:
SYM Scores
- Altman Z-Score: 13.05, indicating a safe zone with very low bankruptcy risk.
- Piotroski Score: 3, categorized as very weak financial strength.
IEX Scores
- Altman Z-Score: 4.48, also in the safe zone, suggesting low bankruptcy risk.
- Piotroski Score: 7, indicating strong financial health.
Which company has the best scores?
Based strictly on the provided data, SYM has a much higher Altman Z-Score, indicating greater bankruptcy safety, while IEX scores better on the Piotroski scale, reflecting stronger overall financial health.
Grades Comparison
Here is a detailed comparison of the recent grades assigned to Symbotic Inc. and IDEX Corporation by reputable grading companies:
Symbotic Inc. Grades
The following table summarizes recent grades for Symbotic Inc. from established financial institutions:
| Grading Company | Action | New Grade | Date |
|---|---|---|---|
| Goldman Sachs | Downgrade | Sell | 2025-12-02 |
| Barclays | Maintain | Underweight | 2025-11-26 |
| Baird | Maintain | Neutral | 2025-11-26 |
| Craig-Hallum | Upgrade | Buy | 2025-11-25 |
| Northland Capital Markets | Maintain | Outperform | 2025-11-25 |
| Needham | Maintain | Buy | 2025-11-25 |
| Cantor Fitzgerald | Maintain | Overweight | 2025-11-25 |
| DA Davidson | Maintain | Neutral | 2025-11-25 |
| Citigroup | Maintain | Buy | 2025-11-25 |
| UBS | Downgrade | Sell | 2025-09-23 |
Symbotic Inc. shows a mixed set of grades with a slight bias towards positive ratings, though recent downgrades to Sell by Goldman Sachs and UBS indicate some caution.
IDEX Corporation Grades
Below is the summary of recent grades for IDEX Corporation by recognized grading firms:
| Grading Company | Action | New Grade | Date |
|---|---|---|---|
| Citigroup | Maintain | Buy | 2025-12-08 |
| RBC Capital | Maintain | Outperform | 2025-10-30 |
| Stifel | Maintain | Buy | 2025-10-20 |
| Oppenheimer | Maintain | Outperform | 2025-10-07 |
| DA Davidson | Maintain | Neutral | 2025-08-04 |
| Stifel | Maintain | Buy | 2025-07-31 |
| RBC Capital | Maintain | Outperform | 2025-07-31 |
| Oppenheimer | Maintain | Outperform | 2025-07-31 |
| Stifel | Maintain | Buy | 2025-07-21 |
| Citigroup | Maintain | Buy | 2025-07-14 |
IDEX Corporation’s grades demonstrate consistent positive recommendations, predominantly Buy and Outperform, with no recent downgrades.
Which company has the best grades?
IDEX Corporation generally holds better grades with consistent Buy and Outperform ratings, signaling steadier analyst confidence. Symbotic Inc. has more varied opinions, including recent Sell grades, indicating higher uncertainty for investors. This contrast may impact risk perceptions and portfolio decisions.
Strengths and Weaknesses
Below is a comparison of key strengths and weaknesses between Symbotic Inc. (SYM) and IDEX Corporation (IEX) based on the most recent financial and operational data.
| Criterion | Symbotic Inc. (SYM) | IDEX Corporation (IEX) |
|---|---|---|
| Diversification | Moderate: Focused on Systems (2.12B in 2025), with smaller segments in Operation Services and Software Maintenance | High: Three well-balanced segments with Health & Science (1.3B), Fluid & Metering (1.23B), and Fire & Safety (0.74B) in 2024 |
| Profitability | Unfavorable: Negative net margin (-0.75%), negative ROIC (-16.63%), and declining profitability | Favorable: Strong net margin (15.45%), positive ROIC (8.81%), though ROIC trend declining slightly |
| Innovation | Moderate: High fixed asset turnover (15.92) hints at operational efficiency but overall value destruction | Good: Steady investment in diversified technologies, favorable WACC (7.76%) supports innovation funding |
| Global presence | Limited data, primarily US-based with focused product lines | Broad diversified presence in several industrial technology markets globally |
| Market Share | Concentrated in robotics and automation systems, growing revenue but value destroying | Established market shares across multiple segments with steady revenue growth and better capital efficiency |
Key takeaways: IDEX Corporation demonstrates stronger profitability, diversification, and financial health, making it a more stable investment option. Symbotic, while growing revenue in automation systems, currently struggles with value destruction and negative returns, signaling higher risk for investors.
Risk Analysis
Below is a comparative table highlighting key risk factors for Symbotic Inc. (SYM) and IDEX Corporation (IEX) based on the most recent data from 2025 and 2024 respectively:
| Metric | Symbotic Inc. (SYM) | IDEX Corporation (IEX) |
|---|---|---|
| Market Risk | High beta (2.14) indicates higher volatility and market sensitivity | Beta near 1 (0.995), indicating average market risk |
| Debt level | Low debt-to-equity (0.14), low debt-to-assets (1.32%) – low leverage | Moderate debt-to-equity (0.52), moderate debt-to-assets (29.45%) |
| Regulatory Risk | Moderate, US industrial sector exposure, no specific recent issues | Moderate, diverse industrial segments with global exposure |
| Operational Risk | Automation tech reliance; negative profitability ratios suggest operational challenges | Diversified product lines; stable profitability with positive margins |
| Environmental Risk | Typical industrial machinery sector risks; no major disclosed concerns | Similar sector risks; no significant recent environmental issues reported |
| Geopolitical Risk | US-based, limited global exposure reduces geopolitical risk | Global operations increase exposure to geopolitical uncertainties |
Symbotic faces the most impactful risks from high market volatility and operational inefficiencies, reflected in negative profitability and weak returns despite low leverage. IDEX, while exposed to moderate leverage and global geopolitical risks, benefits from stable profitability and stronger financial health, making its risks more manageable currently.
Which Stock to Choose?
Symbotic Inc. (SYM) shows a favorable income statement with strong revenue growth of 25.65% in the last year and an overall increase of 792% over five years, but it suffers from unfavorable profitability ratios including negative net margin (-0.75%) and ROE (-7.65%). Its debt levels are low and favorable, but overall financial ratios are slightly unfavorable, and the company’s rating is moderate with a C+.
IDEX Corporation (IEX) presents a favorable income statement with a solid net margin of 15.45% and decent profitability measures, though recent revenue and profit growth are slightly negative. Financial ratios are slightly favorable overall, with good liquidity and moderate debt, and the company holds a better rating of B+ with strong Altman Z-Score and Piotroski score.
Investors favoring growth and high revenue expansion might find Symbotic’s rapid income growth appealing despite weak profitability and financial ratios. Conversely, those prioritizing stability and balanced profitability may view IDEX’s solid margins, favorable ratios, and stronger rating as more suitable. Each profile could interpret the data differently based on risk tolerance and investment strategy.
Disclaimer: Investment carries a risk of loss of initial capital. The past performance is not a reliable indicator of future results. Be sure to understand risks before making an investment decision.
Go Further
I encourage you to read the complete analyses of Symbotic Inc. and IDEX Corporation to enhance your investment decisions: