Home > Comparison > Industrials > ROP vs IEX
The strategic rivalry between Roper Technologies, Inc. and IDEX Corporation shapes the Industrials sector’s machinery landscape. Roper operates as a diversified technology-driven solutions provider, blending software and engineered products. In contrast, IDEX focuses on specialized fluid and metering technologies across varied industrial applications. This analysis pits Roper’s innovation breadth against IDEX’s niche expertise to identify which trajectory delivers superior risk-adjusted returns for a balanced portfolio.
Table of contents
Companies Overview
Roper Technologies and IDEX Corporation stand as influential players in the industrial machinery sector.
Roper Technologies, Inc.: Diverse Industrial Software & Engineering Leader
Roper Technologies dominates with a broad product portfolio spanning software and engineered solutions. Its core revenue comes from cloud-based software in financial, insurance, healthcare, and supply chain management sectors. In 2026, Roper sharpens its focus on expanding cloud analytics and automation software, reinforcing its competitive edge in industrial digital transformation.
IDEX Corporation: Precision Fluidics and Safety Equipment Specialist
IDEX Corporation excels in fluid handling and safety technologies with three key segments: Fluid & Metering Technologies, Health & Science Technologies, and Fire & Safety/Diversified Products. Its revenue engine centers on designing and distributing precision pumps, valves, and rescue tools. In 2026, IDEX prioritizes innovation in biocompatible medical devices and firefighting equipment, targeting niche industrial and safety markets.
Strategic Collision: Similarities & Divergences
Both companies operate in industrial machinery but diverge sharply in approach. Roper pursues a software-driven, data-centric model, while IDEX emphasizes specialized hardware and fluid systems. Their primary battleground lies in industrial process efficiency and safety solutions. Roper offers a digital moat, whereas IDEX leans on precision engineering, shaping distinctly different investment profiles.
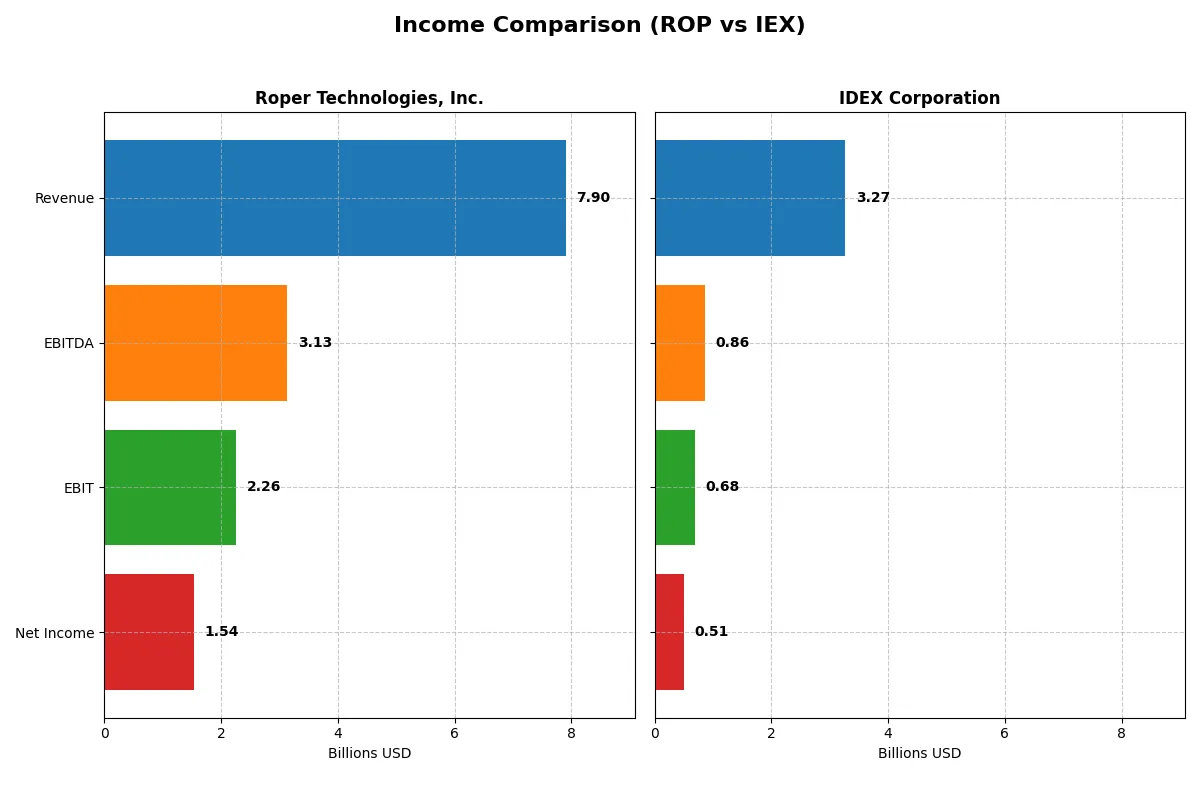
Income Statement Comparison
This data dissects the core profitability and scalability of both corporate engines to reveal who dominates the bottom line:
| Metric | Roper Technologies, Inc. (ROP) | IDEX Corporation (IEX) |
|---|---|---|
| Revenue | 7.9B | 3.27B |
| Cost of Revenue | 2.43B | 1.75B |
| Operating Expenses | 3.24B | 820M |
| Gross Profit | 5.47B | 1.52B |
| EBITDA | 3.13B | 859M |
| EBIT | 2.26B | 684M |
| Interest Expense | 325M | 45M |
| Net Income | 1.54B | 505M |
| EPS | 14.31 | 6.67 |
| Fiscal Year | 2025 | 2024 |
Income Statement Analysis: The Bottom-Line Duel
This income statement comparison reveals which company operates more efficiently and delivers stronger profitability under current market conditions.
Roper Technologies, Inc. Analysis
Roper’s revenue rose steadily to $7.9B in 2025, up 12.3% from 2024, with net income slightly declining to $1.54B. The company sustains a robust gross margin of 69.2% and a net margin near 19.4%, showcasing efficient cost control despite a minor dip in net margin growth. Its EBIT margin remains healthy at 28.6%, signaling strong operational leverage and momentum.
IDEX Corporation Analysis
IDEX’s revenue held steady at roughly $3.27B in 2024 but contracted 0.16% year-over-year, with net income decreasing 15% to $505M. Gross margin stands at 46.4%, lower than Roper’s, while net margin is a respectable 15.5%. EBIT margin slipped to 20.9%, reflecting margin pressure and diluted profitability growth, though the company maintains solid expense discipline amid slight revenue stagnation.
Margin Dominance vs. Revenue Scale
Roper outpaces IDEX in both revenue growth and margin strength, delivering nearly double the net income with superior operational efficiency. While IDEX shows resilience in expense management, its declining margins and earnings momentum lag behind Roper’s consistently favorable financial performance. Investors seeking scale combined with robust profitability will likely find Roper’s profile more compelling.
Financial Ratios Comparison
These vital ratios act as a diagnostic tool to expose the underlying fiscal health, valuation premiums, and capital efficiency of the companies compared below:
| Ratios | Roper Technologies, Inc. (ROP) | IDEX Corporation (IEX) |
|---|---|---|
| ROE | 8.2% | 13.3% |
| ROIC | 5.5% | 8.8% |
| P/E | 35.9 | 31.4 |
| P/B | 2.95 | 4.18 |
| Current Ratio | 0.40 | 2.53 |
| Quick Ratio | 0.37 | 1.85 |
| D/E | 0.41 | 0.52 |
| Debt-to-Assets | 24.5% | 29.4% |
| Interest Coverage | 7.7 | 15.7 |
| Asset Turnover | 0.22 | 0.48 |
| Fixed Asset Turnover | 47.0 | 7.1 |
| Payout ratio | 20.8% | 40.7% |
| Dividend yield | 0.58% | 1.30% |
| Fiscal Year | 2024 | 2024 |
Efficiency & Valuation Duel: The Vital Signs
Financial ratios act as a company’s DNA, exposing operational strengths and hidden risks critical for investment decisions.
Roper Technologies, Inc.
Roper shows a solid net margin at 19.44%, signaling operational strength, yet ROE and ROIC remain at zero, indicating weak capital efficiency. The stock trades at a high P/E of 31.06, suggesting it is expensive. Dividends yield 0.74%, hinting at modest shareholder returns amid reinvestment challenges.
IDEX Corporation
IDEX posts a respectable 15.45% net margin and a neutral ROE of 13.31%, reflecting balanced profitability. Its P/E of 31.37 is similarly stretched, but favorable liquidity ratios and stronger interest coverage support financial stability. A 1.3% dividend yield complements steady returns with ongoing growth investments.
Premium Valuation vs. Operational Safety
IDEX offers a better balance of risk and reward with healthier capital returns and liquidity. Roper’s high margin contrasts with weak efficiency metrics. Investors favoring stability and income may prefer IDEX’s profile, while risk-tolerant investors might weigh Roper’s operational upside.
Which one offers the Superior Shareholder Reward?
IEx offers a higher dividend yield at 1.30% versus Roper’s 0.74%. IEx’s payout ratio stands at 40.7%, reflecting a more generous cash return to shareholders but with tighter free cash flow coverage around 0.90. Roper maintains a disciplined payout ratio near 21%, supported by a robust free cash flow per share of $23.3 and a strong dividend coverage ratio above 6x, signaling sustainability. Both companies pursue share buybacks, yet Roper’s buyback intensity complements its conservative dividend, emphasizing capital allocation efficiency. I see Roper’s balanced distribution mix as more sustainable, offering superior long-term total return potential despite IEx’s attractive yield. In 2026, I favor Roper Technologies for disciplined, durable shareholder rewards.
Comparative Score Analysis: The Strategic Profile
The radar chart reveals the fundamental DNA and trade-offs of Roper Technologies and IDEX Corporation, highlighting their financial strengths and vulnerabilities:
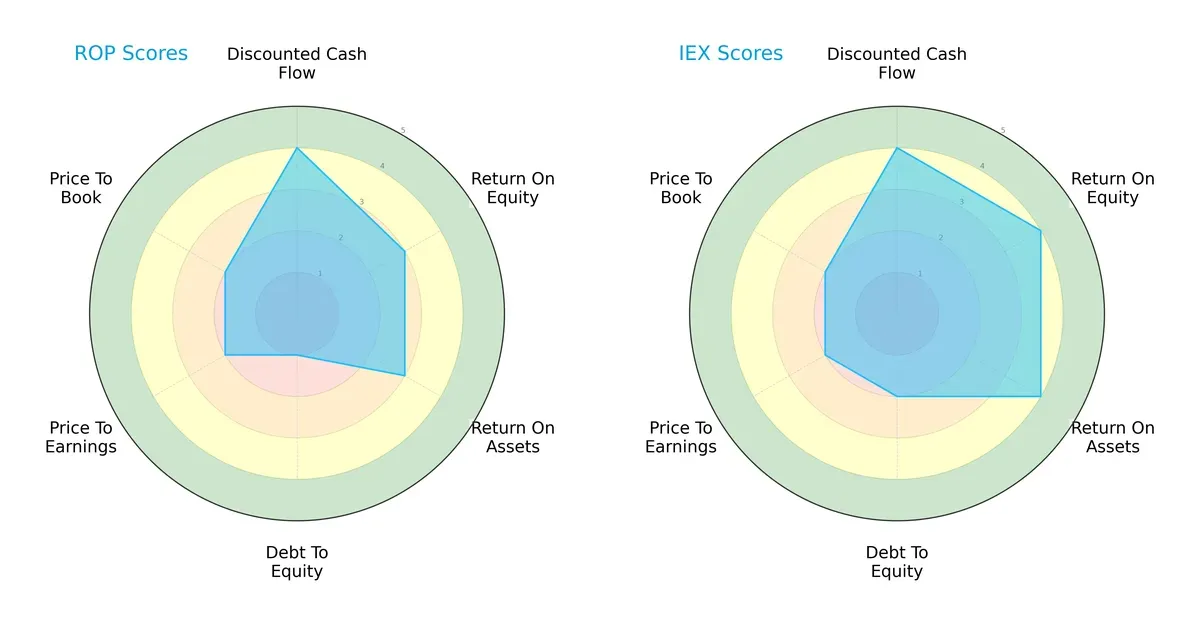
IEX holds a more balanced profile with favorable ROE and ROA scores (4 each), indicating superior profitability and asset efficiency. Roper has moderate returns (3 each) but suffers from a very unfavorable debt-to-equity score (1), signaling higher financial risk. Both firms share similar DCF (4) and valuation scores (PE and PB at 2), but IEX’s stronger operational metrics give it a clear edge in sustainable value creation.
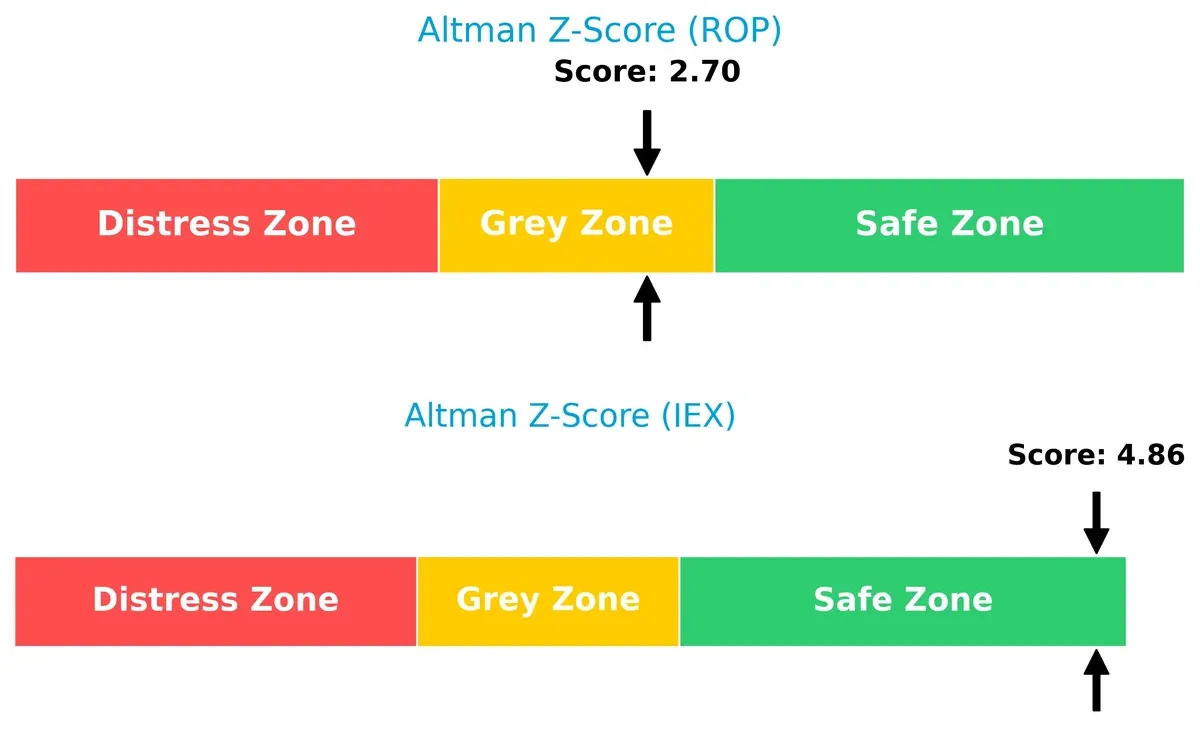
Bankruptcy Risk: Solvency Showdown
The Altman Z-Score delta shows IDEX at 4.86 (safe zone) versus Roper at 2.70 (grey zone), indicating IDEX’s stronger solvency and lower bankruptcy risk in this cycle:
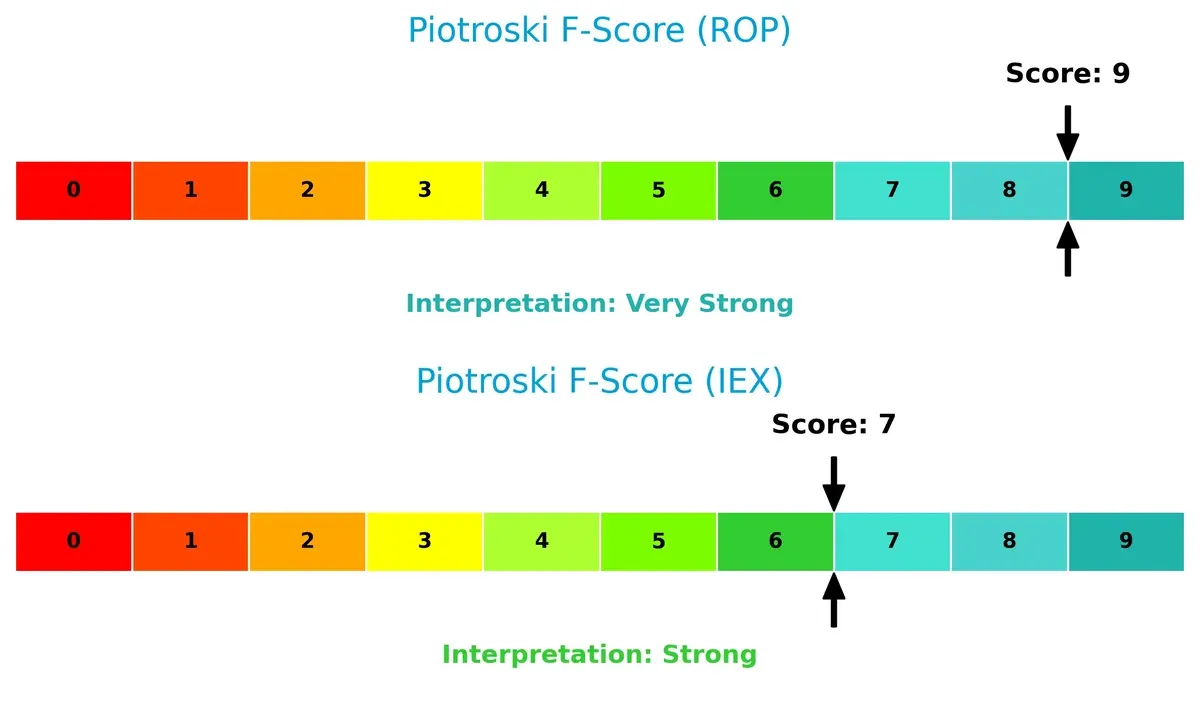
Financial Health: Quality of Operations
Roper scores a perfect 9 on the Piotroski F-Score, signaling peak financial health and operational quality. IDEX’s 7 remains strong but hints at some internal metrics that merit attention:
How are the two companies positioned?
This section dissects the operational DNA of ROP and IEX by comparing their revenue distribution and internal dynamics. The final objective is to confront their economic moats to identify which model delivers the most resilient competitive advantage today.
Revenue Segmentation: The Strategic Mix
This visual comparison dissects how Roper Technologies and IDEX Corporation diversify their income streams and where their primary sector bets lie:
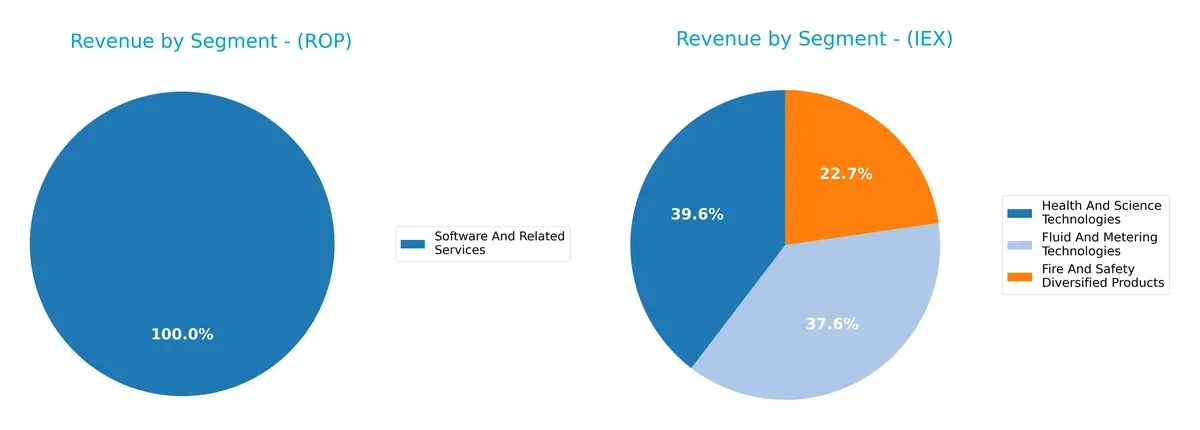
Roper Technologies pivots heavily on Software and Related Services, with $10.7B in 2024, dwarfing its other segments. IDEX Corporation shows a balanced mix, anchoring revenue across Health and Science Technologies ($1.3B), Fluid and Metering Technologies ($1.2B), and Fire and Safety Products ($744M). Roper’s concentration suggests ecosystem lock-in but raises concentration risk. IDEX’s diversified base supports resilience and cross-sector stability.
Strengths and Weaknesses Comparison
This table compares the strengths and weaknesses of Roper Technologies, Inc. (ROP) and IDEX Corporation (IEX):
ROP Strengths
- High net margin at 19.44%
- Low debt to assets ratio
- Strong interest coverage at 6.96x
- Diverse product segments including software and technology products
- Significant U.S. revenue base at $6.06B
IEX Strengths
- Favorable net margin at 15.45%
- ROE and ROIC near or above WACC, indicating efficient capital use
- Strong liquidity with current ratio 2.53 and quick ratio 1.85
- Balanced revenue across health, safety, and fluid technologies
- Solid global presence with diversified geographic revenue
ROP Weaknesses
- Unfavorable ROE and ROIC at 0%
- Poor liquidity ratios, current and quick ratios at 0
- Unavailable WACC complicates capital efficiency analysis
- Elevated P/E at 31.06, possibly overvalued
- Low dividend yield at 0.74%
- Asset turnover metrics unfavorable, signaling lower operational efficiency
IEX Weaknesses
- High P/E at 31.37 and elevated PB ratio at 4.18 indicate expensive valuation
- Moderate debt to equity at 0.52, adding leverage risk
- Asset turnover below 1, though fixed asset turnover favorable
- Dividend yield neutral at 1.3%
- Some exposure to valuation risk in financial ratios
ROP’s strengths lie in profitability and conservative leverage but suffer from weak liquidity and capital efficiency. IEX shows balanced profitability with stronger liquidity and global diversification but faces valuation concerns. These contrasts imply differing strategic focuses: ROP emphasizes margin and leverage control, while IEX balances growth with liquidity and geographic spread.
The Moat Duel: Analyzing Competitive Defensibility
A structural moat is the only true shield protecting long-term profits from increasing competitive pressures and market erosion:
Roper Technologies, Inc.: Intangible Assets & Diversified Solutions Moat
Roper’s moat stems from its broad portfolio of specialized software and engineered products, reflected in robust gross margins near 69%. Though ROIC data is unavailable, its diversified tech solutions stabilize margins. Expansion into cloud analytics and healthcare software could deepen this moat in 2026.
IDEX Corporation: Niche Engineering & Precision Manufacturing Moat
IDEX’s moat lies in precision fluidics and engineered pump systems serving specialized markets. Despite a declining ROIC and slight value destruction, its stable 46% gross margin shows resilient operational strength. New health and safety tech innovations may revitalize growth prospects in 2026.
Moat Strength: Diversification vs. Specialization in Industrial Machinery
Roper’s intangible asset-driven moat appears wider due to its diversified software and tech footprint. IDEX’s niche specialization is strong but shows signs of profitability pressure. Roper is better positioned to defend market share amid evolving industrial technology demands.
Which stock offers better returns?
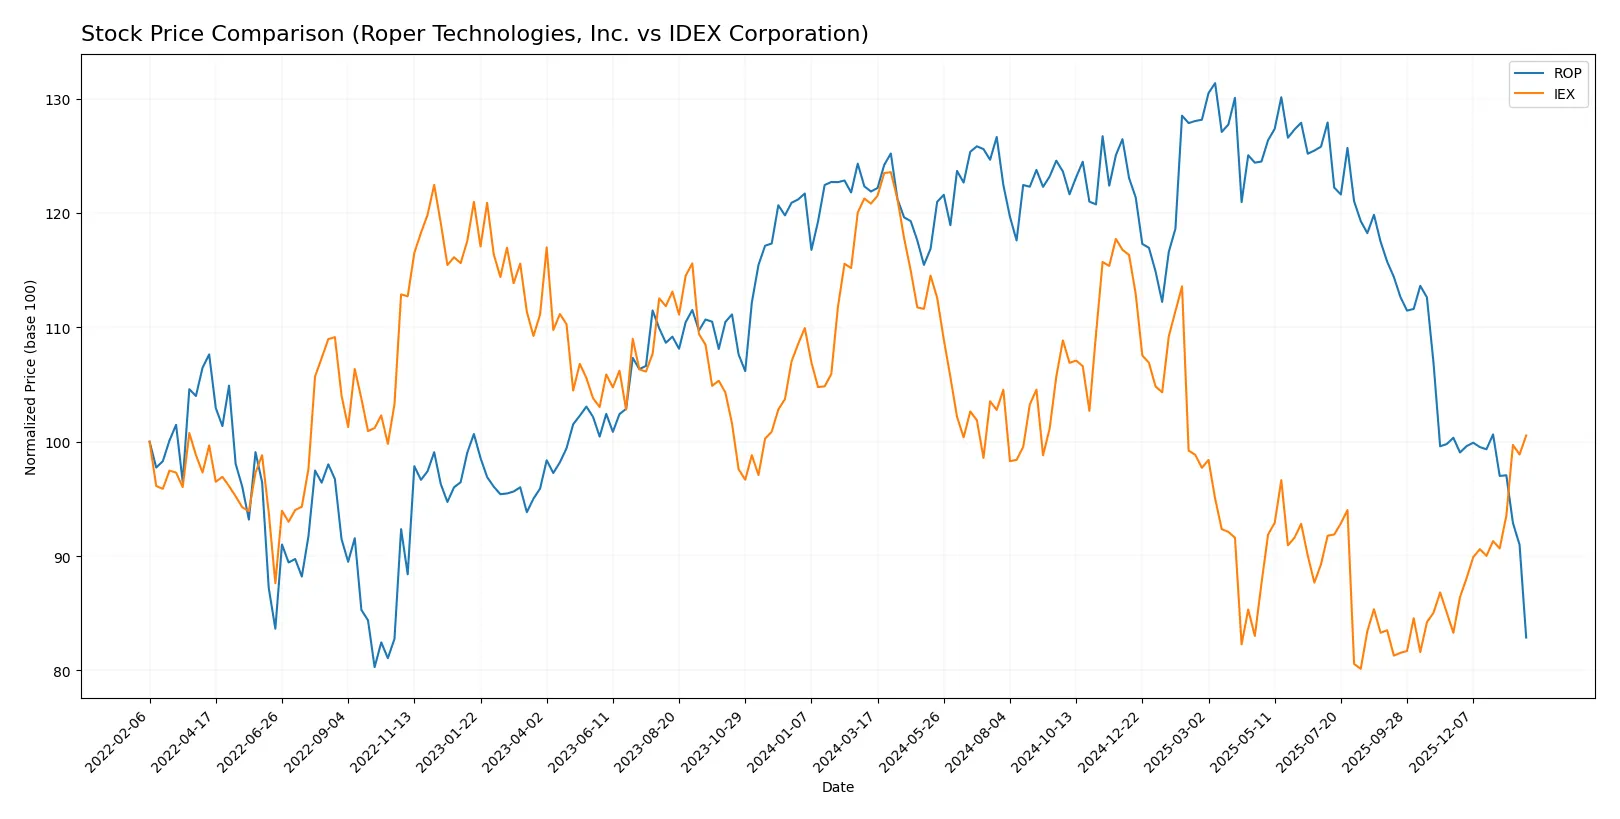
The past year saw divergent price dynamics: Roper Technologies, Inc. suffered a sharp decline, while IDEX Corporation showed a late-stage recovery with positive momentum.
Trend Comparison
Roper Technologies, Inc. declined 32% over the past year, marking a bearish trend with decelerating losses and high volatility, hitting a high of 588.38 and a low of 371.23.
IDEX Corporation fell 16.78% over the year, also bearish, but recent acceleration pushed a 20.71% gain since November 2025, indicating improving price momentum and lower volatility.
Comparing both, IDEX outperformed Roper with a smaller annual loss and strong recent gains, delivering the highest market performance over the analyzed period.
Target Prices
Analysts present a confident target price range reflecting solid upside potential for both companies.
| Company | Target Low | Target High | Consensus |
|---|---|---|---|
| Roper Technologies, Inc. | 365 | 575 | 475.5 |
| IDEX Corporation | 180 | 220 | 205.25 |
The consensus targets exceed current prices by 28% for Roper and 3% for IDEX, signaling stronger growth expectations for Roper.

Don’t Let Luck Decide Your Entry Point
Optimize your entry points with our advanced ProRealTime indicators. You’ll get efficient buy signals with precise price targets for maximum performance. Start outperforming now!
How do institutions grade them?
The following tables summarize recent institutional grades for Roper Technologies, Inc. and IDEX Corporation:
Roper Technologies, Inc. Grades
The table below shows Roper Technologies’ latest ratings from major financial institutions.
| Grading Company | Action | New Grade | Date |
|---|---|---|---|
| Goldman Sachs | Maintain | Neutral | 2026-01-29 |
| Argus Research | Downgrade | Hold | 2026-01-28 |
| Truist Securities | Maintain | Buy | 2026-01-28 |
| Mizuho | Maintain | Underperform | 2026-01-28 |
| Oppenheimer | Downgrade | Perform | 2026-01-28 |
| RBC Capital | Maintain | Sector Perform | 2026-01-28 |
| Barclays | Maintain | Underweight | 2026-01-28 |
| Stifel | Downgrade | Hold | 2026-01-28 |
| Citigroup | Maintain | Buy | 2026-01-28 |
| JP Morgan | Maintain | Underweight | 2026-01-28 |
IDEX Corporation Grades
Below are IDEX Corporation’s recent ratings from well-known grading firms.
| Grading Company | Action | New Grade | Date |
|---|---|---|---|
| Stifel | Maintain | Buy | 2026-01-23 |
| Citigroup | Maintain | Buy | 2025-12-08 |
| RBC Capital | Maintain | Outperform | 2025-10-30 |
| Stifel | Maintain | Buy | 2025-10-20 |
| Oppenheimer | Maintain | Outperform | 2025-10-07 |
| DA Davidson | Maintain | Neutral | 2025-08-04 |
| Oppenheimer | Maintain | Outperform | 2025-07-31 |
| RBC Capital | Maintain | Outperform | 2025-07-31 |
| Stifel | Maintain | Buy | 2025-07-31 |
| Stifel | Maintain | Buy | 2025-07-21 |
Which company has the best grades?
IDEX Corporation consistently receives Buy and Outperform ratings, reflecting strong institutional confidence. Roper Technologies shows mixed grades, including Neutral and Underperform, suggesting more cautious investor sentiment. This divergence may influence portfolio risk profiles and return expectations.
Risks specific to each company
The following categories identify the critical pressure points and systemic threats facing both firms in the 2026 market environment:
1. Market & Competition
Roper Technologies, Inc.
- Operates diverse software and engineered products, facing intense tech-driven competition in industrial machinery.
IDEX Corporation
- Specializes in fluid and metering technologies, health, and safety sectors, exposed to niche industrial competitors.
2. Capital Structure & Debt
Roper Technologies, Inc.
- Shows favorable debt-to-assets but very unfavorable debt-to-equity scores, indicating potential leverage risks.
IDEX Corporation
- Maintains moderate debt-to-equity with strong interest coverage, suggesting balanced financial risk management.
3. Stock Volatility
Roper Technologies, Inc.
- Beta of 0.942 indicates slightly lower volatility than the market, offering some downside protection.
IDEX Corporation
- Beta near 1 (0.995) implies volatility closely tracks the market, exposing investors to typical sector swings.
4. Regulatory & Legal
Roper Technologies, Inc.
- Diverse software and hardware products expose it to complex regulatory environments, especially data and safety compliance.
IDEX Corporation
- Operates in health and fire safety markets, facing strict regulatory scrutiny and product liability risks.
5. Supply Chain & Operations
Roper Technologies, Inc.
- Complex global operations require robust supply chain management; any disruption could sharply impact delivery and costs.
IDEX Corporation
- Focused product lines reduce operational complexity but remain vulnerable to raw material and component shortages.
6. ESG & Climate Transition
Roper Technologies, Inc.
- Industrial footprint and energy-intensive production require aggressive climate strategies to meet investor ESG expectations.
IDEX Corporation
- Product innovation in fire safety and fluid control aligns well with sustainable solutions but demands ongoing ESG investments.
7. Geopolitical Exposure
Roper Technologies, Inc.
- US-based but global sales expose it to trade tensions, tariffs, and currency fluctuations impacting margins.
IDEX Corporation
- Primarily US-focused with international sales; geopolitical risks moderate but present in supply chains and exports.
Which company shows a better risk-adjusted profile?
IDEX Corporation faces its most significant risk in market competition within specialized segments but manages capital prudently with strong liquidity and debt metrics. Roper Technologies’ critical risk is its capital structure, showing potential leverage strain despite a broad product portfolio. IDEX’s Altman Z-Score places it firmly in the safe zone, while Roper remains in the grey zone, reflecting moderate financial distress risk. IDEX’s superior liquidity ratios and interest coverage illustrate a stronger risk-adjusted profile in today’s volatile industrial machinery market.
Final Verdict: Which stock to choose?
Roper Technologies stands out as a cash flow powerhouse with a solid gross margin and consistent revenue growth. Its point of vigilance is a stretched balance sheet and a very low current ratio, which could pressure liquidity. It might suit aggressive growth portfolios willing to navigate these risks for upside potential.
IDEX Corporation’s strategic moat lies in its balanced capital structure and robust liquidity, reflected in strong interest coverage and current ratios. It offers better stability and a cleaner financial profile than Roper, making it appealing for GARP investors seeking steady growth with reasonable risk.
If you prioritize cash generation and are comfortable with higher leverage, Roper Technologies could be the compelling choice due to its operational efficiency and growth trajectory. However, if you seek better financial stability and a moat supported by prudent capital management, IDEX offers a safer profile with a slightly favorable outlook.
Disclaimer: Investment carries a risk of loss of initial capital. The past performance is not a reliable indicator of future results. Be sure to understand risks before making an investment decision.
Go Further
I encourage you to read the complete analyses of Roper Technologies, Inc. and IDEX Corporation to enhance your investment decisions: