In the competitive world of industrial machinery, Rockwell Automation, Inc. (ROK) and IDEX Corporation (IEX) stand out as leaders driving innovation and efficiency. Both companies operate in complementary segments, focusing on advanced automation and fluid handling technologies that serve diverse industrial markets. This comparison explores their strategic positioning and growth potential to help you decide which company offers the most compelling investment opportunity in 2026.
Table of contents
Companies Overview
I will begin the comparison between Rockwell Automation and IDEX Corporation by providing an overview of these two companies and their main differences.
Rockwell Automation Overview
Rockwell Automation, Inc. specializes in industrial automation and digital transformation solutions, operating globally with a focus on intelligent devices, software, and lifecycle services. Founded in 1903 and headquartered in Milwaukee, Wisconsin, Rockwell serves diverse industries including automotive, semiconductor, and renewable energy. The company combines hardware, software, and professional services to optimize industrial processes and improve operational efficiency.
IDEX Corporation Overview
IDEX Corporation delivers applied solutions worldwide through three main segments: Fluid & Metering Technologies, Health & Science Technologies, and Fire & Safety/Diversified Products. Headquartered in Northbrook, Illinois, and founded in 1987, IDEX serves markets such as food, pharmaceutical, chemical, and fire rescue. The company designs and manufactures pumps, precision fluidics, medical devices, and firefighting equipment, emphasizing innovation across varied industrial and scientific applications.
Key similarities and differences
Both Rockwell Automation and IDEX operate in the industrial machinery sector, providing engineered solutions that enhance industrial and commercial operations. Rockwell focuses heavily on automation and digital transformation, integrating software and lifecycle services, while IDEX emphasizes fluid handling, health sciences, and fire safety products. Rockwell is significantly larger with 27,000 employees compared to IDEX’s 9,000, reflecting differences in scale and market reach despite overlapping industrial applications.
Income Statement Comparison
The table below presents a factual comparison of key income statement metrics for Rockwell Automation, Inc. and IDEX Corporation based on their most recent fiscal year data.
| Metric | Rockwell Automation, Inc. | IDEX Corporation |
|---|---|---|
| Market Cap | 46.1B | 13.9B |
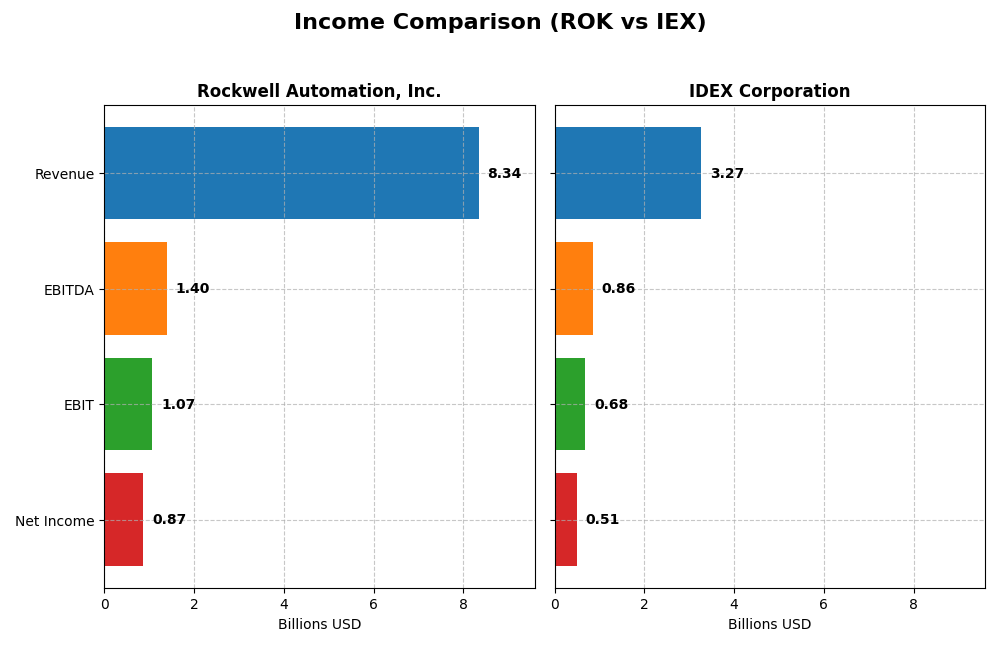
| Revenue | 8.34B | 3.27B |
| EBITDA | 1.40B | 859M |
| EBIT | 1.07B | 684M |
| Net Income | 869M | 505M |
| EPS | 7.69 | 6.67 |
| Fiscal Year | 2025 | 2024 |
Income Statement Interpretations
Rockwell Automation, Inc.
Rockwell Automation’s revenue showed a modest increase of 0.97% in 2025, reaching $8.34B, while net income declined to $869M, reflecting a 9.64% contraction in net margin to 10.42%. Gross margin improved to 48.14%, yet EBIT margin fell to 12.86%, indicating margin pressure. The latest year saw slower revenue growth and reduced profitability despite favorable gross margin trends.
IDEX Corporation
IDEX’s revenue slightly decreased by 0.16% to $3.27B in 2024, with net income dropping 15.15% to $505M, lowering net margin to 15.45%. Gross margin contracted to 46.4%, and EBIT margin was a strong 20.92%. Despite a slight revenue dip, the company maintained solid margins, although net income and EPS faced notable declines compared to prior years.
Which one has the stronger fundamentals?
IDEX exhibits stronger fundamentals with a higher net margin (15.45% vs. 10.42%) and EBIT margin (20.92% vs. 12.86%), alongside favorable overall income growth, including a 33.67% net income increase over five years. Rockwell Automation’s margins are weaker, with net income and EPS declining significantly over the period, suggesting more challenges in sustaining profitability.
Financial Ratios Comparison
The table below presents a side-by-side comparison of key financial ratios for Rockwell Automation, Inc. (ROK) and IDEX Corporation (IEX) based on their most recent fiscal year data for 2025 and 2024 respectively.
| Ratios | Rockwell Automation, Inc. (2025) | IDEX Corporation (2024) |
|---|---|---|
| ROE | 23.78% | 13.31% |
| ROIC | 13.71% | 8.81% |
| P/E | 45.33 | 31.37 |
| P/B | 10.78 | 4.18 |
| Current Ratio | 1.14 | 2.53 |
| Quick Ratio | 0.77 | 1.85 |
| D/E (Debt-to-Equity) | 1.00 | 0.52 |
| Debt-to-Assets | 32.51% | 29.45% |
| Interest Coverage | 9.12 | 15.66 |
| Asset Turnover | 0.74 | 0.48 |
| Fixed Asset Turnover | 6.95 | 7.10 |
| Payout ratio | 68.01% | 40.65% |
| Dividend yield | 1.50% | 1.30% |
Interpretation of the Ratios
Rockwell Automation, Inc.
Rockwell Automation shows a mix of favorable and unfavorable ratios with strengths in net margin (10.42%), ROE (23.78%), ROIC (13.71%), and interest coverage (6.88), indicating good profitability and debt servicing capacity. However, high PE (45.33) and PB (10.78) ratios raise valuation concerns, while liquidity ratios are mostly neutral to unfavorable. The company pays dividends with a 1.5% yield, reflecting moderate shareholder returns.
IDEX Corporation
IDEX Corporation has strong liquidity ratios with a current ratio of 2.53 and quick ratio of 1.85, and favorable interest coverage at 15.37, supporting financial stability. Net margin (15.45%) is robust, though ROE (13.31%) and ROIC (8.81%) are neutral. Valuation metrics are less favorable with PE at 31.37 and PB at 4.18. The dividend yield is 1.3%, indicating steady but modest distributions to shareholders.
Which one has the best ratios?
IDEX Corporation presents a higher proportion of favorable ratios (50%) compared to Rockwell’s 35.7%, driven by stronger liquidity and interest coverage. Rockwell offers higher profitability ratios but is weighed down by valuation and liquidity concerns. Both companies have slightly favorable global evaluations, making the choice dependent on investor priorities regarding valuation and financial stability.
Strategic Positioning
This section compares the strategic positioning of Rockwell Automation, Inc. and IDEX Corporation in terms of market position, key segments, and exposure to technological disruption:
Rockwell Automation, Inc.
- Leading industrial automation firm with strong competitive pressure in machinery sector.
- Diverse segments: Intelligent Devices, Software & Control, Lifecycle Services drive growth.
- Focus on digital transformation and industrial automation technologies.
IDEX Corporation
- Mid-sized industrial machinery player facing moderate competition.
- Three segments: Fluid & Metering, Health & Science, Fire & Safety products.
- Exposure through precision fluidics and engineered safety products.
Rockwell Automation, Inc. vs IDEX Corporation Positioning
Rockwell Automation exhibits a diversified industrial automation portfolio with extensive digital solutions, while IDEX focuses on specialized fluid and safety technologies. Rockwell’s broader segment spread offers varied revenue sources; IDEX’s narrower focus targets niche markets with specific applications.
Which has the best competitive advantage?
Rockwell Automation demonstrates a very favorable moat with growing ROIC exceeding WACC, indicating durable value creation. IDEX shows a slightly unfavorable moat, with declining ROIC below WACC, suggesting challenges in maintaining competitive profitability.
Stock Comparison
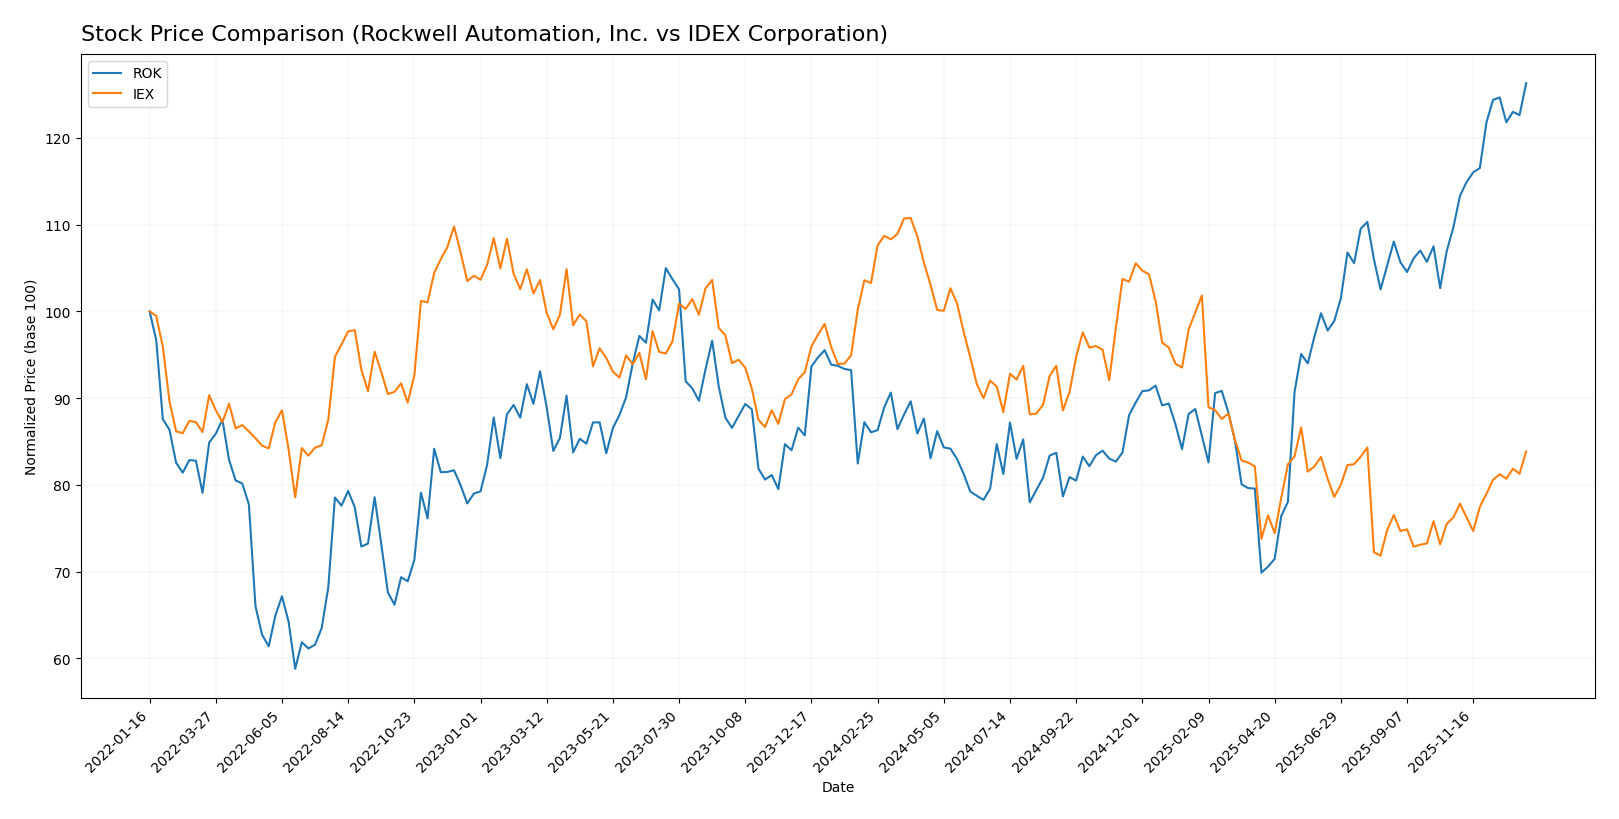
The past year revealed distinct trading dynamics and price movements between Rockwell Automation, Inc. (ROK) and IDEX Corporation (IEX), highlighting a robust upward trajectory for ROK alongside a notable decline for IEX.
Trend Analysis
Rockwell Automation, Inc. exhibited a strong bullish trend over the past 12 months with a 46.76% price increase, showing acceleration and substantial volatility with a 44.57 std deviation and a high at 410.53.
IDEX Corporation experienced a bearish trend over the same period with an 18.8% price decrease, also showing acceleration, moderate volatility at 24.02 std deviation, and a high price of 244.02 before declining.
Comparing both, Rockwell Automation outperformed IDEX significantly with a strong positive price change, while IDEX recorded a negative return despite recent modest gains.
Target Prices
Analysts present a clear target price consensus for Rockwell Automation, Inc. and IDEX Corporation.
| Company | Target High | Target Low | Consensus |
|---|---|---|---|
| Rockwell Automation, Inc. | 470 | 380 | 421.57 |
| IDEX Corporation | 210 | 180 | 194 |
For Rockwell Automation, the consensus target price of 421.57 USD is slightly above the current stock price of 410.53 USD, indicating moderate upside potential. IDEX Corporation’s consensus target of 194 USD also suggests a potential increase from the current price of 184.71 USD, reflecting generally positive analyst expectations.
Analyst Opinions Comparison
This section compares analysts’ ratings and grades for Rockwell Automation, Inc. (ROK) and IDEX Corporation (IEX):
Rating Comparison
ROK Rating
- Rating: B-, classified as Very Favorable by analysts.
- Discounted Cash Flow Score: Moderate at 3.
- ROE Score: Very Favorable with a top score of 5.
- ROA Score: Favorable at 4, showing efficient asset use.
- Debt To Equity Score: Very Unfavorable at 1, indicating high financial risk.
- Overall Score: Moderate at 3.
IEX Rating
- Rating: B+, also rated Very Favorable by analysts.
- Discounted Cash Flow Score: Favorable at 4.
- ROE Score: Favorable with a score of 4.
- ROA Score: Favorable at 4, equally efficient.
- Debt To Equity Score: Moderate at 2, indicating better balance sheet management.
- Overall Score: Moderate at 3.
Which one is the best rated?
IEX holds a higher rating grade (B+) compared to ROK’s B-, with stronger discounted cash flow and debt-to-equity scores. Both share equal overall scores, but IEX’s financial risk profile appears more favorable based on the provided data.
Scores Comparison
The following table compares the Altman Z-Score and Piotroski Score of Rockwell Automation, Inc. and IDEX Corporation:
ROK Scores
- Altman Z-Score: 5.32, indicating a safe zone from bankruptcy risk.
- Piotroski Score: 8, reflecting very strong financial health and value.
IEX Scores
- Altman Z-Score: 4.48, indicating a safe zone from bankruptcy risk.
- Piotroski Score: 7, reflecting strong financial health and value.
Which company has the best scores?
Based on the provided data, Rockwell Automation has both a higher Altman Z-Score and a higher Piotroski Score than IDEX. This indicates Rockwell Automation shows stronger financial stability and health according to these measures.
Grades Comparison
Here is a comparison of the latest reliable grades assigned to Rockwell Automation, Inc. and IDEX Corporation:
Rockwell Automation, Inc. Grades
The table below presents recent grades and rating actions from well-established financial institutions for Rockwell Automation, Inc.:
| Grading Company | Action | New Grade | Date |
|---|---|---|---|
| Wells Fargo | Maintain | Equal Weight | 2026-01-07 |
| Barclays | Maintain | Overweight | 2026-01-07 |
| Goldman Sachs | Upgrade | Neutral | 2025-12-16 |
| Jefferies | Maintain | Buy | 2025-12-10 |
| Citigroup | Maintain | Buy | 2025-12-08 |
| Barclays | Maintain | Overweight | 2025-12-04 |
| Baird | Maintain | Outperform | 2025-11-21 |
| B of A Securities | Maintain | Buy | 2025-11-20 |
| JP Morgan | Maintain | Neutral | 2025-11-11 |
| Morgan Stanley | Maintain | Overweight | 2025-11-10 |
Rockwell Automation’s grades mostly range from Neutral to Buy, with several Overweight and Outperform ratings, indicating a stable to moderately positive outlook.
IDEX Corporation Grades
The following table shows recent reliable grades for IDEX Corporation from recognized financial firms:
| Grading Company | Action | New Grade | Date |
|---|---|---|---|
| Citigroup | Maintain | Buy | 2025-12-08 |
| RBC Capital | Maintain | Outperform | 2025-10-30 |
| Stifel | Maintain | Buy | 2025-10-20 |
| Oppenheimer | Maintain | Outperform | 2025-10-07 |
| DA Davidson | Maintain | Neutral | 2025-08-04 |
| Stifel | Maintain | Buy | 2025-07-31 |
| RBC Capital | Maintain | Outperform | 2025-07-31 |
| Oppenheimer | Maintain | Outperform | 2025-07-31 |
| Stifel | Maintain | Buy | 2025-07-21 |
| Citigroup | Maintain | Buy | 2025-07-14 |
IDEX Corporation’s ratings predominantly fall into the Buy and Outperform categories, with a single Neutral, reflecting a generally favorable analyst sentiment.
Which company has the best grades?
Both Rockwell Automation, Inc. and IDEX Corporation have a consensus rating of “Hold.” However, IDEX Corporation consistently receives more Buy and Outperform ratings compared to Rockwell Automation’s more mixed grades. This suggests that IDEX has a more positive analyst outlook, which could influence investor sentiment and portfolio decisions.
Strengths and Weaknesses
Below is a comparison table highlighting the key strengths and weaknesses of Rockwell Automation, Inc. (ROK) and IDEX Corporation (IEX) based on their recent financial and operational data.
| Criterion | Rockwell Automation, Inc. (ROK) | IDEX Corporation (IEX) |
|---|---|---|
| Diversification | Revenue well-diversified across Intelligent Devices (3.76B), Lifecycle Services (2.20B), and Software & Control (2.38B) segments. | Balanced revenue streams from Health & Science Technologies (1.30B), Fluid & Metering Technologies (1.23B), and Fire & Safety Diversified Products (0.74B). |
| Profitability | High profitability with net margin at 10.42%, ROIC 13.71%, and ROE 23.78%. | Good net margin at 15.45%, moderate ROIC 8.81%, and neutral ROE 13.31%. |
| Innovation | Strong with growing ROIC trend (+77%), signaling efficient capital use and value creation. | Declining ROIC trend (-17.6%) indicates challenges in sustaining profitability. |
| Global presence | Strong global presence as reflected in consistent segment revenues and durable competitive advantage. | Solid global footprint with diversified technology products but somewhat weaker moat. |
| Market Share | Demonstrates a very favorable moat with ROIC > WACC by 3.32%, indicating value creation and strong market position. | Slightly unfavorable moat with ROIC just 1.05% above WACC but declining, suggesting market pressure. |
Key takeaway: Rockwell Automation exhibits stronger profitability, innovation, and a durable competitive advantage, making it a more robust value creator. IDEX shows good profitability but faces challenges with declining returns on capital and slightly weaker moat sustainability.
Risk Analysis
Below is a comparative table of key risks for Rockwell Automation, Inc. (ROK) and IDEX Corporation (IEX) based on the most recent data:
| Metric | Rockwell Automation, Inc. (ROK) | IDEX Corporation (IEX) |
|---|---|---|
| Market Risk | High beta 1.52, indicating higher volatility | Moderate beta 1.0, lower volatility |
| Debt level | Debt-to-assets 32.5%, neutral risk; Debt-to-equity score very unfavorable | Debt-to-assets 29.5%, favorable; Debt-to-equity score moderate risk |
| Regulatory Risk | Moderate, operates in industrial sectors with evolving regulations | Moderate, with exposure to fluid handling and safety industries |
| Operational Risk | Medium, due to global supply chain and diversified segments | Lower, smaller scale with focused product lines |
| Environmental Risk | Moderate, exposure in eco-industrial markets and energy sectors | Moderate, involved in water/wastewater and chemical industries |
| Geopolitical Risk | Moderate, international exposure in multiple markets | Moderate, global sales but less diversified internationally |
The most impactful risks for Rockwell Automation are its higher market volatility and unfavorable debt-related scores, which warrant cautious monitoring. IDEX’s moderate debt and stable operational profile present lower risk, though valuation multiples suggest some overpricing concerns. Both companies face typical industrial regulatory and environmental risks.
Which Stock to Choose?
Rockwell Automation, Inc. (ROK) shows a mixed income evolution with declining net income and margins over the recent period, but maintains favorable profitability ratios like ROE at 23.78% and a very favorable economic moat with growing ROIC above WACC. Its debt levels are moderate, with neutral to unfavorable liquidity ratios, and it holds a very favorable overall rating despite some valuation concerns.
IDEX Corporation (IEX) exhibits favorable income growth overall with a strong recent net income increase and a higher net margin of 15.45%. Financial ratios show a balanced profile with several favorable liquidity and coverage metrics, though ROE and ROIC are moderate and its economic moat is slightly unfavorable due to declining ROIC. Its rating is also very favorable, supported by solid financial stability and valuation scores.
Investors focused on durable competitive advantage and value creation might see Rockwell Automation’s strong and growing ROIC as a positive sign, while those prioritizing consistent income growth and liquidity could view IDEX’s favorable income trends and stronger short-term financial ratios as more appealing. The choice could therefore depend on whether the investor prefers growth driven by competitive moat strength or by income statement momentum and balance sheet stability.
Disclaimer: Investment carries a risk of loss of initial capital. The past performance is not a reliable indicator of future results. Be sure to understand risks before making an investment decision.
Go Further
I encourage you to read the complete analyses of Rockwell Automation, Inc. and IDEX Corporation to enhance your investment decisions: