Home > Comparison > Industrials > IEX vs PSN
The strategic rivalry between IDEX Corporation and Parsons Corporation shapes the industrial machinery sector’s evolution. IDEX operates as a diversified, specialized manufacturer across fluid and safety technologies. Parsons focuses on integrated defense and critical infrastructure solutions, blending technology with engineering services. This analysis explores their contrasting operational models and growth drivers to identify which offers a superior risk-adjusted return for diversified portfolios amid shifting industrial demands.
Table of contents
Companies Overview
IDEX Corporation and Parsons Corporation both hold crucial roles in the industrial machinery sector, shaping critical infrastructure and defense technology markets.
IDEX Corporation: Applied Solutions Specialist
IDEX Corporation dominates fluid and metering technologies, generating revenue through precision pumps, valves, and safety equipment across diverse industries. Its 2026 focus remains on expanding innovative solutions in fluid handling and safety systems, supporting sectors from pharmaceuticals to firefighting. The company leverages integrated product lines to maintain its competitive edge globally.
Parsons Corporation: Defense and Infrastructure Innovator
Parsons Corporation excels in integrated defense and critical infrastructure services, driving revenue via cybersecurity, geospatial intelligence, and infrastructure engineering. In 2026, Parsons prioritizes advancing technology in missile defense and smart infrastructure, serving government and private clients. Its broad service spectrum positions it as a strategic partner in national security and infrastructure modernization.
Strategic Collision: Similarities & Divergences
Both companies focus on industrial machinery but diverge sharply in market philosophy: IDEX emphasizes product innovation in fluid systems, while Parsons builds on integrated solutions in defense and infrastructure. Their battleground centers on technological leadership in safety and security sectors. Investors face distinct profiles—IDEX offers manufacturing-based stability; Parsons presents growth potential in government contracting.
Income Statement Comparison
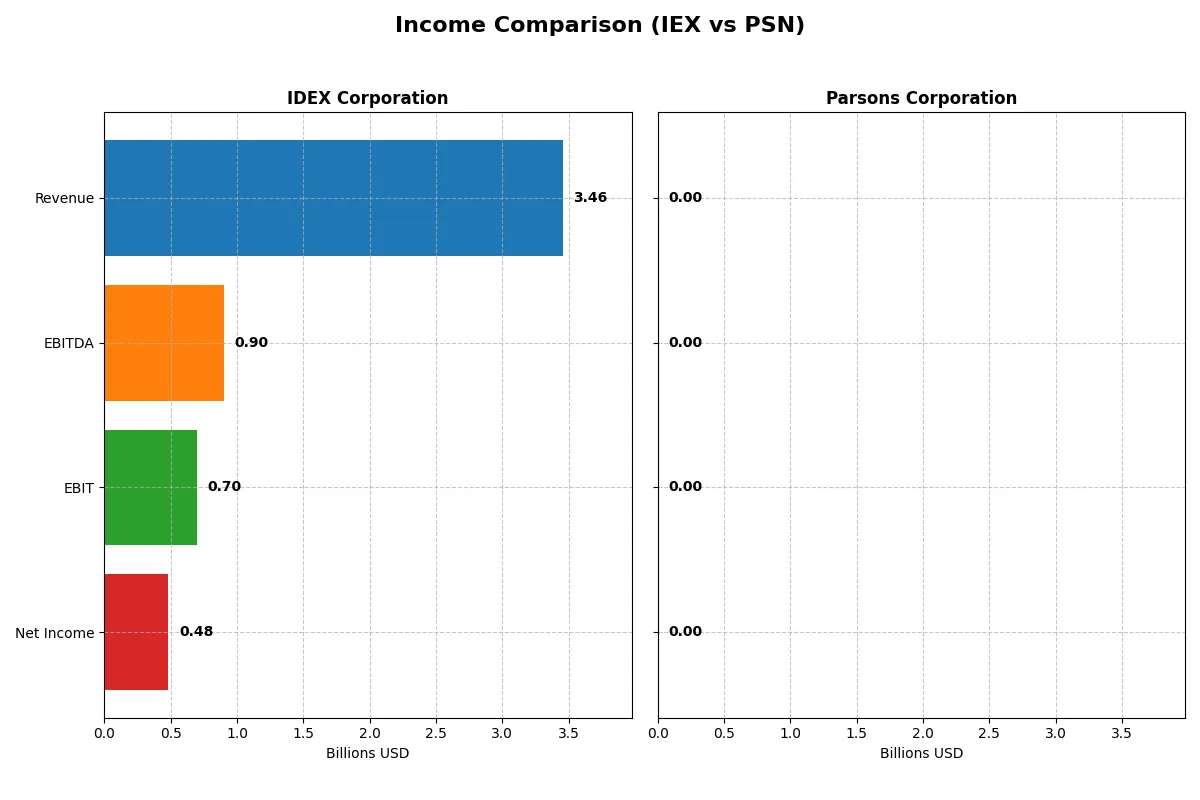
This data dissects the core profitability and scalability of both corporate engines to reveal who dominates the bottom line:
| Metric | IDEX Corporation (IEX) | Parsons Corporation (PSN) |
|---|---|---|
| Revenue | 3.46B | 100K |
| Cost of Revenue | 1.92B | 0 |
| Operating Expenses | 819M | 16K |
| Gross Profit | 1.54B | 0 |
| EBITDA | 903M | 6.6K |
| EBIT | 697M | 0 |
| Interest Expense | 64.4M | -800 |
| Net Income | 483M | 3.8K |
| EPS | 6.41 | 0 |
| Fiscal Year | 2025 | 2025 |
Income Statement Analysis: The Bottom-Line Duel
This income statement comparison will uncover which company operates with greater financial efficiency and sustainable profitability.
IDEX Corporation Analysis
IDEX Corporation steadily grows revenue from 2.76B in 2021 to 3.46B in 2025. Net income rises from 449M to 483M despite a slight dip in recent years. Gross margin holds strong around 44.5%, and net margin remains healthy near 14%, indicating efficient cost control and solid profitability momentum in 2025.
Parsons Corporation Analysis
Parsons Corporation’s revenue collapses from 6.75B in 2024 to just 100K in 2025, causing net income to plunge from 237M to near zero. Margins vanish accordingly, with gross and EBIT margins effectively zero in 2025. This sharp deterioration signals severe operational disruptions and loss of core earnings power.
Stability and Efficiency vs. Collapse and Uncertainty
IDEX dominates with consistent revenue growth and robust margins, whereas Parsons suffers a catastrophic revenue and profit plunge. IDEX’s resilient profitability and margin discipline make it the clear fundamental winner. Investors typically favor IDEX’s stable and efficient profile over Parsons’ current volatility and uncertainty.
Financial Ratios Comparison
These vital ratios act as a diagnostic tool to expose the underlying fiscal health, valuation premiums, and capital efficiency of the companies compared below:
| Ratios | IDEX Corporation (IEX) | Parsons Corporation (PSN) |
|---|---|---|
| ROE | 12.0% | 0.00014% |
| ROIC | 8.6% | 0.00015% |
| P/E | 27.7 | N/A |
| P/B | 3.33 | N/A |
| Current Ratio | 2.86 | 1.75 |
| Quick Ratio | 2.02 | 1.75 |
| D/E | 0.45 | 0.52 |
| Debt-to-Assets | 26.3% | 23.9% |
| Interest Coverage | 11.2 | -8.25 |
| Asset Turnover | 0.50 | 0.00002 |
| Fixed Asset Turnover | 7.39 | 0.00036 |
| Payout ratio | 44.0% | 0% |
| Dividend yield | 1.59% | 0% |
| Fiscal Year | 2025 | 2025 |
Efficiency & Valuation Duel: The Vital Signs
Financial ratios function as a company’s DNA, uncovering hidden risks and highlighting operational excellence that shapes investment decisions.
IDEX Corporation
IDEX exhibits solid profitability with a 12.0% ROE and a favorable 13.98% net margin, signaling operational strength. However, its P/E of 27.73 and P/B of 3.33 suggest the stock is somewhat stretched. The company maintains a 1.59% dividend yield, balancing shareholder returns with steady reinvestment.
Parsons Corporation
Parsons struggles with near-zero ROE and ROIC, reflecting weak profitability metrics. Its valuation ratios appear favorable due to zero P/E and P/B, but this masks underlying operational challenges. The firm pays no dividends, focusing on navigating financial strain rather than growth or shareholder returns.
Premium Valuation vs. Operational Fragility
IDEX offers a better balance of risk and reward with stronger profitability and healthier operational metrics despite a higher valuation. Parsons’ favorable valuation ratios hide poor returns and lack of shareholder distributions, fitting more cautious or turnaround-focused investors.
Which one offers the Superior Shareholder Reward?
IEX offers shareholders a balanced reward through a 1.59% dividend yield and a 44% payout ratio, supported by strong free cash flow (FCF) coverage near 90%. Its consistent buybacks amplify total returns, reflecting prudent capital allocation. PSN pays no dividends, focusing on reinvestment and debt management, but its lower cash ratio and volatile margins limit buyback scope. Historically, IEX’s distribution model sustains long-term value better. I conclude IEX provides a more attractive total return profile for 2026 investors.
Comparative Score Analysis: The Strategic Profile
The radar chart reveals the fundamental DNA and trade-offs of IDEX Corporation and Parsons Corporation, highlighting their financial strengths and valuation challenges:
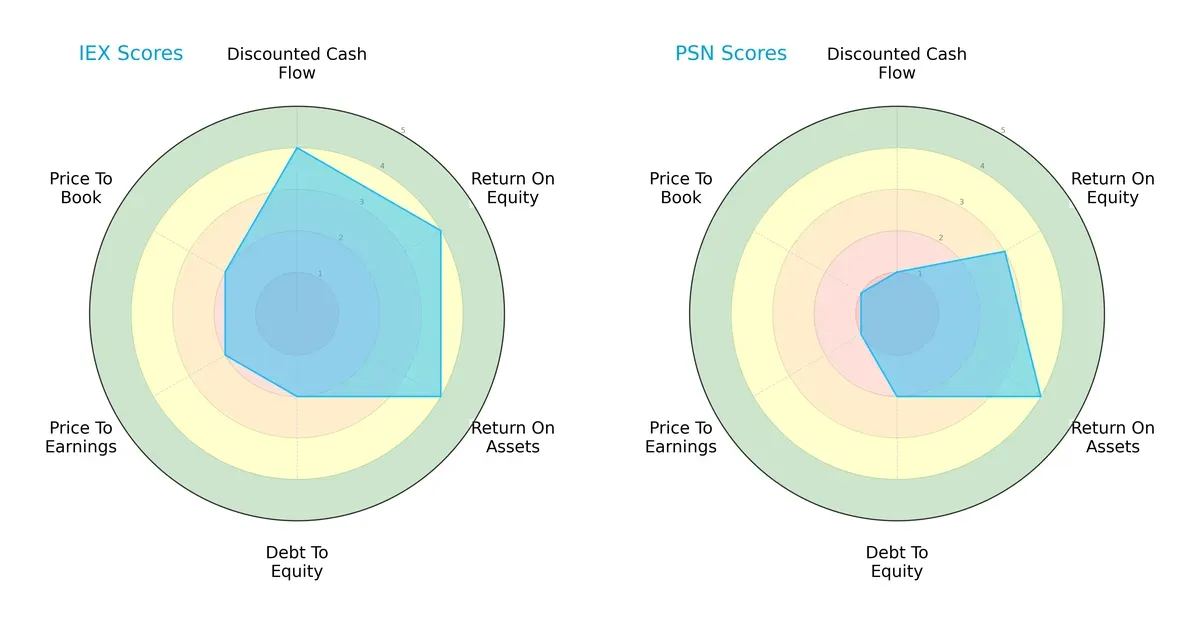
IDEX shows superior scores in discounted cash flow (4 vs. 1), return on equity (4 vs. 3), and price-to-earnings (2 vs. 1), indicating stronger cash generation and valuation metrics. Parsons matches IDEX only in return on assets (4 each) and debt-to-equity (2 each), reflecting similar asset efficiency and leverage risk. Overall, IDEX presents a more balanced profile, while Parsons relies heavily on asset returns despite valuation headwinds.
Bankruptcy Risk: Solvency Showdown
The Altman Z-Score gap signals IDEX’s stronger solvency and lower bankruptcy risk compared to Parsons in this cycle:
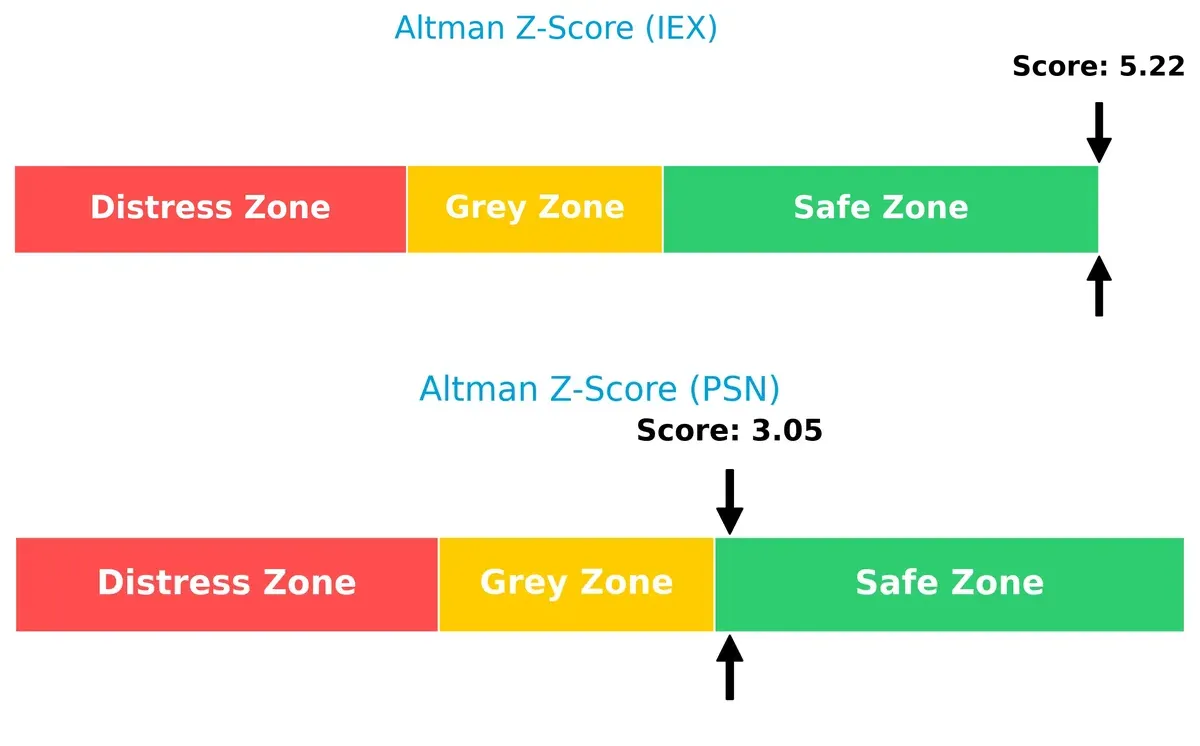
IDEX’s score of 5.22 well exceeds Parsons’ 3.05, both safely above the distress threshold of 3. I’ve observed that companies above this mark typically withstand economic downturns better, confirming IDEX’s stronger financial resilience.
Financial Health: Quality of Operations
I see IDEX’s Piotroski F-Score of 8 as evidence of robust financial health, surpassing Parsons’ moderate score of 6:
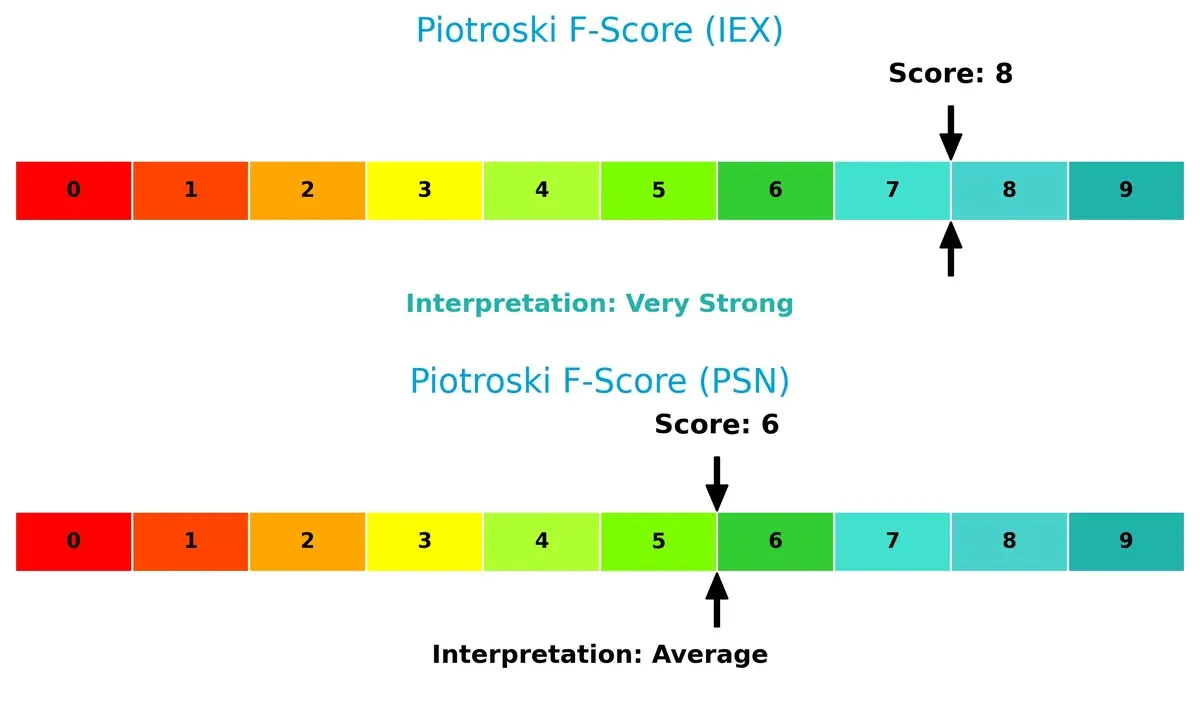
IDEX demonstrates superior profitability, liquidity, and operational efficiency, with no red flags. Parsons’ lower score suggests some caution in its internal financial metrics, highlighting potential risks in operational quality.
How are the two companies positioned?
This section dissects the operational DNA of IDEX and Parsons by comparing their revenue distribution and internal dynamics. The goal is to confront their economic moats to identify which model offers the most resilient competitive advantage today.
Revenue Segmentation: The Strategic Mix
The following visual comparison dissects how IDEX Corporation and Parsons Corporation diversify their income streams and where their primary sector bets lie:
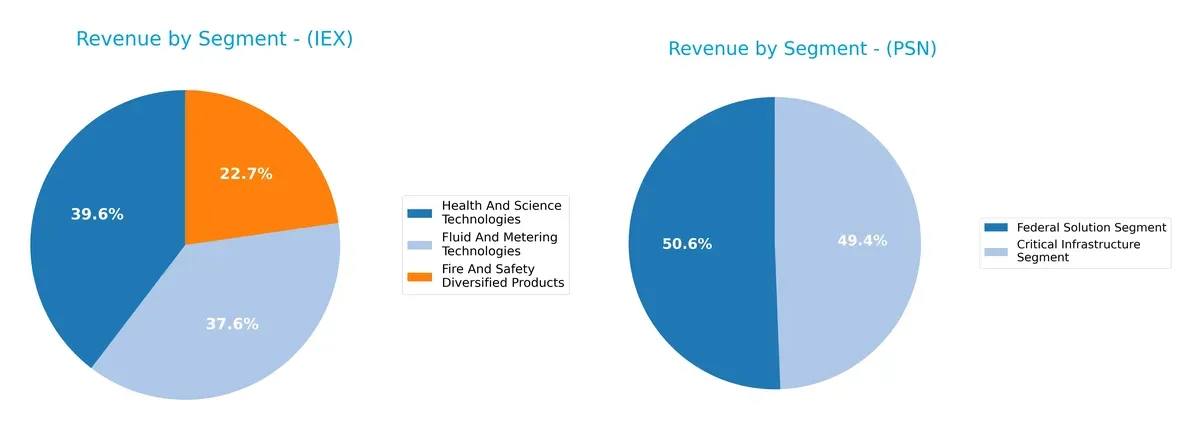
IDEX Corporation presents a balanced revenue mix, with Health And Science Technologies at $1.3B, Fluid And Metering Technologies near $1.2B, and Fire And Safety Diversified Products around $744M in 2024. In contrast, Parsons Corporation leans heavily on two large segments: Federal Solutions at $4B and Critical Infrastructure close to $2.7B in 2024. IDEX’s diversified portfolio reduces concentration risk, while Parsons pivots on government contracts, exposing it to sector-specific cycles but benefiting from infrastructure dominance.
Strengths and Weaknesses Comparison
This table compares the strengths and weaknesses of IDEX Corporation and Parsons Corporation:
IDEX Corporation Strengths
- Diversified revenue across Health, Safety, and Fluid Technologies
- Favorable net margin of 14%
- Strong liquidity with current ratio 2.86
- Low debt-to-assets at 26%
- Global presence with significant US and Europe sales
Parsons Corporation Strengths
- Strong revenue in Federal and Critical Infrastructure segments
- Favorable WACC at 2.19%
- Good liquidity ratios at 1.75 current and quick
- Low debt-to-assets ratio of 24%
- Large North America geographic exposure
IDEX Corporation Weaknesses
- High valuation multiples with PE 27.7 and PB 3.33
- Unfavorable asset turnover at 0.5
- Neutral ROE and ROIC near 12% and 8.7% respectively
- Dividend yield modest at 1.6%
Parsons Corporation Weaknesses
- Low profitability with net margin 3.8% and zero ROE/ROIC
- Negative interest coverage ratio
- Unfavorable asset turnover and fixed asset turnover at zero
- No dividend yield
IDEX shows solid profitability and financial strength with some valuation caution and asset efficiency challenges. Parsons suffers from weaker profitability and coverage ratios despite strong liquidity and focused market segments. These contrasts highlight differing strategic priorities and financial health.
The Moat Duel: Analyzing Competitive Defensibility
A structural moat alone shields long-term profits from relentless competitive erosion. Let’s dissect how IDEX and Parsons defend their turf:
IDEX Corporation: Intangible Assets & Diversified Solutions
IDEX leverages a broad portfolio of engineered fluidics and safety products, driving stable margins and a 14% net margin in 2025. However, declining ROIC signals margin pressure. New market expansions in biotech and water treatment could reinforce its moat, if managed prudently.
Parsons Corporation: Specialized Defense Contracts & Critical Infrastructure
Parsons relies heavily on defense and critical infrastructure contracts, creating high switching costs with government clients. Despite a 3.8% net margin, its ROIC sharply declines, indicating value erosion. Growth hinges on scaling cybersecurity and space tech offerings amid fierce competition.
Verdict: Diversification vs. Government Dependency
IDEX’s wider moat stems from diversified industrial applications and stronger margin stability, unlike Parsons’ narrow defense focus with volatile returns. IDEX appears better positioned to protect market share against competitive threats in 2026.
Which stock offers better returns?
The stock prices of IDEX Corporation and Parsons Corporation have shown contrasting dynamics over the past year, with notable swings and differing momentum in recent months.
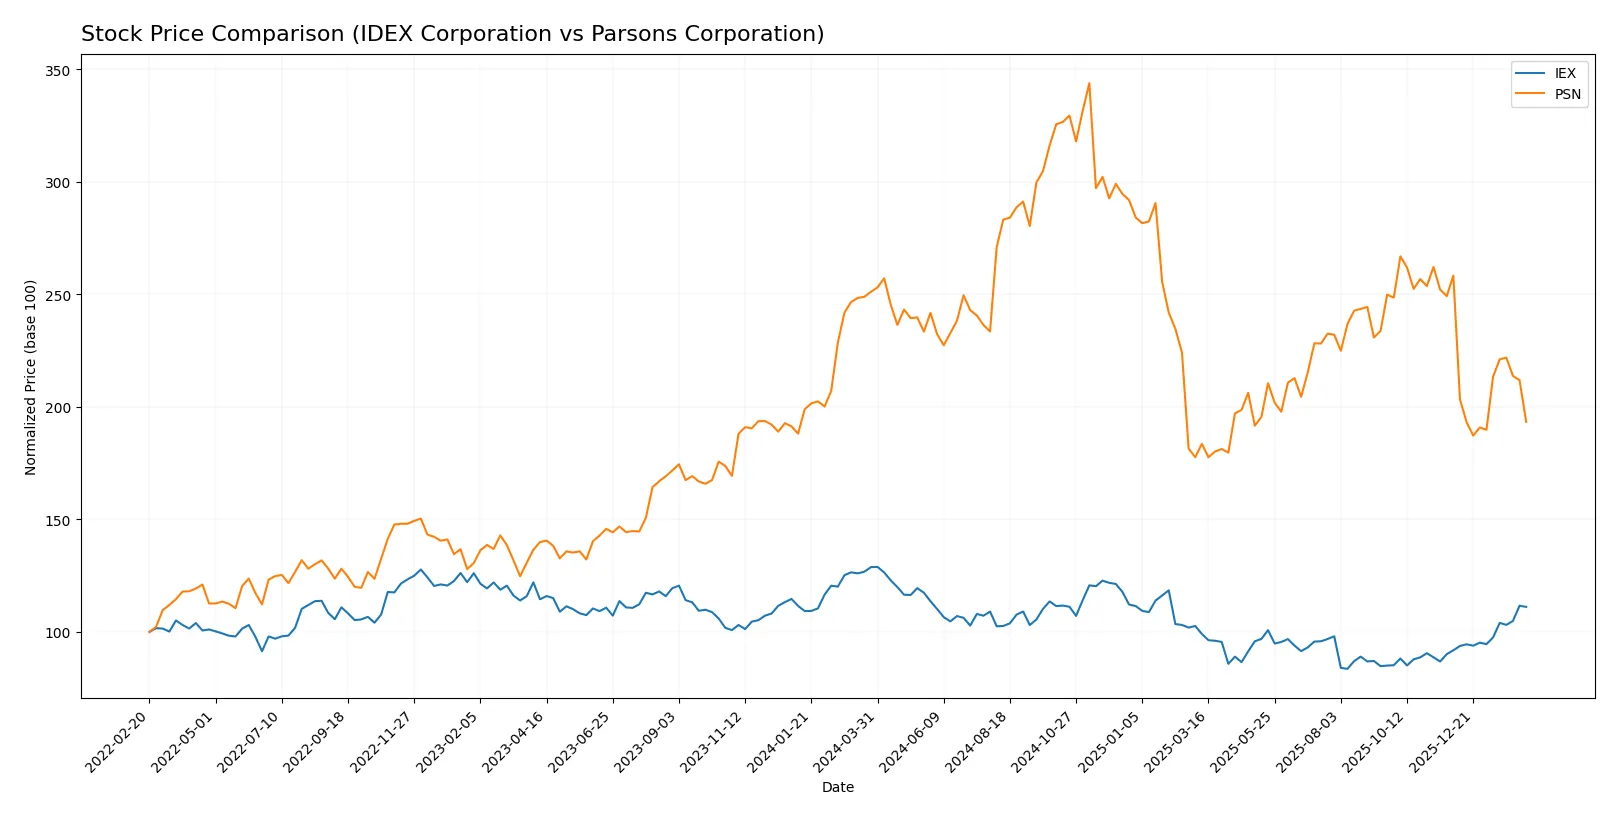
Trend Comparison
IDEX Corporation’s stock delivered a -13.72% decline over the past year, marking a bearish trend with accelerating downward momentum. It reached a high of 244.02 and a low of 158.26, with volatility elevated at a 22.27 standard deviation.
Parsons Corporation experienced a steeper bearish trend, losing 23.0% over the same period with decelerating decline. Its price fluctuated between 112.69 and 58.22, showing lower volatility at 13.2 standard deviation compared to IEX.
Comparing the two, IDEX Corporation outperformed Parsons Corporation with a smaller loss and recent price acceleration, indicating relatively stronger market performance.
Target Prices
Analysts present a confident consensus on target prices for IDEX Corporation and Parsons Corporation.
| Company | Target Low | Target High | Consensus |
|---|---|---|---|
| IDEX Corporation | 220 | 247 | 236.83 |
| Parsons Corporation | 78 | 104 | 86.8 |
The target consensus for IDEX exceeds its current price of 210.41, signaling upside potential. Parsons’ consensus target also suggests a significant premium over its 63.38 price, reflecting optimistic analyst outlooks.

Don’t Let Luck Decide Your Entry Point
Optimize your entry points with our advanced ProRealTime indicators. You’ll get efficient buy signals with precise price targets for maximum performance. Start outperforming now!
How do institutions grade them?
The following tables summarize the most recent institutional grades for IDEX Corporation and Parsons Corporation:
IDEX Corporation Grades
The table below shows current grades from reputable financial institutions for IDEX Corporation.
| Grading Company | Action | New Grade | Date |
|---|---|---|---|
| Argus Research | Upgrade | Buy | 2026-02-06 |
| RBC Capital | Maintain | Outperform | 2026-02-05 |
| Citigroup | Maintain | Buy | 2026-02-05 |
| DA Davidson | Maintain | Neutral | 2026-02-05 |
| TD Cowen | Maintain | Buy | 2026-02-05 |
| Stifel | Maintain | Buy | 2026-01-23 |
| Citigroup | Maintain | Buy | 2025-12-08 |
| RBC Capital | Maintain | Outperform | 2025-10-30 |
| Stifel | Maintain | Buy | 2025-10-20 |
| Oppenheimer | Maintain | Outperform | 2025-10-07 |
Parsons Corporation Grades
The table below presents recent grades from reliable financial firms for Parsons Corporation.
| Grading Company | Action | New Grade | Date |
|---|---|---|---|
| UBS | Maintain | Buy | 2026-02-12 |
| Truist Securities | Maintain | Buy | 2026-02-12 |
| Keybanc | Maintain | Overweight | 2026-02-12 |
| Barclays | Maintain | Overweight | 2026-01-23 |
| Keybanc | Maintain | Overweight | 2026-01-20 |
| UBS | Maintain | Buy | 2026-01-15 |
| Citigroup | Maintain | Buy | 2026-01-13 |
| B of A Securities | Maintain | Buy | 2025-12-30 |
| Stifel | Maintain | Buy | 2025-12-23 |
| Jefferies | Maintain | Hold | 2025-12-11 |
Which company has the best grades?
IDEX Corporation receives consistently positive grades, with multiple “Buy” and “Outperform” ratings, including a recent upgrade. Parsons Corporation also holds strong grades, mostly “Buy” and “Overweight,” but includes a “Hold” rating. IDEX’s higher concentration of upgrades and outperform ratings may indicate slightly stronger institutional confidence, potentially influencing investor sentiment more positively.
Risks specific to each company
The following categories identify the critical pressure points and systemic threats facing both firms in the 2026 market environment:
1. Market & Competition
IDEX Corporation
- Operates in diversified industrial machinery with strong segments; faces aggressive innovation and pricing pressure.
Parsons Corporation
- Focuses on defense and critical infrastructure; competition includes large defense contractors and technology firms.
2. Capital Structure & Debt
IDEX Corporation
- Debt-to-equity at 0.45, interest coverage strong at 10.82, showing healthy leverage control.
Parsons Corporation
- Slightly higher debt-to-equity at 0.52, but negative interest coverage signals risk in servicing debt.
3. Stock Volatility
IDEX Corporation
- Beta near 1 (0.983) indicates market-level volatility, relatively stable for industrial sector.
Parsons Corporation
- Lower beta at 0.665 suggests less sensitivity to market swings but could imply less liquidity.
4. Regulatory & Legal
IDEX Corporation
- Exposure to multiple sectors increases regulatory complexity but operates in established markets.
Parsons Corporation
- Heavily regulated defense contracts and government oversight increase legal risk.
5. Supply Chain & Operations
IDEX Corporation
- Global operations in fluid and metering tech sensitive to raw material cost fluctuations and logistics.
Parsons Corporation
- Operations dependent on government projects and critical infrastructure, vulnerable to project delays and budget cuts.
6. ESG & Climate Transition
IDEX Corporation
- Industrial machinery focus requires ongoing adaptation to environmental standards and sustainable products.
Parsons Corporation
- Defense and infrastructure sectors face growing ESG scrutiny, especially on climate impact and ethical sourcing.
7. Geopolitical Exposure
IDEX Corporation
- Primarily US-based with global sales; geopolitical tensions may disrupt supply chains or demand.
Parsons Corporation
- Significant exposure to US defense and international contracts; geopolitical shifts can affect contract stability.
Which company shows a better risk-adjusted profile?
IDEX Corporation’s strongest risk lies in competitive innovation pressures, but it demonstrates robust financial health and liquidity. Parsons faces critical risks from its negative interest coverage and dependence on volatile government contracts. IDEX’s Altman Z-Score of 5.22 and Piotroski score of 8 signal strong financial stability. Parsons’ scores, though in the safe zone, reflect moderate financial health with a Piotroski score of 6. IDEX’s superior capital structure and coverage ratios grant it a better risk-adjusted profile in 2026. The negative interest coverage at Parsons, despite a lower beta, justifies heightened caution.
Final Verdict: Which stock to choose?
IDEX Corporation’s superpower lies in its robust financial discipline and solid liquidity, making it a reliable cash generator. However, its declining return on invested capital signals a point of vigilance for value creation. It suits portfolios focused on steady, moderate growth with a tolerance for some cyclical risk.
Parsons Corporation benefits from a strategic moat rooted in its specialized government contracts and recurring project work, providing revenue stability. Despite weaker profitability metrics, it offers a safer balance sheet profile than IDEX. It fits well with income-focused or conservative portfolios seeking downside protection.
If you prioritize disciplined capital allocation and consistent cash flow, IDEX outshines Parsons with better financial health and operational efficiency. However, if you seek stability amid uncertainty and value a defensive stance, Parsons offers better downside protection albeit at the cost of slower growth. Each appeals to distinct investor profiles navigating the current market cycle.
Disclaimer: Investment carries a risk of loss of initial capital. The past performance is not a reliable indicator of future results. Be sure to understand risks before making an investment decision.
Go Further
I encourage you to read the complete analyses of IDEX Corporation and Parsons Corporation to enhance your investment decisions: