Home > Comparison > Industrials > PH vs IEX
The strategic rivalry between Parker-Hannifin Corporation and IDEX Corporation shapes the industrial machinery landscape. Parker-Hannifin operates as a diversified industrial and aerospace systems powerhouse, while IDEX focuses on specialized fluid and metering technologies alongside health and safety solutions. This analysis pits Parker-Hannifin’s broad industrial footprint against IDEX’s niche innovation. I aim to identify which company’s strategy offers superior risk-adjusted returns for a balanced industrial portfolio.
Table of contents
Companies Overview
Parker-Hannifin and IDEX Corporation stand as pivotal players in the industrial machinery sector, shaping global motion and fluid control markets.
Parker-Hannifin Corporation: Industrial Motion & Control Leader
Parker-Hannifin dominates with its motion and control technologies across diversified industrial and aerospace markets. Its core revenue stems from sealed systems, hydraulic and pneumatic components, and aerospace engine parts. In 2026, the company strategically emphasized expanding aerospace systems while enhancing fluid control precision to bolster its competitive edge worldwide.
IDEX Corporation: Applied Solutions Innovator
IDEX focuses on fluid and metering technologies, health science, and fire safety products. It generates revenue by designing pumps, fluid-handling systems, and precision components serving diverse industries from pharmaceuticals to firefighting. The 2026 strategy prioritized innovation in biocompatible medical devices and expanding market share in life sciences and industrial fluid systems.
Strategic Collision: Similarities & Divergences
Both companies lead in industrial machinery but with distinct philosophies—Parker-Hannifin centers on integrated motion control and aerospace, while IDEX pursues diversified fluid solutions with a strong health science angle. Their primary battleground is the fluid handling and control market, but Parker-Hannifin’s aerospace focus contrasts with IDEX’s biotech and safety niche. This divergence creates unique risk and growth profiles for investors.
Income Statement Comparison
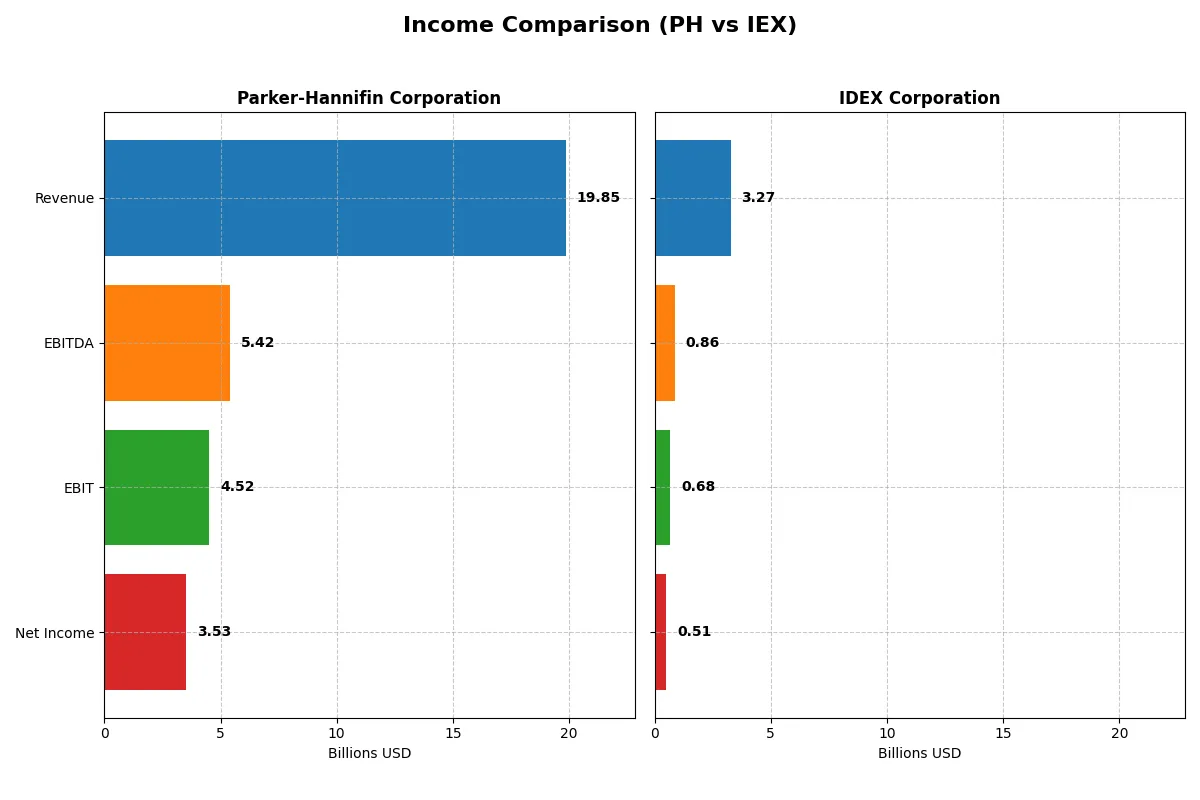
This data dissects the core profitability and scalability of both corporate engines to reveal who dominates the bottom line:
| Metric | Parker-Hannifin Corporation (PH) | IDEX Corporation (IEX) |
|---|---|---|
| Revenue | 19.85B | 3.27B |
| Cost of Revenue | 12.54B | 1.75B |
| Operating Expenses | 3.26B | 820M |
| Gross Profit | 7.32B | 1.52B |
| EBITDA | 5.42B | 859M |
| EBIT | 4.52B | 684M |
| Interest Expense | 409M | 45M |
| Net Income | 3.53B | 505M |
| EPS | 27.52 | 6.67 |
| Fiscal Year | 2025 | 2024 |
Income Statement Analysis: The Bottom-Line Duel
This income statement comparison exposes the true operational efficiency and profitability of each company’s business engine over recent years.
Parker-Hannifin Corporation Analysis
Parker-Hannifin’s revenue grew steadily from $14.3B in 2021 to $19.85B in 2025, reflecting a 38% rise overall despite a slight 0.4% dip in the latest year. Net income surged impressively to $3.53B in 2025, doubling since 2021. The company sustains healthy gross (36.9%) and net margins (17.8%) with a strong 22.8% EBIT margin, showing improved operating efficiency and margin expansion momentum.
IDEX Corporation Analysis
IDEX’s revenue climbed from $2.35B in 2020 to $3.27B in 2023 but slipped slightly to $3.27B in 2024, with a modest overall growth of 39%. Net income rose from $378M to $596M over the period but contracted 15% in the last year. Gross margin remains robust at 46.4%, while net margin stands at 15.5%, though recent EBIT and net margins show weakening, signaling margin pressure despite solid top-line scale.
Margin Strength vs. Growth Resilience
Parker-Hannifin delivers superior margin improvement and net income growth, surpassing IDEX’s slower and more volatile profitability trends. PH’s consistent margin expansion and doubling net income highlight operational discipline and capital allocation prowess. Investors seeking stable margin growth will find PH’s profile more compelling, while IDEX’s appeal lies in moderate revenue gains offset by recent margin challenges.
Financial Ratios Comparison
These vital ratios act as a diagnostic tool to expose the underlying fiscal health, valuation premiums, and capital efficiency of the following companies:
| Ratios | Parker-Hannifin (PH) | IDEX Corporation (IEX) |
|---|---|---|
| ROE | 25.81% | 13.31% |
| ROIC | 13.69% | 8.81% |
| P/E | 25.38 | 31.37 |
| P/B | 6.55 | 4.18 |
| Current Ratio | 1.19 | 2.53 |
| Quick Ratio | 0.71 | 1.85 |
| D/E (Debt to Equity) | 0.69 | 0.52 |
| Debt-to-Assets | 32.16% | 29.45% |
| Interest Coverage | 9.93 | 15.66 |
| Asset Turnover | 0.67 | 0.48 |
| Fixed Asset Turnover | 6.76 | 7.10 |
| Payout Ratio | 24.38% | 40.65% |
| Dividend Yield | 0.96% | 1.30% |
| Fiscal Year | 2025 | 2024 |
Efficiency & Valuation Duel: The Vital Signs
Financial ratios serve as a company’s DNA, exposing hidden risks and unveiling operational strengths critical to investment decisions.
Parker-Hannifin Corporation
Parker-Hannifin posts a robust 25.8% ROE and a strong 17.8% net margin, signaling high profitability. However, its P/E at 25.4 and P/B at 6.55 stretch valuation beyond typical benchmarks. Dividend yield is modest at 0.96%, reflecting a cautious payout paired with reinvestment into operational efficiency and innovation.
IDEX Corporation
IDEX shows moderate profitability with a 13.3% ROE and 15.5% net margin, reflecting stable but less aggressive returns. Its valuation is more stretched with a P/E of 31.4, though a lower P/B of 4.18 tempers concerns. The dividend yield of 1.3% offers modest income, balanced by a solid capital structure and favorable liquidity ratios.
Valuation Stretch vs. Operational Strength
Parker-Hannifin delivers higher profitability and efficient capital use despite a somewhat stretched valuation. IDEX balances decent returns with stronger liquidity and lower leverage but trades at a higher P/E. Risk-tolerant investors may prefer Parker-Hannifin’s operational edge, while conservative profiles might lean toward IDEX’s financial stability.
Which one offers the Superior Shareholder Reward?
I compare Parker-Hannifin Corporation (PH) and IDEX Corporation (IEX) on dividends, payout ratios, and buyback intensity. PH yields 0.96% with a 24% payout ratio, supported by strong free cash flow coverage (2.9x). IEX yields 1.30% with a 40% payout ratio and solid FCF coverage (2.5x). Both maintain consistent buybacks, but PH’s higher free cash flow per share ($26 vs. $8) and disciplined payout suggest a more sustainable distribution model. IEX’s higher payout ratio pressures reinvestment capacity despite a higher yield. I judge PH offers a superior total return profile in 2026 due to balanced capital allocation and sustainable shareholder rewards.
Comparative Score Analysis: The Strategic Profile
The radar chart reveals the fundamental DNA and trade-offs of Parker-Hannifin and IDEX, highlighting their strategic strengths and vulnerabilities side by side:
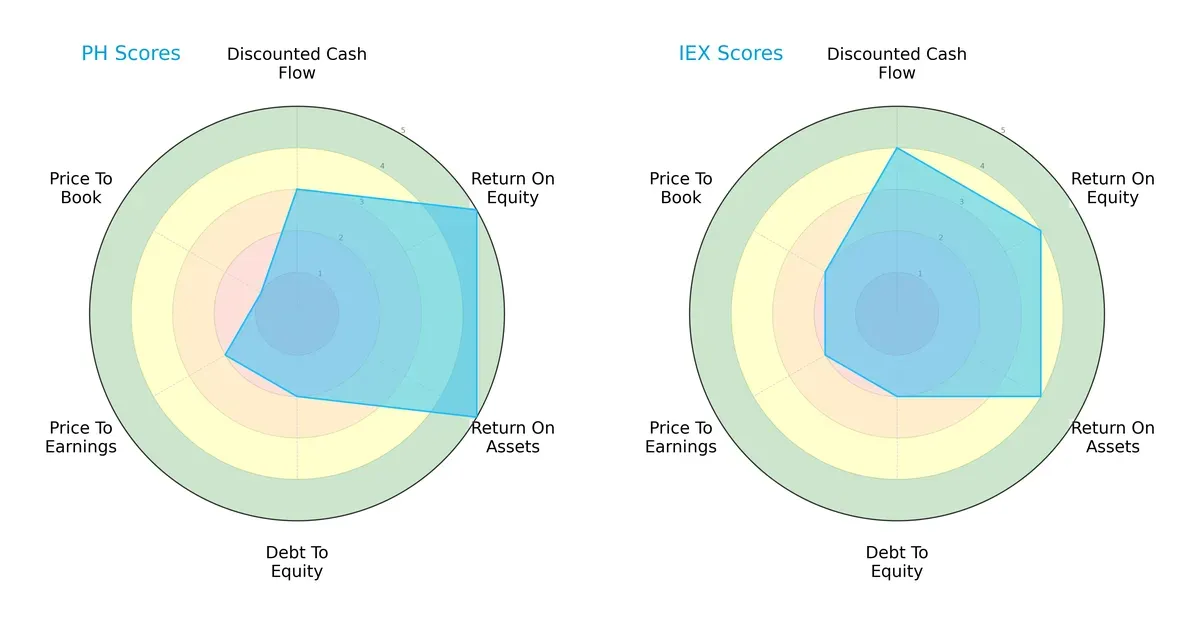
Parker-Hannifin leads in profitability metrics with top ROE and ROA scores of 5, reflecting superior capital efficiency. IDEX edges ahead in discounted cash flow valuation, scoring 4 versus 3, suggesting better growth expectations. Both share a moderate debt profile (score 2), but Parker-Hannifin’s valuation metrics lag with a very unfavorable price-to-book score of 1, while IDEX shows moderate valuation strength. Overall, Parker-Hannifin’s profile is more concentrated on operational excellence, whereas IDEX offers a more balanced valuation and profitability combination.
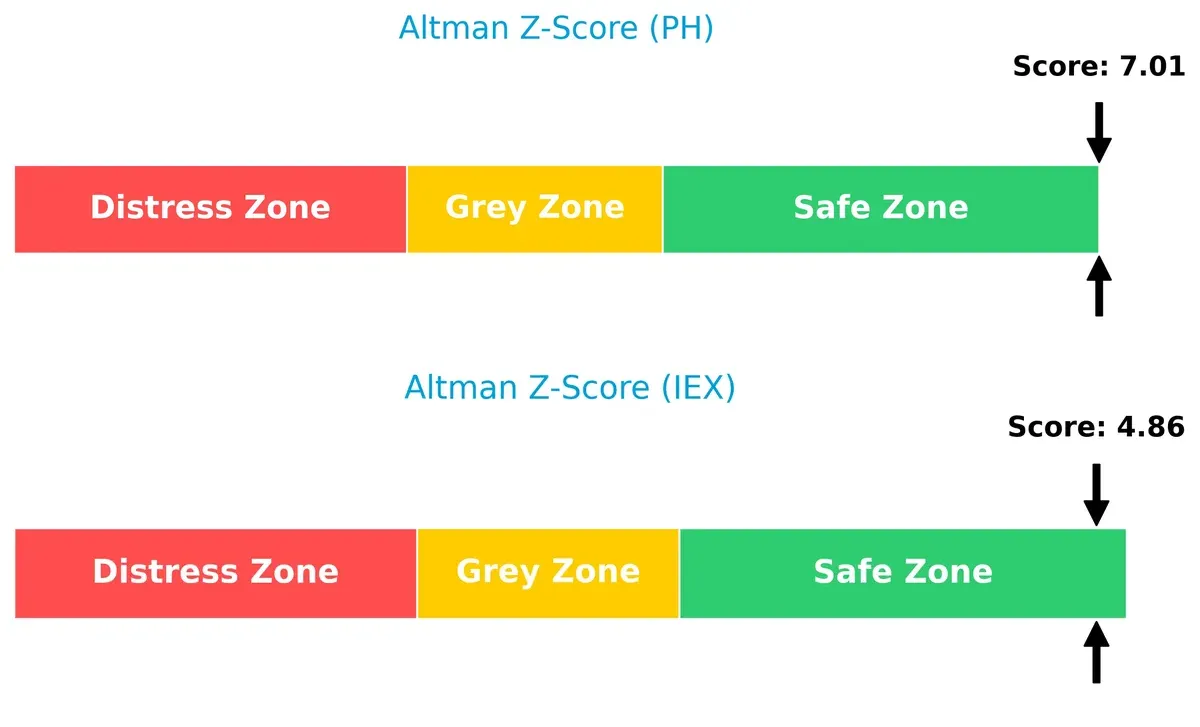
Bankruptcy Risk: Solvency Showdown
The Altman Z-Scores place both firms comfortably in the safe zone, with Parker-Hannifin at 7.0 and IDEX at 4.9, signaling solid long-term solvency prospects in this late-cycle environment:
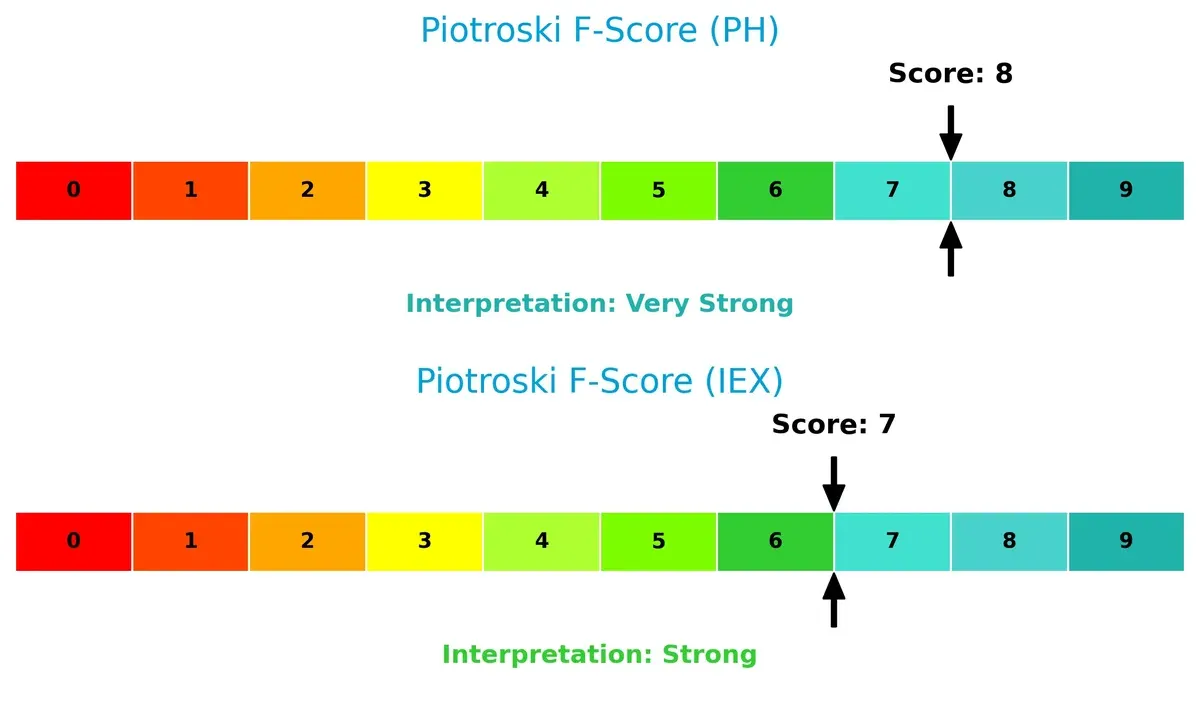
Financial Health: Quality of Operations
Parker-Hannifin’s Piotroski F-Score of 8 indicates very strong financial health, outperforming IDEX’s strong score of 7. This suggests Parker-Hannifin maintains superior internal controls and operational quality, with fewer red flags on profitability and liquidity:
How are the two companies positioned?
This section dissects PH and IEX’s operational DNA by comparing revenue distribution and internal strengths and weaknesses. The goal is to confront their economic moats to identify which model offers the most resilient competitive advantage today.
Revenue Segmentation: The Strategic Mix
This visual comparison dissects how Parker-Hannifin and IDEX diversify income streams and where their primary sector bets lie:
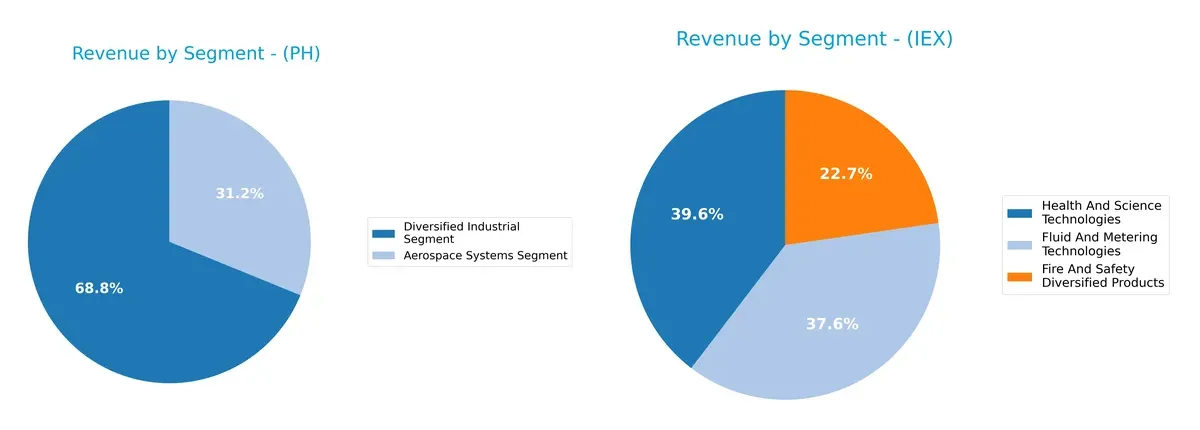
Parker-Hannifin anchors revenue in its Diversified Industrial Segment at $13.7B (2025), dwarfing its Aerospace Systems at $6.2B. IDEX presents a more balanced mix across Health & Science ($1.3B), Fluid & Metering ($1.2B), and Fire & Safety ($0.74B). Parker’s concentration risks hinge on industrial markets, while IDEX’s diversification cushions against sector volatility, reflecting distinct strategic bets on infrastructure dominance versus ecosystem lock-in.
Strengths and Weaknesses Comparison
This table compares the Strengths and Weaknesses of Parker-Hannifin Corporation (PH) and IDEX Corporation (IEX):
PH Strengths
- Strong profitability with 17.79% net margin and 25.81% ROE
- Favorable return on invested capital (13.69%) above WACC (9.24%)
- Diverse revenue from Aerospace and Diversified Industrial segments
- Significant global presence, especially in North America and Europe
- Solid interest coverage ratio (11.04) and fixed asset turnover (6.76)
IEX Strengths
- Favorable net margin (15.45%) and strong interest coverage (15.37)
- Higher current (2.53) and quick ratios (1.85) indicate strong liquidity
- Diverse segments including Health, Safety, and Fluid Technologies
- Global footprint with notable US and European revenues
- WACC (7.85%) below ROIC (8.81%), reflecting efficient capital use
PH Weaknesses
- Unfavorable PE (25.38) and PB (6.55), indicating expensive valuation
- Quick ratio (0.71) below 1 signals potential liquidity risk
- Moderate debt-to-equity (0.69) and debt-to-assets (32.16%) with neutral status
- Dividend yield low at 0.96%, less attractive for income investors
- Asset turnover (0.67) is neutral, suggesting room for operational improvement
IEX Weaknesses
- High PE ratio (31.37) and unfavorable PB (4.18) suggest premium valuation
- Lower ROE (13.31%) and ROIC (8.81%) relative to PH
- Asset turnover weak at 0.48, impacting efficiency
- Dividend yield neutral at 1.3%, not a standout feature
- Debt-to-assets at 29.45% favorable but limits leverage flexibility
Both companies show slightly favorable overall financial profiles but differ in liquidity and valuation. PH’s higher profitability and global scale contrast with IEX’s stronger liquidity and efficient capital cost. Each faces valuation risks and operational efficiency challenges that shape their strategic focus.
The Moat Duel: Analyzing Competitive Defensibility
A structural moat is the only true shield protecting long-term profits from relentless competitive erosion. Here’s how Parker-Hannifin and IDEX stack up:
Parker-Hannifin Corporation: Durable Value Creation through Operational Excellence
Parker-Hannifin’s moat stems from its cost advantage and diversified industrial portfolio. It sustains high ROIC well above WACC, reflecting efficient capital use and margin stability. New aerospace and industrial innovations could deepen this advantage by 2026.
IDEX Corporation: Niche Specialization with Emerging Challenges
IDEX relies on specialized fluid and metering technologies as its moat, contrasting with Parker’s scale-driven cost edge. However, declining ROIC signals weakening profitability. Expansion into health and safety markets offers growth potential but risks further margin pressure.
Verdict: Cost Leadership vs. Niche Innovation
Parker-Hannifin commands a wider, more durable moat with growing ROIC and strong margin consistency. IDEX’s narrower moat faces erosion from declining returns. Parker-Hannifin stands better poised to defend and grow its market share through 2026.
Which stock offers better returns?
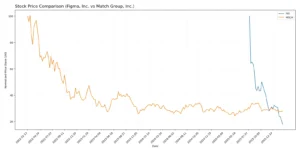
The past year saw sharp price gains for Parker-Hannifin and a notable decline for IDEX, each showing distinct trading momentum and buyer dominance trends.
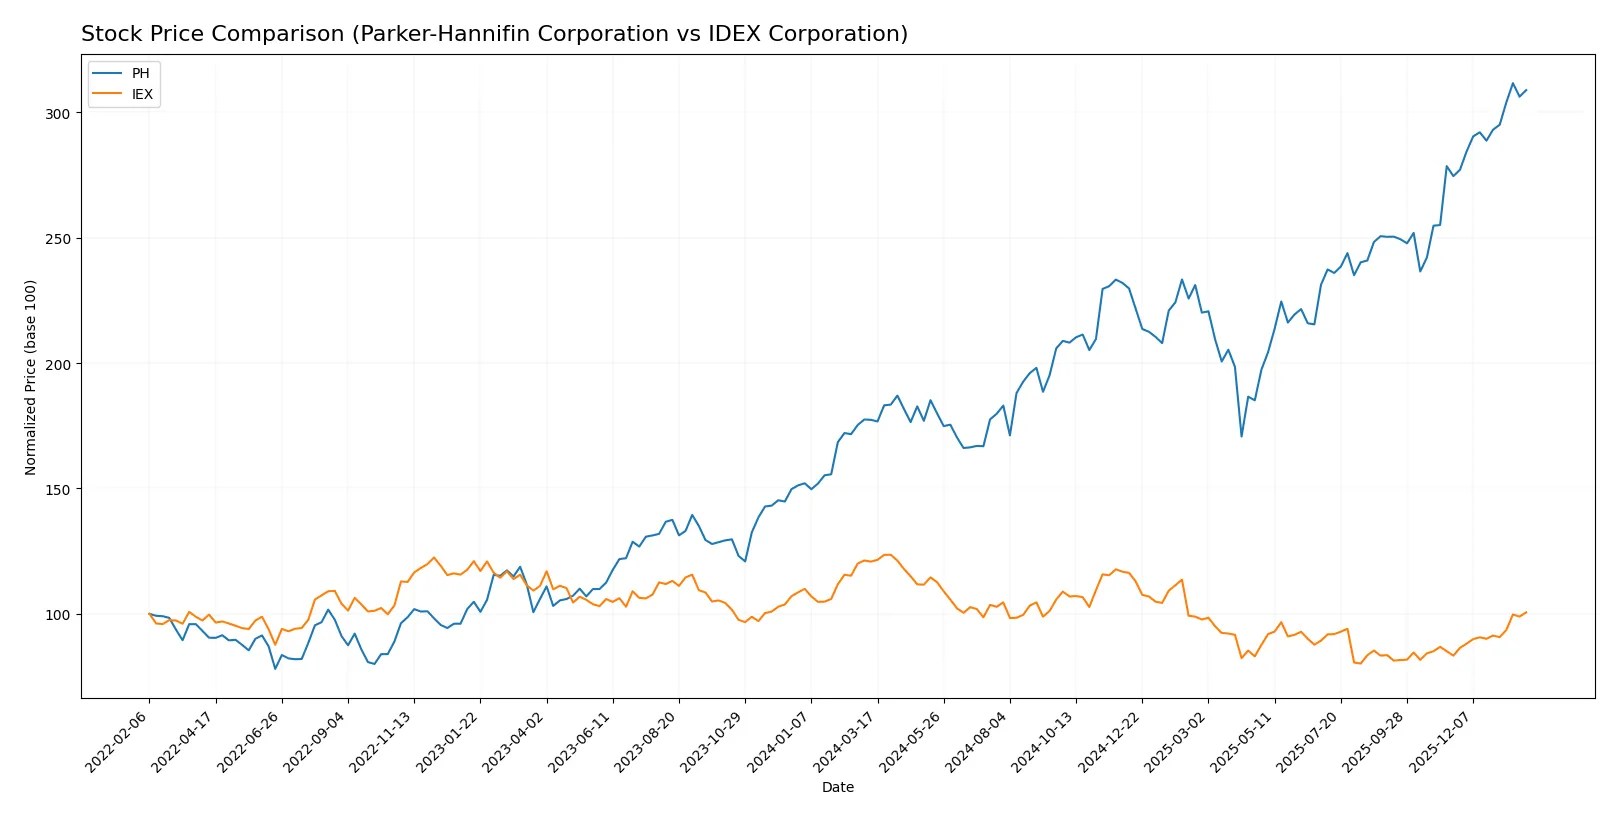
Trend Comparison
Parker-Hannifin’s stock rose 74.16% over the last 12 months, displaying a bullish trend with accelerating gains and a high price range between 503.3 and 944.27.
IDEX’s stock fell 16.78% over the same period, marking a bearish trend despite recent acceleration and a narrower price range from 158.26 to 244.02.
Parker-Hannifin outperformed IDEX with a strong bullish trend and higher price appreciation across the full year under review.
Target Prices
Analysts set clear target price ranges for Parker-Hannifin Corporation and IDEX Corporation, reflecting moderate upside potential.
| Company | Target Low | Target High | Consensus |
|---|---|---|---|
| Parker-Hannifin Corporation | 825 | 1,139 | 995.46 |
| IDEX Corporation | 180 | 220 | 205.25 |
The consensus target prices for both stocks sit modestly above current levels, signaling cautious optimism among analysts. Parker-Hannifin’s consensus target exceeds its $935 price by roughly 6%, while IDEX’s $205 target is about 3% above its $199 price.

Don’t Let Luck Decide Your Entry Point
Optimize your entry points with our advanced ProRealTime indicators. You’ll get efficient buy signals with precise price targets for maximum performance. Start outperforming now!
How do institutions grade them?
Parker-Hannifin Corporation Grades
The table below shows recent grades from major financial institutions for Parker-Hannifin Corporation.
| Grading Company | Action | New Grade | Date |
|---|---|---|---|
| Wells Fargo | Maintain | Overweight | 2026-01-30 |
| Citigroup | Maintain | Buy | 2026-01-30 |
| JP Morgan | Maintain | Overweight | 2026-01-30 |
| Jefferies | Maintain | Buy | 2026-01-30 |
| Barclays | Maintain | Overweight | 2026-01-30 |
| Stifel | Maintain | Hold | 2026-01-30 |
| Morgan Stanley | Maintain | Equal Weight | 2026-01-14 |
IDEX Corporation Grades
The table below lists recent grades issued by respected financial firms for IDEX Corporation.
| Grading Company | Action | New Grade | Date |
|---|---|---|---|
| Stifel | Maintain | Buy | 2026-01-23 |
| Citigroup | Maintain | Buy | 2025-12-08 |
| RBC Capital | Maintain | Outperform | 2025-10-30 |
| Oppenheimer | Maintain | Outperform | 2025-10-07 |
| DA Davidson | Maintain | Neutral | 2025-08-04 |
Which company has the best grades?
IDEX Corporation consistently earns “Buy” and “Outperform” ratings from top-tier firms, reflecting stronger institutional confidence. Parker-Hannifin’s grades range from “Hold” to “Buy/Overweight,” suggesting a more cautious outlook. Investors may perceive IDEX as having a more favorable growth trajectory based on these grades.
Risks specific to each company
The following categories identify critical pressure points and systemic threats facing Parker-Hannifin Corporation and IDEX Corporation in the 2026 market environment:
1. Market & Competition
Parker-Hannifin Corporation
- Faces intense competition in diversified industrial and aerospace sectors, requiring constant innovation and cost control.
IDEX Corporation
- Operates in niche fluid and safety technology markets with steady demand but faces pressure from specialized competitors.
2. Capital Structure & Debt
Parker-Hannifin Corporation
- Maintains moderate leverage (D/E 0.69) with neutral debt-to-assets at 32.16%, manageable interest coverage at 11.04x.
IDEX Corporation
- Shows lower leverage (D/E 0.52) and stronger debt-to-assets ratio at 29.45%, with excellent interest coverage of 15.37x, indicating better debt risk profile.
3. Stock Volatility
Parker-Hannifin Corporation
- Beta at 1.25 suggests higher volatility relative to the market, increasing stock price risk for investors.
IDEX Corporation
- Beta near 1.0 indicates stock moves roughly in line with the market, implying lower volatility and risk.
4. Regulatory & Legal
Parker-Hannifin Corporation
- Aerospace segment exposed to stringent regulations and potential legal liabilities affecting compliance costs.
IDEX Corporation
- Faces regulatory scrutiny mainly in health, safety, and environmental standards across its diverse product lines.
5. Supply Chain & Operations
Parker-Hannifin Corporation
- Global operations expose it to supply disruptions and cost inflation risks in raw materials and logistics.
IDEX Corporation
- Smaller scale and diversified segments mitigate some supply chain risks but still vulnerable to global input cost pressures.
6. ESG & Climate Transition
Parker-Hannifin Corporation
- Increasing pressure to reduce emissions and adopt sustainable products, especially in aerospace and industrial markets.
IDEX Corporation
- Actively integrating ESG initiatives, with opportunities in clean tech and safety products, but transition risks remain.
7. Geopolitical Exposure
Parker-Hannifin Corporation
- Significant international footprint exposes it to geopolitical tensions, tariffs, and trade policy shifts.
IDEX Corporation
- More US-focused but with some global exposure, limiting but not eliminating geopolitical risks.
Which company shows a better risk-adjusted profile?
Parker-Hannifin’s key risk lies in market competition and regulatory complexity in aerospace, while IDEX’s greatest risk is managing supply chain pressures amid global cost inflation. IDEX’s stronger balance sheet, lower leverage, and stable stock volatility give it a marginally better risk-adjusted profile. Notably, IDEX’s interest coverage at 15.37x contrasts favorably with Parker-Hannifin’s 11.04x, underscoring superior debt service capacity.
Final Verdict: Which stock to choose?
Parker-Hannifin’s superpower lies in its durable competitive advantage, evidenced by a growing ROIC well above its cost of capital. It operates as a highly efficient value creator with strong profitability. A point of vigilance is its elevated price-to-book multiple, which suggests premium valuation risk. It suits portfolios seeking aggressive growth with robust quality.
IDEX offers a strategic moat through its solid balance sheet and recurring cash flow safety. It maintains favorable liquidity and less financial risk compared to Parker-Hannifin. However, its declining ROIC signals caution on long-term value creation. I view it as fitting for investors prioritizing stable growth with reasonable valuation—a classic GARP profile.
If you prioritize durable value creation and can tolerate valuation premiums, Parker-Hannifin outshines with superior profitability and a strong economic moat. However, if you seek better financial stability and downside protection, IDEX offers a safer profile despite its weaker capital efficiency. Both present slightly favorable cases, but your choice hinges on your risk appetite and growth preference.
Disclaimer: Investment carries a risk of loss of initial capital. The past performance is not a reliable indicator of future results. Be sure to understand risks before making an investment decision.
Go Further
I encourage you to read the complete analyses of Parker-Hannifin Corporation and IDEX Corporation to enhance your investment decisions: