Home > Comparison > Industrials > OTIS vs IEX
The strategic rivalry between Otis Worldwide Corporation and IDEX Corporation shapes the Industrials sector’s machinery landscape. Otis operates as a capital-intensive leader in elevator and escalator manufacturing and services. In contrast, IDEX excels as a diversified applied solutions provider across fluidics, health sciences, and safety segments. This analysis will discern which business model delivers superior risk-adjusted returns for a diversified portfolio amid evolving industrial dynamics.
Table of contents
Companies Overview
Otis Worldwide Corporation and IDEX Corporation both hold significant influence in the industrial machinery sector.
Otis Worldwide Corporation: Global Elevator and Escalator Leader
Otis Worldwide Corporation dominates elevator and escalator manufacturing. It generates revenue through new equipment sales and extensive maintenance services. In 2026, Otis focuses on expanding its service network with 34,000 mechanics and modernizing infrastructure globally, solidifying its competitive advantage in maintenance and modernization.
IDEX Corporation: Applied Solutions Specialist
IDEX Corporation excels in designing and distributing fluid handling, health science, and fire safety products. Its revenue stems from diverse segments including pumps, precision fluidics, and firefighting equipment. The company’s 2026 strategy emphasizes innovation across Fluid & Metering Technologies and Health & Science, targeting industrial, pharmaceutical, and safety markets.
Strategic Collision: Similarities & Divergences
Otis and IDEX share a foundation in industrial machinery but diverge in approach. Otis builds a closed ecosystem around elevators with a vast service network. IDEX offers an open portfolio targeting fluidics and safety solutions. Their primary battleground is industrial infrastructure, yet Otis leans on scale and service, while IDEX bets on diversified innovation. This creates distinct investment profiles: Otis as a steady, service-driven giant and IDEX as a nimble, technology-focused player.
Income Statement Comparison
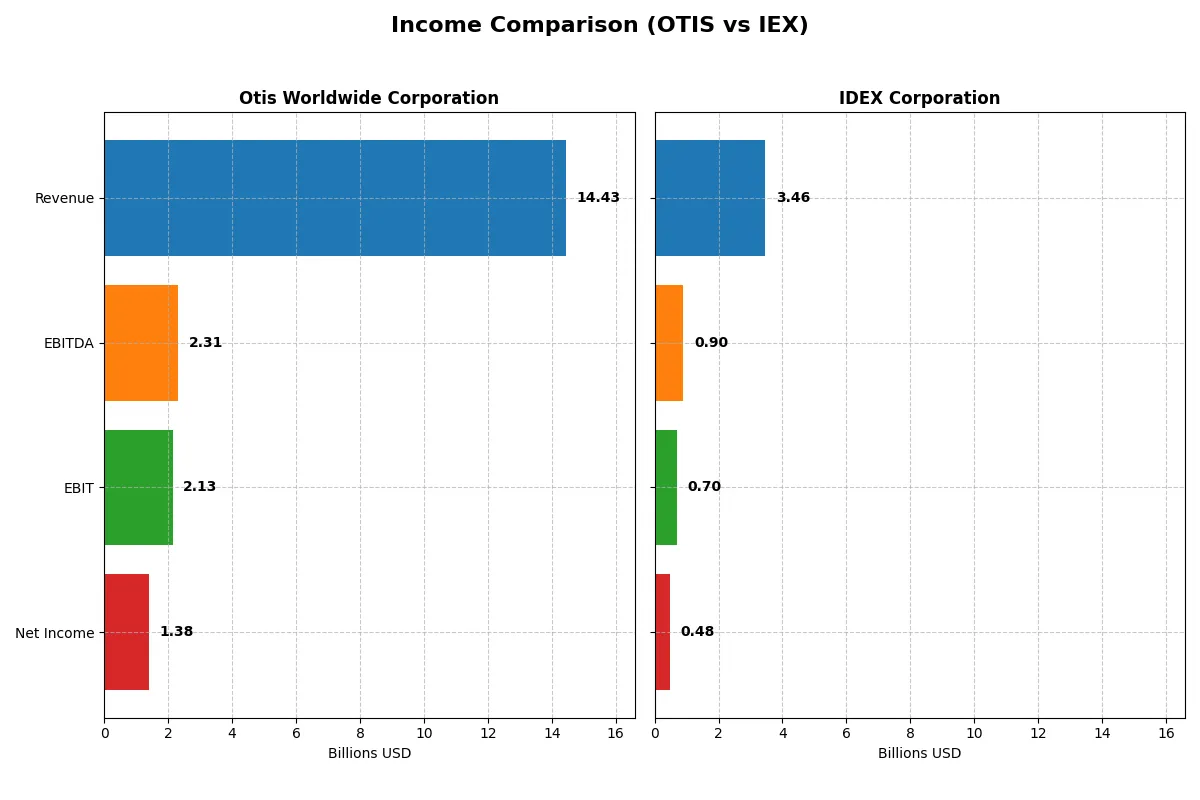
This data dissects the core profitability and scalability of both corporate engines to reveal who dominates the bottom line:
| Metric | Otis Worldwide Corporation (OTIS) | IDEX Corporation (IEX) |
|---|---|---|
| Revenue | 14.43B | 3.46B |
| Cost of Revenue | 10.06B | 1.92B |
| Operating Expenses | 2.24B | 819M |
| Gross Profit | 4.37B | 1.54B |
| EBITDA | 2.31B | 904M |
| EBIT | 2.13B | 697M |
| Interest Expense | 196M | 64M |
| Net Income | 1.38B | 483M |
| EPS | 3.53 | 6.41 |
| Fiscal Year | 2025 | 2025 |
Income Statement Analysis: The Bottom-Line Duel
This income statement comparison reveals the operational efficiency and profitability momentum of Otis Worldwide Corporation and IDEX Corporation.
Otis Worldwide Corporation Analysis
Otis’s revenue shows modest growth, reaching $14.4B in 2025, with net income at $1.38B. Its gross margin of 30.3% and net margin of 9.6% remain favorable. Despite a slight revenue growth slowdown, Otis maintains solid operating efficiency, though its net margin and EPS dipped in the latest year, signaling margin pressure.
IDEX Corporation Analysis
IDEX demonstrates stronger revenue momentum, growing 5.8% to $3.46B in 2025, with net income at $483M. The company boasts a robust gross margin of 44.5% and net margin near 14%. Slight declines in net margin and EPS occurred recently, but overall revenue and earnings growth remain more consistent than Otis’s.
Margin Resilience vs. Revenue Momentum
Otis delivers steady margin strength with moderate revenue growth, while IDEX outpaces in top-line expansion and margin levels. Otis’s higher scale contrasts with IDEX’s superior profitability ratios. For investors, Otis offers scale stability, whereas IDEX’s profile suits those favoring higher margin efficiency and growth potential.
Financial Ratios Comparison
These vital ratios act as a diagnostic tool to expose the underlying fiscal health, valuation premiums, and capital efficiency of the companies compared below:
| Ratios | Otis Worldwide Corporation (OTIS) | IDEX Corporation (IEX) |
|---|---|---|
| ROE | -25.7% (2025) | 12.0% (2025) |
| ROIC | 40.7% (2025) | 8.6% (2025) |
| P/E | 24.8 (2025) | 27.7 (2025) |
| P/B | -6.38 (2025) | 3.33 (2025) |
| Current Ratio | 0.85 (2025) | 2.86 (2025) |
| Quick Ratio | 0.77 (2025) | 2.02 (2025) |
| D/E | -1.62 (2025) | 0.00017 (2025) |
| Debt-to-Assets | 82.1% (2025) | 0.01% (2025) |
| Interest Coverage | 11.2 (2025) | 11.2 (2025) |
| Asset Turnover | 1.35 (2025) | 0.50 (2025) |
| Fixed Asset Turnover | 11.13 (2025) | 7.39 (2025) |
| Payout ratio | 46.7% (2025) | 44.0% (2025) |
| Dividend yield | 1.88% (2025) | 1.59% (2025) |
| Fiscal Year | 2025 | 2025 |
Efficiency & Valuation Duel: The Vital Signs
Ratios act as a company’s DNA, revealing hidden risks and operational excellence that shape its financial health and market appeal.
Otis Worldwide Corporation
Otis posts a strong 40.7% ROIC, far exceeding its 7.4% WACC, signaling efficient capital use. However, a negative -25.7% ROE and modest 9.6% net margin hint at profitability challenges. Valuation looks reasonable with a 24.9 P/E. A 1.9% dividend yield suggests steady shareholder returns despite operational headwinds.
IDEX Corporation
IDEX shows a healthier 13.98% net margin and positive 12.0% ROE, reflecting solid profitability. Yet, its 8.7% WACC nears the 8.6% ROIC, indicating less capital efficiency. IDEX’s 27.7 P/E and 3.3 P/B ratios mark it as relatively expensive. Dividend yield stands at 1.6%, balancing growth and income.
Premium Valuation vs. Operational Safety
Otis offers superior capital efficiency and a more conservative valuation, but suffers from weak equity returns. IDEX delivers stronger profitability and shareholder returns but trades at a premium with less capital efficiency. Investors favoring operational safety might lean Otis; those seeking consistent profitability may prefer IDEX.
Which one offers the Superior Shareholder Reward?
I observe Otis Worldwide yields 1.88% with a moderate 47% payout ratio and strong free cash flow coverage near 90%. Its buybacks are steady but not aggressive. IDEX yields 1.59%, pays out 44% of earnings, and maintains robust buybacks fueling total returns. Otis’s model leans on reliable dividends and modest buybacks, supporting sustainability amid its capital intensity. IDEX balances dividends with more intense repurchases, leveraging strong margins and cash flow for growth reinvestment. In 2026, I favor IDEX for superior total return potential, driven by a more dynamic buyback program and higher operational profitability.
Comparative Score Analysis: The Strategic Profile
The radar chart exposes the core DNA and trade-offs between Otis Worldwide and IDEX Corporation, revealing their strategic strengths and weaknesses across key financial metrics:
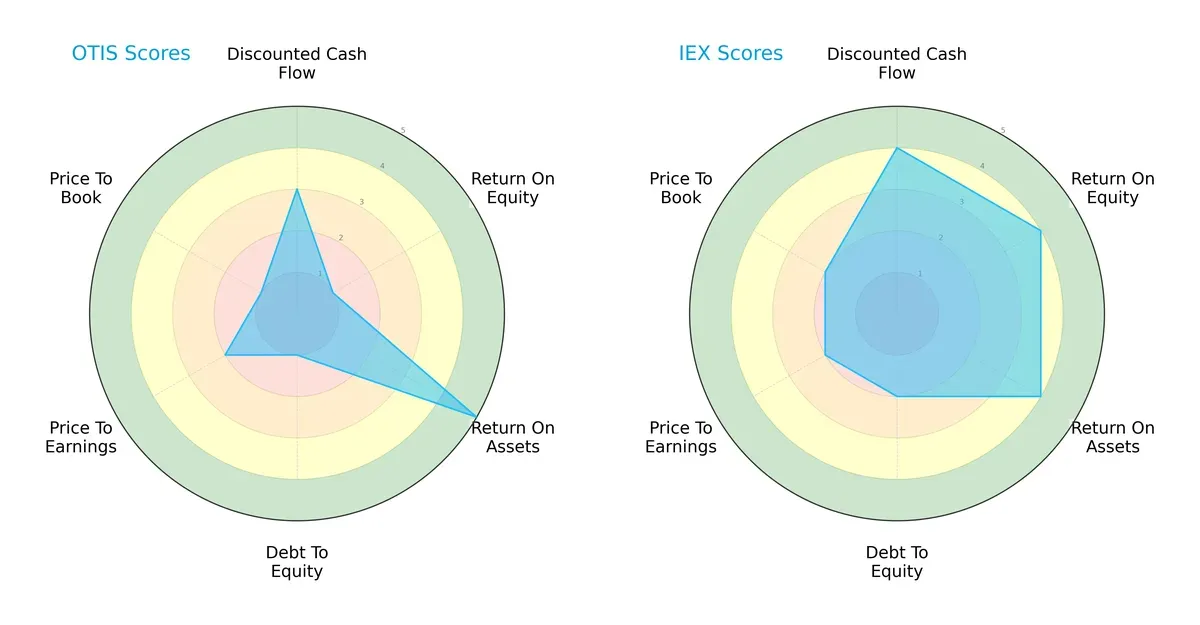
I’ve observed that IDEX boasts a more balanced financial profile, excelling in DCF, ROE, and ROA scores, which signals efficient capital allocation and profitability. Otis leans heavily on asset utilization (high ROA) but suffers from poor equity returns and heavy leverage. IDEX’s moderate debt and valuation scores suggest prudent risk management, while Otis’s low debt-to-equity rating flags potential financial risk.
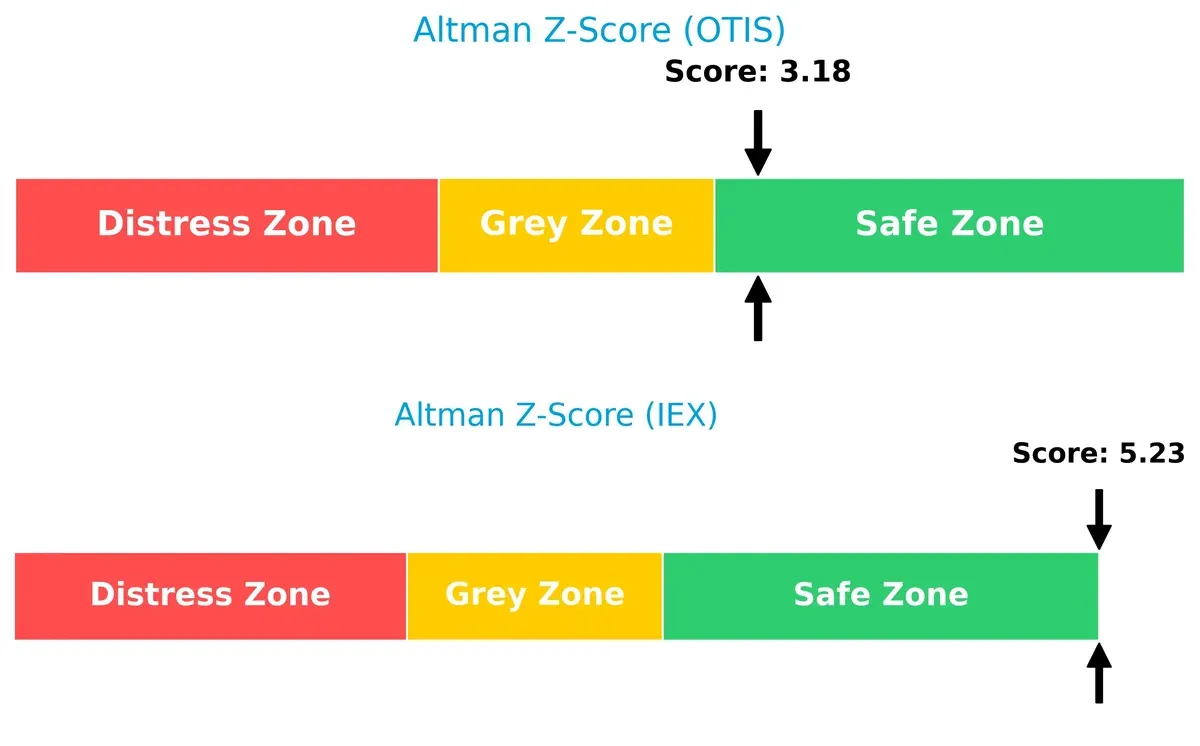
Bankruptcy Risk: Solvency Showdown
IDEX’s Altman Z-Score of 5.23 far exceeds Otis’s 3.18, both safely above the distress threshold. This gap implies IDEX holds superior long-term solvency in the current economic cycle:
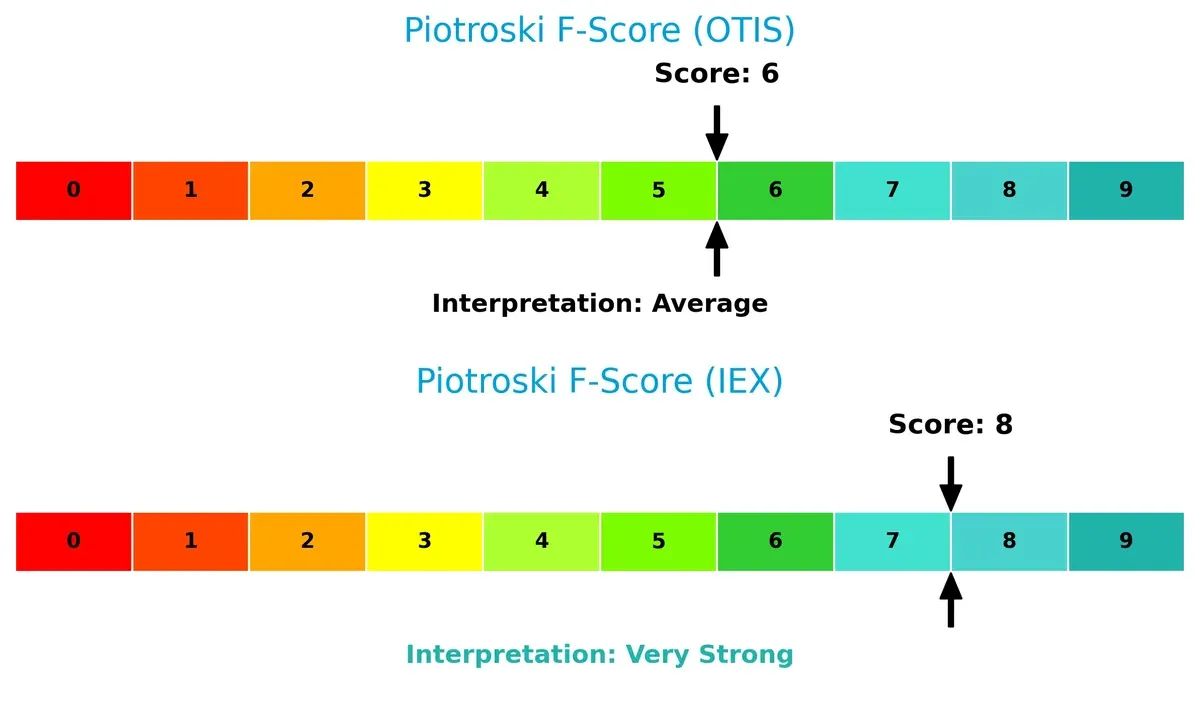
Financial Health: Quality of Operations
IDEX’s Piotroski F-Score of 8 indicates very strong internal financial health, outperforming Otis’s average score of 6. Otis shows mild red flags in operational efficiency and profitability metrics compared to IDEX:
How are the two companies positioned?
This section dissects Otis and IDEX’s operational DNA by comparing revenue distribution and internal strengths and weaknesses. The goal is to confront their economic moats and identify which model delivers the most resilient competitive advantage.
Revenue Segmentation: The Strategic Mix
This visual comparison dissects how Otis Worldwide Corporation and IDEX Corporation diversify their income streams and where their primary sector bets lie:
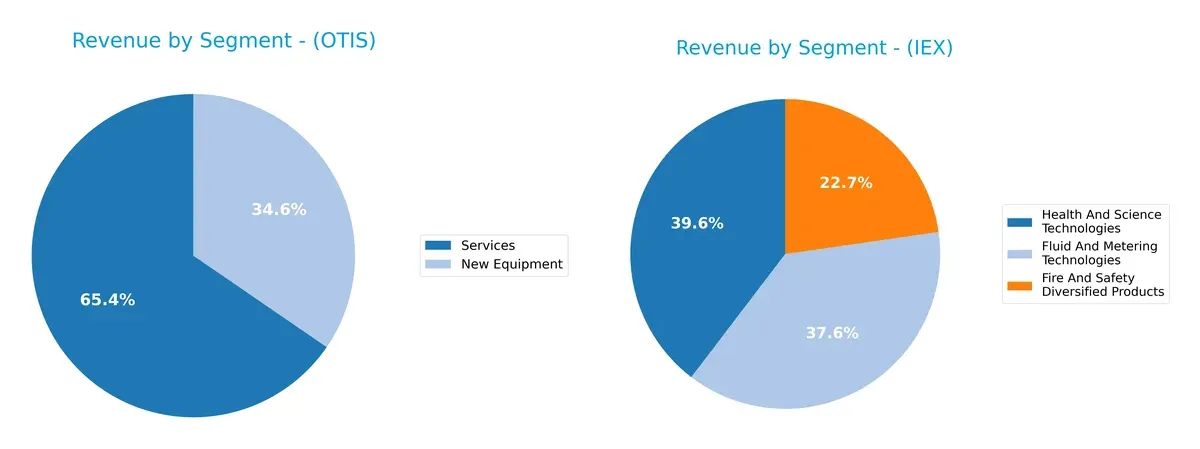
Otis anchors its revenue with $9.4B from Services, dwarfing $5B in New Equipment, showing a clear reliance on its service ecosystem. IDEX showcases a more balanced mix: Health and Science Technologies leads at $1.3B, closely followed by Fluid and Metering at $1.2B, and Fire and Safety at $744M. Otis’s concentration risks contrast with IDEX’s diversified portfolio, which mitigates sector volatility and supports resilient growth.
Strengths and Weaknesses Comparison
This table compares the strengths and weaknesses of Otis Worldwide Corporation and IDEX Corporation:
Otis Strengths
- Strong roic at 40.74% vs wacc 7.37%
- Favorable asset and fixed asset turnover ratios
- Solid interest coverage ratio
- Diversified revenue from New Equipment and Services
- Significant global presence with substantial US and China sales
IDEX Strengths
- Higher net margin at 13.98%
- Strong current and quick ratios above 2.0
- Low debt to assets ratio at 0.01%
- Favorable interest coverage ratio
- Diversified segments across Health, Fire, and Fluid Technologies
- Balanced geographic exposure with US and Europe focus
Otis Weaknesses
- Negative roe at -25.67%
- Low current and quick ratios below 1.0 indicate liquidity risk
- High debt to assets at 82.14%
- Negative pb ratio, potential valuation concern
- Neutral net margin and pe ratio
IDEX Weaknesses
- Higher pe at 27.73 and unfavorable pb at 3.33
- Lower asset turnover at 0.5 suggests less efficient use of assets
- Neutral roic and wacc indicate weaker capital efficiency
- Smaller scale in Asia compared to Otis
Otis excels in capital efficiency and turnover metrics but faces liquidity and leverage concerns. IDEX shows profitability strength and balance sheet health but trades at a premium and lags in asset utilization. Both companies exhibit slightly favorable overall financial profiles with contrasting strategic priorities.
The Moat Duel: Analyzing Competitive Defensibility
A structural moat is the essential bulwark protecting long-term profits from relentless competition erosion. Let’s dissect how Otis and IDEX defend their turf:
Otis Worldwide Corporation: Service Network & Brand Power
Otis leverages a vast service network and strong brand intangible assets. This moat delivers stable 15% EBIT margins and growing ROIC, signaling robust value creation. Expansion into modernization and infrastructure projects in 2026 could deepen its moat.
IDEX Corporation: Diverse Applied Solutions & Product Innovation
IDEX’s moat stems from diverse, specialized products across fluidics and safety segments. However, its declining ROIC and shrinking margins contrast sharply with Otis. New markets in health sciences offer growth, but operational efficiency must improve to sustain advantage.
Verdict: Service Network Moat vs. Product Diversification Challenge
Otis possesses the deeper moat, demonstrated by a 33% ROIC premium over WACC and rising profitability. IDEX’s shrinking returns underline a value erosion risk. Otis is better equipped to defend and grow its market share in 2026.
Which stock offers better returns?
Over the past year, both Otis Worldwide Corporation and IDEX Corporation experienced notable price declines followed by distinct recent rallies, reflecting contrasting momentum in their trading dynamics.
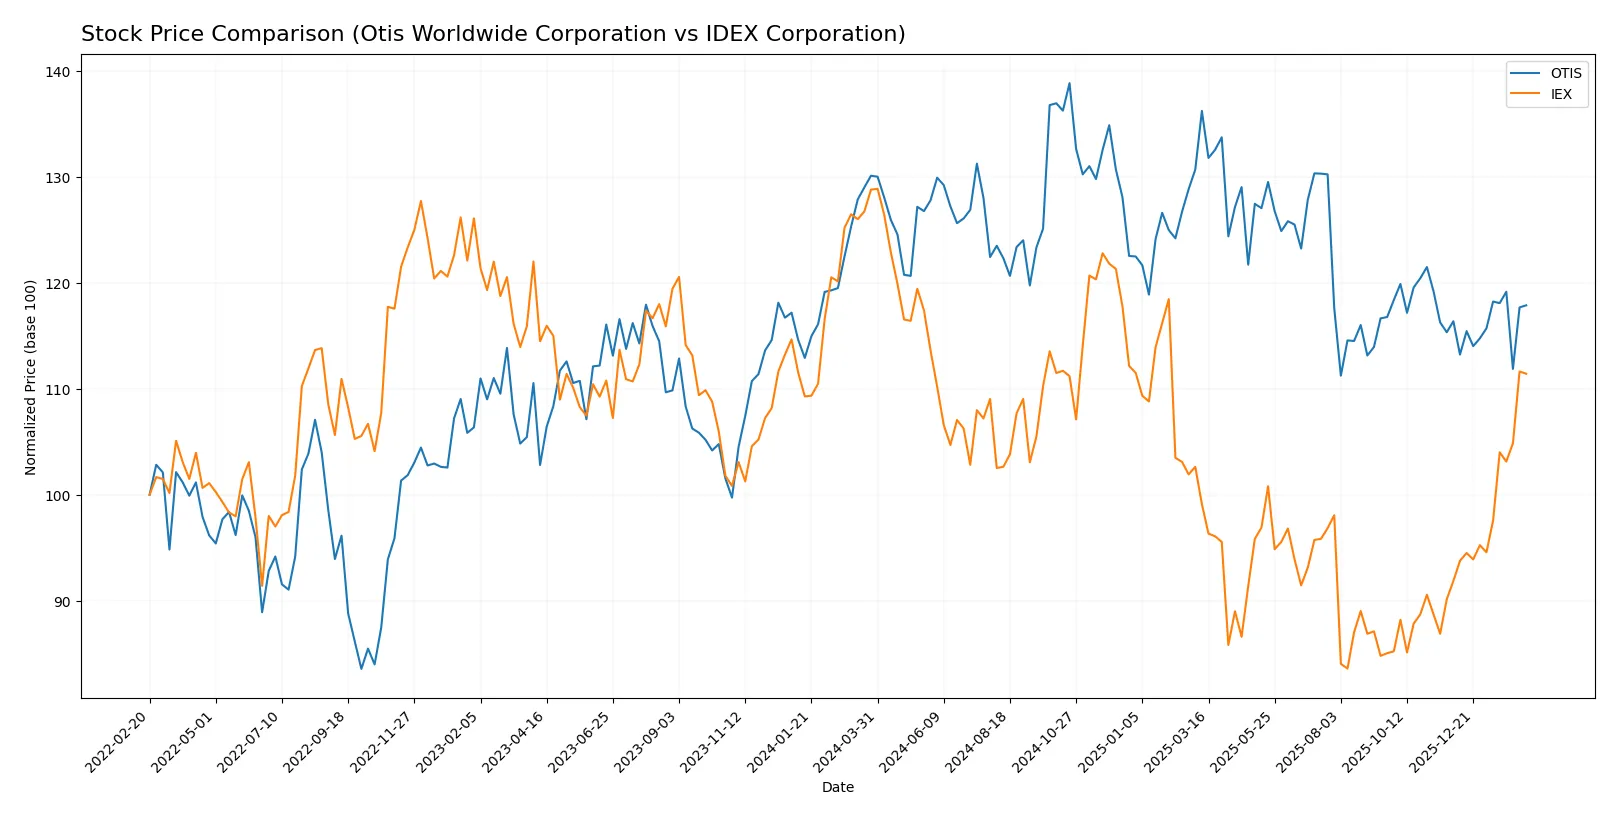
Trend Comparison
Otis Worldwide Corporation’s stock fell 9.4% over the last 12 months, showing a bearish trend with accelerating decline and moderate volatility. The price ranged between 84.93 and 106.01.
IDEX Corporation declined 13.49% over the year, marking a bearish trend with accelerating losses and significantly higher volatility. The price fluctuated from 158.26 to 244.02.
Recently, IDEX reversed sharply with a 21.29% gain versus Otis’s 1.29%, giving IDEX stronger short-term performance despite its larger annual decline.
Target Prices
Analysts show a bullish consensus for Otis Worldwide Corporation and IDEX Corporation with clear upside potential.
| Company | Target Low | Target High | Consensus |
|---|---|---|---|
| Otis Worldwide Corporation | 92 | 109 | 97.75 |
| IDEX Corporation | 220 | 247 | 236.2 |
Otis trades below its consensus target, suggesting room for growth. IDEX’s target consensus exceeds the current price by over 10%, signaling positive analyst expectations across the board.

Don’t Let Luck Decide Your Entry Point
Optimize your entry points with our advanced ProRealTime indicators. You’ll get efficient buy signals with precise price targets for maximum performance. Start outperforming now!
How do institutions grade them?
Otis Worldwide Corporation Grades
The table below summarizes recent grades from key institutions for Otis Worldwide Corporation.
| Grading Company | Action | New Grade | Date |
|---|---|---|---|
| JP Morgan | Maintain | Overweight | 2026-01-16 |
| Wells Fargo | Maintain | Equal Weight | 2025-12-15 |
| Barclays | Maintain | Underweight | 2025-10-30 |
| JP Morgan | Maintain | Overweight | 2025-10-15 |
| Wolfe Research | Upgrade | Outperform | 2025-10-08 |
| Wells Fargo | Maintain | Equal Weight | 2025-10-06 |
| JP Morgan | Maintain | Overweight | 2025-09-18 |
| RBC Capital | Maintain | Outperform | 2025-07-28 |
| Wolfe Research | Upgrade | Peer Perform | 2025-07-25 |
| JP Morgan | Maintain | Overweight | 2025-07-24 |
IDEX Corporation Grades
The table below summarizes recent grades from key institutions for IDEX Corporation.
| Grading Company | Action | New Grade | Date |
|---|---|---|---|
| Argus Research | Upgrade | Buy | 2026-02-06 |
| TD Cowen | Maintain | Buy | 2026-02-05 |
| Citigroup | Maintain | Buy | 2026-02-05 |
| DA Davidson | Maintain | Neutral | 2026-02-05 |
| RBC Capital | Maintain | Outperform | 2026-02-05 |
| Stifel | Maintain | Buy | 2026-01-23 |
| Citigroup | Maintain | Buy | 2025-12-08 |
| RBC Capital | Maintain | Outperform | 2025-10-30 |
| Stifel | Maintain | Buy | 2025-10-20 |
| Oppenheimer | Maintain | Outperform | 2025-10-07 |
Which company has the best grades?
IDEX Corporation holds generally stronger and more consistent buy and outperform ratings compared to Otis Worldwide. This suggests greater institutional confidence in IDEX’s near-term prospects, which may attract more investor interest and support valuation stability.
Risks specific to each company
The following categories identify critical pressure points and systemic threats facing Otis Worldwide Corporation and IDEX Corporation in the 2026 market environment:
1. Market & Competition
Otis Worldwide Corporation
- Faces pressure from established elevator and escalator firms amid slow urban infrastructure growth.
IDEX Corporation
- Competes across diverse industrial segments with niche products, challenged by innovation demands.
2. Capital Structure & Debt
Otis Worldwide Corporation
- High debt-to-assets ratio (82.14%) signals leverage risk despite strong interest coverage.
IDEX Corporation
- Virtually no debt, reflecting a conservative capital structure and low financial risk.
3. Stock Volatility
Otis Worldwide Corporation
- Beta near 1.01 indicates market-level volatility, slightly sensitive to economic cycles.
IDEX Corporation
- Beta at 0.98 suggests somewhat lower volatility, implying steadier stock performance.
4. Regulatory & Legal
Otis Worldwide Corporation
- Subject to safety and building regulations worldwide, exposing it to compliance costs.
IDEX Corporation
- Operates in regulated industrial and health sectors, facing evolving safety and environmental standards.
5. Supply Chain & Operations
Otis Worldwide Corporation
- Global service network requires robust logistics; supply disruptions could hurt maintenance revenue.
IDEX Corporation
- Diverse product lines increase operational complexity and supply chain vulnerability.
6. ESG & Climate Transition
Otis Worldwide Corporation
- Pressure to improve energy efficiency in products and reduce carbon footprint in operations.
IDEX Corporation
- Faces challenges integrating sustainable technologies across fluid and safety products.
7. Geopolitical Exposure
Otis Worldwide Corporation
- International operations expose it to geopolitical risks, especially in China and emerging markets.
IDEX Corporation
- Global footprint is smaller but still vulnerable to trade tensions and regional instability.
Which company shows a better risk-adjusted profile?
I identify Otis’s excessive leverage as its most significant risk, threatening financial flexibility despite solid operational metrics. IDEX’s key risk lies in competitive pressures across its complex segments, risking margin compression. Overall, IDEX displays a superior risk-adjusted profile, supported by its strong liquidity, low debt, and very strong Piotroski score. Otis’s elevated debt-to-assets ratio of 82.14% justifies caution, as it amplifies vulnerability to economic downturns and rising interest rates.
Final Verdict: Which stock to choose?
Otis Worldwide Corporation’s superpower lies in its exceptional capital efficiency, demonstrated by a very favorable and growing ROIC well above its WACC. This edge drives sustainable value creation despite some liquidity constraints, marking it as a strong candidate for investors focused on disciplined capital allocation and long-term operational strength. It fits well within an Aggressive Growth portfolio.
IDEX Corporation offers a strategic moat grounded in robust recurring revenue and solid balance sheet liquidity, reflected by its strong current and quick ratios. While its ROIC trails its cost of capital, its financial stability and consistent free cash flow make it a safer pick relative to Otis. This positions IDEX as suitable for GARP investors seeking growth with measured risk.
If you prioritize superior capital efficiency and value creation through operational excellence, Otis outshines due to its sustainable competitive advantage and very favorable moat metrics. However, if you seek better liquidity and a more stable financial profile with steady free cash flow, IDEX offers better stability despite a weaker moat. Each company aligns with distinct investor risk tolerances and strategy preferences.
Disclaimer: Investment carries a risk of loss of initial capital. The past performance is not a reliable indicator of future results. Be sure to understand risks before making an investment decision.
Go Further
I encourage you to read the complete analyses of Otis Worldwide Corporation and IDEX Corporation to enhance your investment decisions: