In the competitive landscape of industrial machinery, IDEX Corporation (IEX) and Nordson Corporation (NDSN) stand out as leaders driving innovation and precision solutions. Both companies specialize in fluid handling and dispensing technologies, serving overlapping markets that range from manufacturing to healthcare. This comparison explores their strategic positioning and growth prospects to help you decide which stock may offer the most compelling opportunity for your investment portfolio.
Table of contents
Companies Overview
I will begin the comparison between IDEX Corporation and Nordson Corporation by providing an overview of these two companies and their main differences.
IDEX Corporation Overview
IDEX Corporation operates globally through three segments: Fluid & Metering Technologies, Health & Science Technologies, and Fire & Safety/Diversified Products. The company focuses on designing and producing fluid-handling equipment, precision fluidics, medical devices, and firefighting tools. Headquartered in Northbrook, Illinois, IDEX serves a diverse range of industries including food, chemical, pharmaceutical, and defense.
Nordson Corporation Overview
Nordson Corporation engineers and manufactures dispensing and coating systems for adhesives, polymers, and other fluids worldwide. It operates via two segments: Industrial Precision Solutions and Advanced Technology Solutions, providing automated and manual dispensing products, surface treatment equipment, and inspection systems. Founded in 1935, Nordson is headquartered in Westlake, Ohio, and serves various industrial and semiconductor markets.
Key similarities and differences
Both IDEX and Nordson are industrial machinery companies specializing in fluid handling and dispensing technologies. While IDEX offers a broader product range including medical and firefighting equipment, Nordson focuses more on precision dispensing and coating systems with advanced technology applications. Both companies market globally and serve diverse industries but differ in their segment structures and product specialization.
Income Statement Comparison
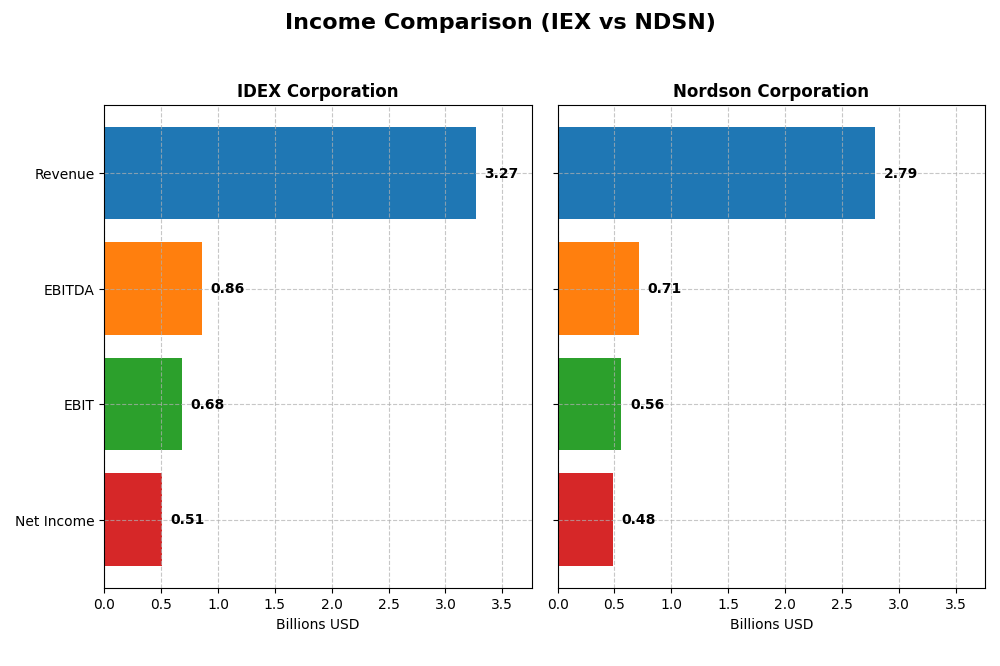
The table below presents a side-by-side comparison of key income statement metrics for IDEX Corporation and Nordson Corporation for their most recent fiscal years.
| Metric | IDEX Corporation (2024) | Nordson Corporation (2025) |
|---|---|---|
| Market Cap | 13.9B | 14.6B |
| Revenue | 3.27B | 2.79B |
| EBITDA | 859M | 712M |
| EBIT | 684M | 561M |
| Net Income | 505M | 484M |
| EPS | 6.67 | 8.56 |
| Fiscal Year | 2024 | 2025 |
Income Statement Interpretations
IDEX Corporation
Between 2020 and 2024, IDEX Corporation’s revenue grew 39% to $3.27B, while net income increased 33.7% to $505M. Margins showed mixed trends: gross margin remained favorable at 46.4%, but net margin declined by 15.15% in the last year to 15.45%. The latest year saw a slight revenue dip and margin compression, signaling short-term softness despite solid overall growth.
Nordson Corporation
Nordson’s revenue rose 18.2% from 2021 to 2025, reaching $2.79B, with net income up 6.6% to $484M. Its gross margin is strong at 55.16%, and net margin stable at 17.35%, though the net margin slightly contracted recently. The most recent year showed moderate revenue and profit expansion, but EBIT declined by 16.8%, indicating some margin pressure despite ongoing top-line gains.
Which one has the stronger fundamentals?
Both companies present favorable income statement fundamentals, with Nordson holding higher gross and net margins, while IDEX exhibits stronger revenue and net income growth over the longer term. IDEX’s recent margin deterioration contrasts with Nordson’s more stable profitability metrics. Overall, Nordson shows more margin resilience, whereas IDEX demonstrates stronger absolute growth, reflecting differing strengths in their financial profiles.
Financial Ratios Comparison
Below is a comparison of key financial ratios for IDEX Corporation (IEX) and Nordson Corporation (NDSN) based on their most recent fiscal year data.
| Ratios | IDEX Corporation (IEX) 2024 | Nordson Corporation (NDSN) 2025 |
|---|---|---|
| ROE | 13.31% | 15.92% |
| ROIC | 8.81% | 10.49% |
| P/E | 31.37 | 27.10 |
| P/B | 4.18 | 4.31 |
| Current Ratio | 2.53 | 1.64 |
| Quick Ratio | 1.85 | 1.05 |
| D/E (Debt-to-Equity) | 0.52 | 0.69 |
| Debt-to-Assets | 29.45% | 35.36% |
| Interest Coverage | 15.66 | 7.04 |
| Asset Turnover | 0.48 | 0.47 |
| Fixed Asset Turnover | 7.10 | 4.70 |
| Payout Ratio | 40.65% | 36.96% |
| Dividend Yield | 1.30% | 1.36% |
Interpretation of the Ratios
IDEX Corporation
IDEX shows a balanced set of ratios with favorable net margin (15.45%) and interest coverage (15.37), indicating healthy profitability and debt service capacity. However, its high P/E (31.37) and P/B (4.18) ratios are less attractive, and asset turnover is weak at 0.48. The company pays dividends with a neutral yield of 1.3%, suggesting moderate shareholder returns without apparent payout risks.
Nordson Corporation
Nordson exhibits stronger profitability ratios than IDEX, including a favorable net margin of 17.35%, ROE at 15.92%, and ROIC at 10.49%. Its debt profile is slightly riskier with a net debt to EBITDA ratio around 2.7 but interest coverage remains adequate at 5.55. The dividend yield is neutral at 1.36%, reflecting steady payouts aligned with earnings and cash flow stability.
Which one has the best ratios?
Both IDEX and Nordson have a mix of favorable and neutral ratios, with identical overall ratings of slightly favorable. Nordson’s profitability and returns on equity and invested capital are somewhat stronger, while IDEX maintains better interest coverage and liquidity ratios. Each company presents trade-offs between growth valuation and operational efficiency measures.
Strategic Positioning
This section compares the strategic positioning of IDEX Corporation and Nordson Corporation, covering market position, key segments, and exposure to technological disruption:
IDEX Corporation
- Operates in industrial machinery with moderate competitive pressure on NYSE.
- Diversified segments: Fluid & Metering, Health & Science, Fire & Safety.
- Exposure to technological disruption through precision fluidics and automated dispensing systems.
Nordson Corporation
- Industrial machinery player with competitive pressure on NASDAQ.
- Key segments: Industrial Precision, Advanced Technology, Medical & Fluid.
- Faces disruption via advanced dispensing, coating, and automated inspection technologies.
IDEX Corporation vs Nordson Corporation Positioning
IDEX’s diversified portfolio spans multiple industrial and safety markets, while Nordson concentrates on precision dispensing and coating solutions. IDEX benefits from broader market exposure; Nordson focuses on specialized technology-driven segments.
Which has the best competitive advantage?
Nordson shows a slightly favorable moat by creating value despite declining ROIC, while IDEX is slightly unfavorable, shedding value with declining profitability, indicating Nordson’s stronger competitive advantage based on MOAT evaluation.
Stock Comparison
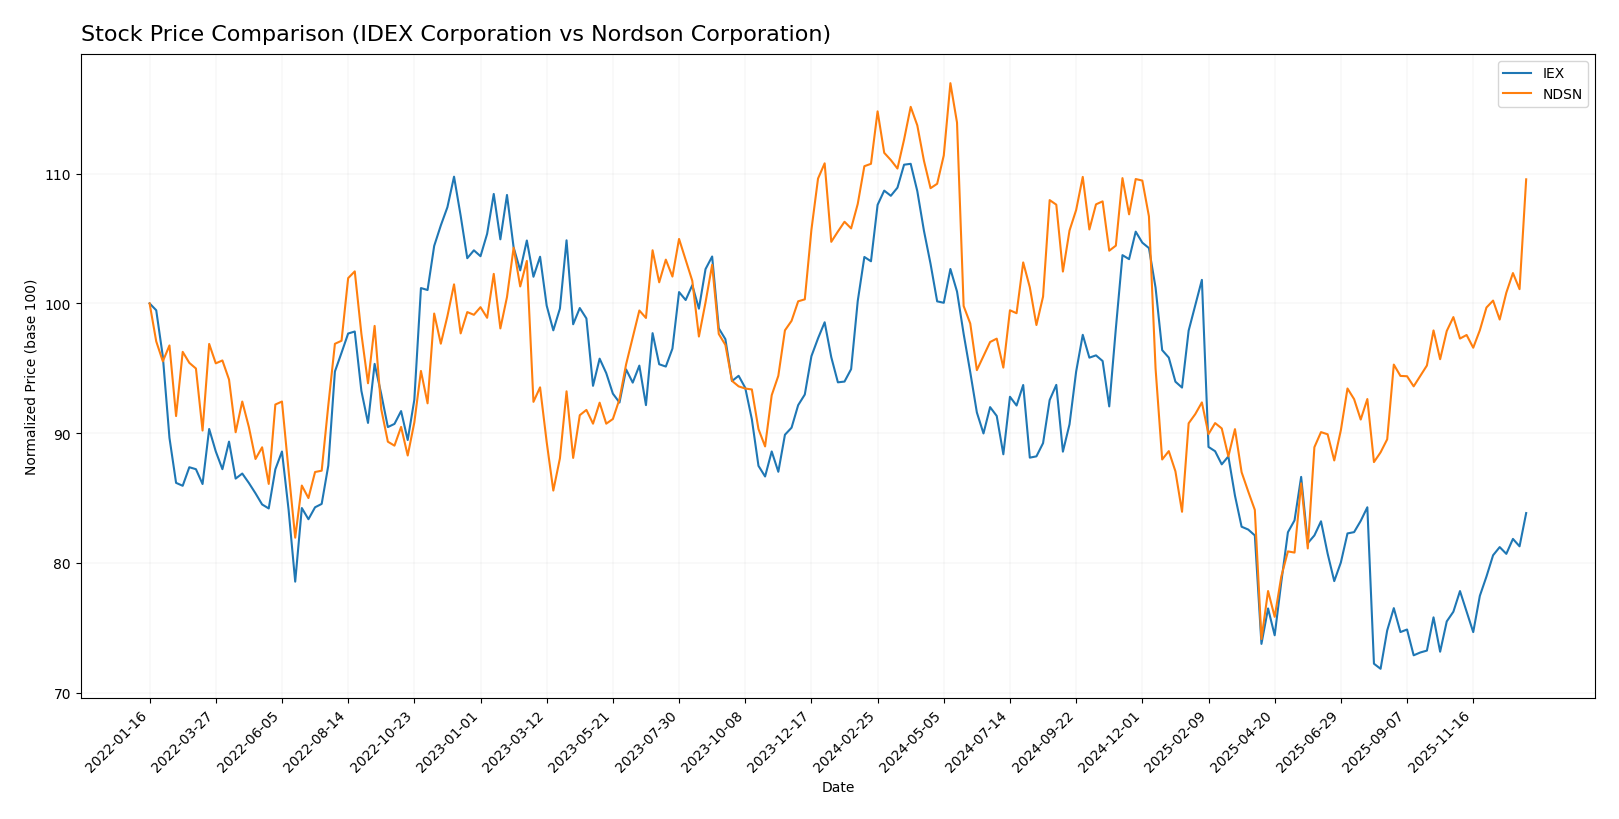
The stock prices of IDEX Corporation (IEX) and Nordson Corporation (NDSN) have shown notable price movements and trading dynamics over the past year, reflecting distinct bearish trends with recent acceleration and increasing buyer dominance.
Trend Analysis
IDEX Corporation’s stock experienced a bearish trend over the past 12 months with a price decrease of 18.8%, showing acceleration and a high volatility level (std deviation 24.02). It reached a high of 244.02 and a low of 158.26.
Nordson Corporation’s stock showed a near-neutral overall trend with a slight bearish tilt of -1.08% over the same period, also with acceleration and volatility (std deviation 23.45). Its price ranged from 176.73 to 278.89.
Comparing recent trends from October 2025 to January 2026, both stocks gained around 10%, with NDSN slightly outperforming IEX in market performance during this timeframe.
Target Prices
The consensus target prices from verified analysts indicate moderate upside potential for both IDEX Corporation and Nordson Corporation.
| Company | Target High | Target Low | Consensus |
|---|---|---|---|
| IDEX Corporation | 210 | 180 | 194 |
| Nordson Corporation | 295 | 240 | 274.17 |
Analysts expect IDEX shares to rise slightly above the current price of $184.71, with a consensus target of $194. Nordson’s consensus target at $274.17 suggests a reasonable upside compared to its current price of $261.22.
Analyst Opinions Comparison
This section compares analysts’ ratings and grades for IDEX Corporation and Nordson Corporation:
Rating Comparison
IEX Rating
- Rating: B+, categorized as Very Favorable by analysts.
- Discounted Cash Flow Score: 4, indicating a Favorable valuation based on cash flow projections.
- ROE Score: 4, showing efficient profit generation from shareholders’ equity.
- ROA Score: 4, reflecting effective asset utilization.
- Debt To Equity Score: 2, indicating moderate financial risk exposure.
- Overall Score: 3, reflecting a Moderate overall assessment.
NDSN Rating
- Rating: B, also considered Very Favorable by analysts.
- Discounted Cash Flow Score: 3, representing a Moderate valuation outlook.
- ROE Score: 4, equally showing strong profit efficiency.
- ROA Score: 4, matching IEX in asset utilization efficiency.
- Debt To Equity Score: 2, similarly moderate financial risk.
- Overall Score: 3, equally Moderate in overall rating.
Which one is the best rated?
IDEX Corporation holds a slightly higher rating of B+ compared to Nordson’s B, supported by a stronger discounted cash flow score. Both companies share identical scores in ROE, ROA, debt to equity, and overall score, making IDEX marginally better rated based on the provided data.
Scores Comparison
Here is a comparison of the financial scores for IDEX Corporation and Nordson Corporation:
IEX Scores
- Altman Z-Score: 4.48, indicating a safe zone with low bankruptcy risk.
- Piotroski Score: 7, reflecting strong financial health and value potential.
NDSN Scores
- Altman Z-Score: 4.90, indicating a safe zone with low bankruptcy risk.
- Piotroski Score: 7, reflecting strong financial health and value potential.
Which company has the best scores?
Both IDEX and Nordson have Altman Z-Scores well within the safe zone and identical Piotroski Scores of 7, indicating similarly strong financial health and low bankruptcy risk based on the available data.
Grades Comparison
Here is the comparison of recent grades and ratings for IDEX Corporation and Nordson Corporation:
IDEX Corporation Grades
The table below shows recent grades issued by recognized grading companies for IDEX Corporation.
| Grading Company | Action | New Grade | Date |
|---|---|---|---|
| Citigroup | Maintain | Buy | 2025-12-08 |
| RBC Capital | Maintain | Outperform | 2025-10-30 |
| Stifel | Maintain | Buy | 2025-10-20 |
| Oppenheimer | Maintain | Outperform | 2025-10-07 |
| DA Davidson | Maintain | Neutral | 2025-08-04 |
| Stifel | Maintain | Buy | 2025-07-31 |
| RBC Capital | Maintain | Outperform | 2025-07-31 |
| Oppenheimer | Maintain | Outperform | 2025-07-31 |
| Stifel | Maintain | Buy | 2025-07-21 |
| Citigroup | Maintain | Buy | 2025-07-14 |
The grades for IDEX Corporation predominantly show a Buy or Outperform consensus, with one Neutral rating, indicating a generally positive outlook from analysts.
Nordson Corporation Grades
The table below presents recent grades from reputable grading companies for Nordson Corporation.
| Grading Company | Action | New Grade | Date |
|---|---|---|---|
| DA Davidson | Maintain | Buy | 2025-12-12 |
| Baird | Maintain | Neutral | 2025-12-12 |
| DA Davidson | Maintain | Buy | 2025-12-11 |
| Keybanc | Maintain | Overweight | 2025-12-11 |
| Oppenheimer | Maintain | Outperform | 2025-08-25 |
| Baird | Maintain | Neutral | 2025-08-22 |
| Keybanc | Maintain | Overweight | 2025-07-15 |
| Baird | Maintain | Neutral | 2025-05-30 |
| Oppenheimer | Upgrade | Outperform | 2025-05-30 |
| Keybanc | Maintain | Overweight | 2025-04-08 |
Nordson Corporation’s grades reflect a positive bias with multiple Buy, Overweight, and Outperform ratings, alongside some Neutral opinions.
Which company has the best grades?
Nordson Corporation has received generally stronger grades with more consistent Buy, Overweight, and Outperform ratings compared to IDEX Corporation’s mix of Buy, Outperform, and Neutral grades. This difference may influence investors seeking more bullish analyst sentiment.
Strengths and Weaknesses
Below is a comparison of key strengths and weaknesses for IDEX Corporation (IEX) and Nordson Corporation (NDSN) based on the most recent financial and operational data.
| Criterion | IDEX Corporation (IEX) | Nordson Corporation (NDSN) |
|---|---|---|
| Diversification | Balanced revenue streams across Health & Science Technologies (1.3B), Fluid & Metering (1.23B), and Fire & Safety Products (744M) | More concentrated with Industrial Precision Solutions (1.48B), Medical & Fluid Solutions (695M), and Advanced Technology Systems (510M) |
| Profitability | Net margin 15.45% (favorable), ROIC 8.81% (neutral), ROE 13.31% (neutral) | Net margin 17.35% (favorable), ROIC 10.49% (favorable), ROE 15.92% (favorable) |
| Innovation | Moderate innovation indicated by steady revenue growth in high-tech segments | Strong innovation focus in advanced technologies and precision solutions |
| Global presence | Established with diverse product lines serving multiple industries worldwide | Strong international footprint, especially in industrial and medical sectors |
| Market Share | Stable but facing slight profitability decline, ROIC slightly below WACC | Creating value with ROIC well above WACC, but ROIC trend declining |
Key takeaways: Both companies show solid diversification and favorable profitability metrics, with Nordson having a stronger ROIC and net margin. However, both face declining ROIC trends, signaling caution. IDEX offers more balanced diversification, while Nordson leans on advanced technology and precision segments. Investors should weigh growth potential against the profitability decline trend.
Risk Analysis
Below is a comparison of key risk factors for IDEX Corporation (IEX) and Nordson Corporation (NDSN) based on the most recent financial and operational data from 2025-2026.
| Metric | IDEX Corporation (IEX) | Nordson Corporation (NDSN) |
|---|---|---|
| Market Risk | Moderate beta at 0.995, indicating average sensitivity to market fluctuations. | Slightly higher beta at 1.025, marginally more volatile than IEX. |
| Debt level | Debt-to-equity ratio moderate at 0.52, debt-to-assets favorable at 29.45%. Interest coverage strong at 15.37x. | Debt-to-equity slightly higher at 0.69, debt-to-assets neutral at 35.36%. Interest coverage decent at 5.55x. |
| Regulatory Risk | Exposure to industrial and safety regulations; no recent compliance issues reported. | Similar industrial regulatory environment; no significant new risks identified. |
| Operational Risk | Broad product segments with complexity in fluidics and safety systems; operational efficiency neutral to favorable. | Diverse dispensing technologies and automated systems; operational complexity moderate. |
| Environmental Risk | Moderate, with exposure to chemical and fluid handling industries requiring compliance with environmental standards. | Similar exposure in coatings and adhesives industries; ongoing environmental compliance necessary. |
| Geopolitical Risk | Primarily US-based operations with global sales; moderate exposure to global trade tensions. | Also US-based with global footprint; moderately affected by international supply chain risks. |
In summary, both companies show moderate market and debt-related risks, with IDEX demonstrating stronger interest coverage and slightly lower leverage. Operational and environmental risks are comparable due to their industrial machinery focus. The most impactful risk remains moderate leverage combined with global market exposure, requiring cautious monitoring amid potential geopolitical uncertainties.
Which Stock to Choose?
IDEX Corporation (IEX) shows a favorable income statement with strong gross and EBIT margins but recent declines in revenue and net margin growth. Its financial ratios are slightly favorable, with good liquidity and moderate debt, though some valuation multiples appear high. The company’s MOAT evaluation is slightly unfavorable due to declining ROIC below WACC, and its rating is very favorable at B+.
Nordson Corporation (NDSN) has a favorable income profile, including a higher net margin and steady revenue growth over the period. Financial ratios are also slightly favorable, with solid profitability and manageable debt, despite higher leverage than IEX. The MOAT is slightly favorable as the company creates value, though ROIC is declining. Its rating stands at B, also very favorable.
For investors prioritizing value creation and profitability, NDSN might appear more attractive given its consistent value creation despite declining ROIC. Conversely, those focused on liquidity and slightly better recent operational stability may find IEX’s profile more suitable. Both companies exhibit slightly favorable ratios and ratings, implying a nuanced choice depending on risk tolerance and investment strategy.
Disclaimer: Investment carries a risk of loss of initial capital. The past performance is not a reliable indicator of future results. Be sure to understand risks before making an investment decision.
Go Further
I encourage you to read the complete analyses of IDEX Corporation and Nordson Corporation to enhance your investment decisions: