IDEX Corporation and Kadant Inc. are two prominent players in the industrial machinery sector, each delivering innovative solutions across fluid handling, processing, and material management. While IDEX focuses on precision fluidics and safety equipment, Kadant excels in flow control and industrial processing systems. Their overlapping markets and distinct innovation strategies make them compelling contenders. In this article, I will analyze which company offers the most attractive investment opportunity for you.
Table of contents
Companies Overview
I will begin the comparison between IDEX Corporation and Kadant Inc. by providing an overview of these two companies and their main differences.
IDEX Corporation Overview
IDEX Corporation operates globally through three segments: Fluid & Metering Technologies, Health & Science Technologies, and Fire & Safety/Diversified Products. The company focuses on designing and producing specialized pumps, fluid-handling systems, medical devices, firefighting equipment, and precision components serving diverse industries such as food, chemical, pharmaceutical, and fire safety. Headquartered in Northbrook, Illinois, IDEX’s mission centers on applied solutions with a broad industrial footprint.
Kadant Inc. Overview
Kadant Inc. supplies engineered systems and technologies worldwide through its Flow Control, Industrial Processing, and Material Handling segments. It produces fluid-handling equipment, industrial automation, logging machinery, and biodegradable absorbents for various sectors including packaging, tissue, wood products, and agriculture. Based in Westford, Massachusetts, Kadant emphasizes specialized machinery and systems supporting industrial processing and material handling markets globally.
Key similarities and differences
Both IDEX and Kadant operate in the industrial machinery sector with diversified product lines targeting fluid handling and processing systems. IDEX has a broader market scope including medical and fire safety technologies, while Kadant focuses more on industrial processing, material handling, and environmental applications. IDEX is larger by market cap and employee count, whereas Kadant shows a slightly higher beta, indicating potentially greater stock volatility.
Income Statement Comparison
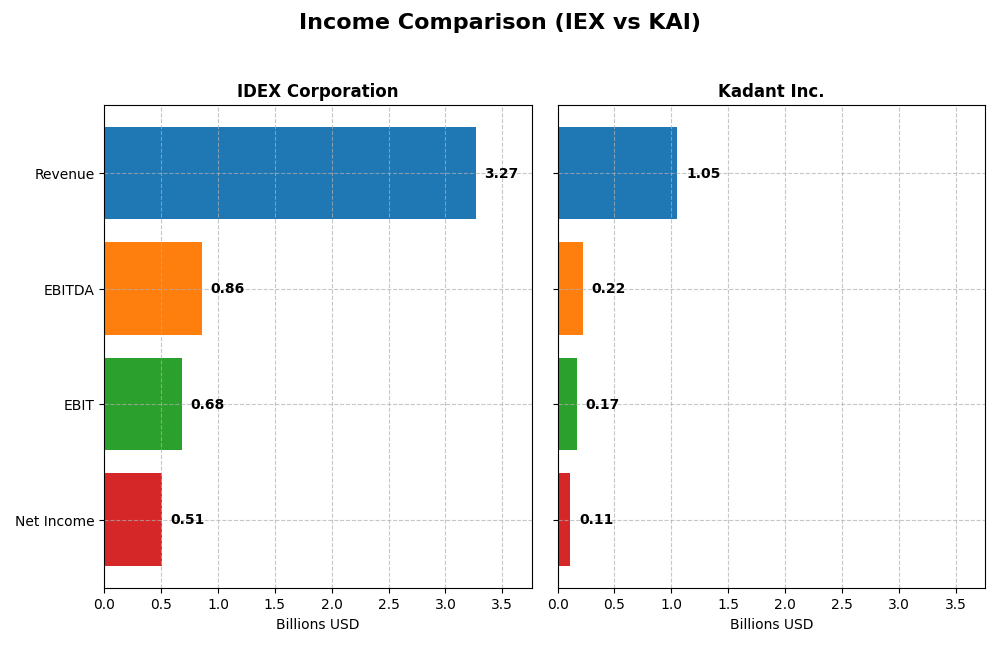
The table below compares key income statement metrics for IDEX Corporation and Kadant Inc. for the fiscal year 2024, highlighting their financial performance.
| Metric | IDEX Corporation (IEX) | Kadant Inc. (KAI) |
|---|---|---|
| Market Cap | 13.9B | 3.76B |
| Revenue | 3.27B | 1.05B |
| EBITDA | 859M | 223M |
| EBIT | 684M | 173M |
| Net Income | 505M | 112M |
| EPS | 6.67 | 9.51 |
| Fiscal Year | 2024 | 2024 |
Income Statement Interpretations
IDEX Corporation
IDEX Corporation showed a 39.0% revenue growth from 2020 to 2024, with net income increasing by 33.7% over the same period. Margins remain strong, with a gross margin of 46.4% and net margin at 15.45%, though net margin declined slightly. In 2024, revenue dipped marginally by 0.16%, and net income decreased 15.15%, indicating some slowdown despite overall solid fundamentals.
Kadant Inc.
Kadant experienced a robust 65.9% revenue growth and an impressive 102.2% net income increase between 2020 and 2024. Margins have improved, with gross margin at 44.25% and net margin at 10.59%, showing positive net margin growth over the period. In 2024, revenue rose by 10%, but net margin fell 12.6%, reflecting some margin pressure despite top-line gains.
Which one has the stronger fundamentals?
Both companies present favorable income statement profiles, but Kadant shows stronger overall growth in revenue and net income, accompanied by net margin expansion. IDEX maintains higher absolute margins but faced recent declines in net income and margins. Kadant’s higher proportion of favorable metrics and sustained growth suggest comparatively stronger fundamentals based on available data.
Financial Ratios Comparison
The table below presents the most recent key financial ratios for IDEX Corporation and Kadant Inc., based on their fiscal year 2024 data.
| Ratios | IDEX Corporation (IEX) | Kadant Inc. (KAI) |
|---|---|---|
| ROE | 13.3% | 13.2% |
| ROIC | 8.8% | 10.1% |
| P/E | 31.4 | 36.9 |
| P/B | 4.18 | 4.86 |
| Current Ratio | 2.53 | 2.31 |
| Quick Ratio | 1.85 | 1.55 |
| D/E (Debt to Equity) | 0.52 | 0.38 |
| Debt-to-Assets | 29.4% | 22.6% |
| Interest Coverage | 15.7 | 8.55 |
| Asset Turnover | 0.48 | 0.74 |
| Fixed Asset Turnover | 7.10 | 6.18 |
| Payout Ratio | 40.7% | 13.1% |
| Dividend Yield | 1.30% | 0.36% |
Interpretation of the Ratios
IDEX Corporation
IDEX shows a balanced ratio profile with 50% favorable metrics including strong current and quick ratios, solid interest coverage, and a favorable debt-to-assets ratio. However, weaknesses include high price-to-earnings and price-to-book ratios, and low asset turnover. Its 1.3% dividend yield is neutral, indicating a steady but modest return to shareholders without excessive payout risks.
Kadant Inc.
Kadant has a favorable overall ratio evaluation at 57%, with strengths in net margin, return on invested capital, and debt management. Some concerns exist around its high valuation multiples and a low dividend yield of 0.36%, which is considered unfavorable. The company maintains a solid liquidity position and efficient fixed asset turnover, reflecting operational efficiency.
Which one has the best ratios?
Kadant’s ratios are generally more favorable, especially in profitability and leverage, despite a weaker dividend yield. IDEX exhibits a solid liquidity position and dividend stability but faces valuation and efficiency challenges. Overall, Kadant’s higher proportion of favorable ratios and operational metrics slightly surpass IDEX’s performance.
Strategic Positioning
This section compares the strategic positioning of IDEX Corporation and Kadant Inc. regarding market position, key segments, and exposure to technological disruption:
IDEX Corporation
- Large market cap of 13.9B USD, facing typical industrial machinery competitive pressures.
- Diversified segments: Fluid & Metering, Health & Science, Fire & Safety; broad industrial and scientific markets.
- Operates in traditional industrial technologies with no explicit indication of exposure to major technological disruption.
Kadant Inc.
- Smaller market cap of 3.8B USD, with likely more niche industrial machinery competition.
- Focused segments: Flow Control, Industrial Processing, Material Handling; specialized in fluid systems and papermaking.
- Provides engineered systems with no clear evidence of significant disruption risks indicated.
IDEX Corporation vs Kadant Inc. Positioning
IDEX pursues a diversified strategy across multiple industrial and scientific segments, offering broad market exposure. Kadant concentrates on fluid handling and material processing, focusing on specialized industrial niches. Diversification may reduce risk, while concentration can deepen expertise.
Which has the best competitive advantage?
Neither company currently demonstrates a strong competitive advantage; IDEX shows declining profitability while Kadant’s profitability is improving, reflecting a slightly favorable moat for Kadant and slightly unfavorable for IDEX.
Stock Comparison
The stock price movements of IDEX Corporation (IEX) and Kadant Inc. (KAI) over the past year reveal contrasting bearish trends with recent recovery phases marked by positive short-term gains.

Trend Analysis
IDEX Corporation’s stock showed a bearish trend over the past 12 months with an 18.8% decline and accelerating downward momentum; recent weeks indicate a 9.98% rebound with moderate volatility (std dev 5.84).
Kadant Inc. experienced a bearish trend as well, declining 5.86% over the same period with accelerating loss and higher volatility (std dev 34.44); its recent 9.69% gain comes with increased short-term volatility (std dev 15.63).
Comparing both, IEX had a larger overall decline but slightly higher recent recovery; Kadant’s smaller total loss and volatility profile indicate it delivered the highest market performance over the past year.
Target Prices
Analysts provide a positive outlook with clear consensus target prices for both IDEX Corporation and Kadant Inc.
| Company | Target High | Target Low | Consensus |
|---|---|---|---|
| IDEX Corporation | 210 | 180 | 194 |
| Kadant Inc. | 410 | 275 | 342.5 |
The consensus targets for IDEX Corporation at $194 and Kadant Inc. at $342.5 suggest moderate to strong upside potential compared to their current prices of $184.71 and $319.22, respectively. Analysts expect both stocks to appreciate within their respective target ranges.
Analyst Opinions Comparison
This section compares analysts’ ratings and grades for IDEX Corporation and Kadant Inc.:
Rating Comparison
IEX Rating
- Rating: B+ with a very favorable status, indicating a strong financial standing.
- Discounted Cash Flow Score: 4, favorable, suggesting good future cash flow prospects.
- ROE Score: 4, favorable, showing efficient profit generation from equity.
- ROA Score: 4, favorable, demonstrating effective asset use to generate earnings.
- Debt To Equity Score: 2, moderate, reflecting a somewhat higher financial risk.
- Overall Score: 3, moderate, suggesting an average overall financial assessment.
KAI Rating
- Rating: B with a very favorable status, reflecting solid financial health.
- Discounted Cash Flow Score: 3, moderate, indicating average valuation outlook.
- ROE Score: 3, moderate, indicating average efficiency in generating returns.
- ROA Score: 4, favorable, also showing strong asset utilization performance.
- Debt To Equity Score: 3, moderate, indicating somewhat higher leverage risk.
- Overall Score: 3, moderate, showing a comparable overall financial position.
Which one is the best rated?
Based on the provided data, IEX holds a slightly better rating (B+) than KAI (B), with higher scores in discounted cash flow, return on equity, and a similar overall score, indicating a marginally stronger financial profile.
Scores Comparison
Here is a comparison of the Altman Z-Score and Piotroski Score for IDEX Corporation and Kadant Inc.:
IEX Scores
- Altman Z-Score: 4.48, placing IEX in the safe zone, indicating low bankruptcy risk.
- Piotroski Score: 7, categorized as strong financial health.
KAI Scores
- Altman Z-Score: 5.59, placing KAI in the safe zone, indicating low bankruptcy risk.
- Piotroski Score: 7, categorized as strong financial health.
Which company has the best scores?
Both IEX and KAI are in the safe zone according to their Altman Z-Scores, with KAI having a slightly higher score. Their Piotroski Scores are equal, both indicating strong financial health based on the provided data.
Grades Comparison
Here is a comparison of the recent grades assigned to IDEX Corporation and Kadant Inc.:
IDEX Corporation Grades
The table below shows recent grades from reputable financial institutions for IDEX Corporation.
| Grading Company | Action | New Grade | Date |
|---|---|---|---|
| Citigroup | Maintain | Buy | 2025-12-08 |
| RBC Capital | Maintain | Outperform | 2025-10-30 |
| Stifel | Maintain | Buy | 2025-10-20 |
| Oppenheimer | Maintain | Outperform | 2025-10-07 |
| DA Davidson | Maintain | Neutral | 2025-08-04 |
| Stifel | Maintain | Buy | 2025-07-31 |
| RBC Capital | Maintain | Outperform | 2025-07-31 |
| Oppenheimer | Maintain | Outperform | 2025-07-31 |
| Stifel | Maintain | Buy | 2025-07-21 |
| Citigroup | Maintain | Buy | 2025-07-14 |
The grades for IDEX Corporation mostly indicate a positive outlook, with multiple “Buy” and “Outperform” ratings and few neutral opinions.
Kadant Inc. Grades
Below are recent grades from recognized grading companies for Kadant Inc.
| Grading Company | Action | New Grade | Date |
|---|---|---|---|
| Barrington Research | Maintain | Outperform | 2025-10-30 |
| Barrington Research | Maintain | Outperform | 2025-10-29 |
| Barrington Research | Maintain | Outperform | 2025-10-27 |
| Barrington Research | Maintain | Outperform | 2025-10-10 |
| Barrington Research | Maintain | Outperform | 2025-09-23 |
| DA Davidson | Maintain | Neutral | 2025-08-04 |
| Barrington Research | Maintain | Outperform | 2025-07-30 |
| Barrington Research | Maintain | Outperform | 2025-07-29 |
| Barrington Research | Maintain | Outperform | 2025-05-01 |
| DA Davidson | Maintain | Neutral | 2025-05-01 |
Kadant Inc. has predominantly “Outperform” ratings from Barrington Research, with occasional “Neutral” grades from DA Davidson, showing a generally favorable outlook.
Which company has the best grades?
Both IDEX Corporation and Kadant Inc. have a consensus rating of “Hold,” but Kadant Inc. displays a more consistent pattern of “Outperform” grades from a single reputable source. IDEX shows a broader mix of “Buy” and “Outperform” ratings from multiple firms. This diversity might suggest varying analyst perspectives, which investors should consider for balanced risk assessment.
Strengths and Weaknesses
Below is a comparison of key strengths and weaknesses of IDEX Corporation (IEX) and Kadant Inc. (KAI) based on recent financial performance and market positioning.
| Criterion | IDEX Corporation (IEX) | Kadant Inc. (KAI) |
|---|---|---|
| Diversification | Highly diversified revenue streams across Health and Science, Fluid and Metering, and Fire and Safety products (~$3.5B total in 2024) | More concentrated in Capital and Parts & Consumables segments (~$1.05B total in 2024) |
| Profitability | Net margin 15.45% (favorable); ROIC 8.81% (neutral) but ROIC trend declining; slightly unfavorable moat | Net margin 10.59% (favorable); ROIC 10.08% (favorable) with growing ROIC trend; slightly favorable moat |
| Innovation | Strong focus on advanced technologies in Health and Science sectors; stable R&D investment | Innovation driven by papermaking and fiber-based product technologies; improving operational efficiency |
| Global presence | Established global footprint with broad industrial market exposure | More niche global presence focused on papermaking and industrial parts markets |
| Market Share | Leading market positions in several segments but facing margin pressure | Smaller scale but growing market share with improving profitability and operational metrics |
Key takeaway: IDEX offers broader diversification and stronger profitability margins but faces challenges with declining capital efficiency. Kadant, while smaller and more focused, shows improving profitability and a positive ROIC trajectory, signaling potential for value creation ahead. Investors should weigh diversification against growth dynamics and moat durability.
Risk Analysis
Below is a comparative table highlighting key risk factors for IDEX Corporation (IEX) and Kadant Inc. (KAI) based on the latest 2024 data:
| Metric | IDEX Corporation (IEX) | Kadant Inc. (KAI) |
|---|---|---|
| Market Risk | Moderate (Beta ~1.0) | Higher (Beta ~1.25) |
| Debt level | Moderate (D/E = 0.52, favorable debt to assets 29.45%) | Low (D/E = 0.38, debt to assets 22.57%) |
| Regulatory Risk | Moderate (Industrial machinery sector compliance) | Moderate (Similar sector regulatory exposure) |
| Operational Risk | Moderate (Diverse segments, complex products) | Moderate (Multiple segments, industrial systems) |
| Environmental Risk | Moderate (Focus on industrial and fluid systems) | Moderate (Industrial processing and materials handling) |
| Geopolitical Risk | Moderate (US-based, global sales exposure) | Moderate (US-based, global markets exposure) |
The most impactful risks for both companies stem from market volatility and operational complexities inherent in the industrial machinery sector. Kadant’s higher beta indicates greater sensitivity to market swings, while IDEX maintains a strong liquidity position mitigating debt-related risks. Both firms face similar regulatory and environmental challenges due to their industry focus.
Which Stock to Choose?
IDEX Corporation (IEX) shows a slightly favorable financial profile with steady income growth overall but recent declines in revenue and margins. Its profitability ratios are neutral to favorable, debt levels moderate, and rating is very favorable (B+). However, its economic moat is slightly unfavorable, indicating declining value creation.
Kadant Inc. (KAI) presents a favorable financial stance with strong income growth, particularly over the longer term. Profitability ratios are mostly favorable, debt metrics are solid, and it holds a very favorable rating (B). Its economic moat is slightly favorable, reflecting improving profitability and value creation.
For investors, IEX might appear more suitable for those prioritizing stable ratings and established profitability despite recent margin pressures, while KAI could be seen as attractive for those favoring growth potential and improving economic moat. The choice could depend on whether the investor is more risk-averse or growth-oriented.
Disclaimer: Investment carries a risk of loss of initial capital. The past performance is not a reliable indicator of future results. Be sure to understand risks before making an investment decision.
Go Further
I encourage you to read the complete analyses of IDEX Corporation and Kadant Inc. to enhance your investment decisions: