Home > Comparison > Industrials > IR vs IEX
The strategic rivalry between Ingersoll Rand Inc. and IDEX Corporation shapes the industrial machinery sector’s competitive landscape. Ingersoll Rand operates as a broad-based industrial technologies and services provider, while IDEX focuses on specialized fluid and metering solutions. This head-to-head pits scale and diversification against niche precision and innovation. This analysis aims to identify which company offers superior risk-adjusted returns for diversified industrial portfolios in 2026.
Table of contents
Companies Overview
Ingersoll Rand and IDEX Corporation stand as key players in the industrial machinery sector, shaping global fluid and pumping technologies.
Ingersoll Rand Inc.: Industrial Powerhouse in Fluid and Air Technologies
Ingersoll Rand excels as a leader in mission-critical air, fluid, and specialty vehicle technologies across multiple continents. Its core revenue derives from designing and servicing air compressors, fluid transfer equipment, and precision pumps. In 2026, the company sharpens its focus on expanding its Industrial Technologies and Precision Science segments to serve medical, manufacturing, and energy markets.
IDEX Corporation: Specialist in Precision Fluidics and Safety Solutions
IDEX Corporation commands a niche as an applied solutions provider in fluid handling and safety equipment worldwide. Revenue primarily comes from its Fluid & Metering, Health & Science, and Fire & Safety segments, delivering pumps, valves, and biocompatible devices. Its strategic emphasis in 2026 targets innovation in precision fluidics and expanding its fire and rescue product lines.
Strategic Collision: Similarities & Divergences
Both firms thrive on precision fluid management but differ in scope and approach: Ingersoll Rand operates broad industrial platforms, while IDEX pursues specialized, high-tech fluid and safety solutions. Their primary battleground is the fluid handling market, where Ingersoll’s scale competes with IDEX’s innovation edge. These distinctions shape markedly different investment profiles in terms of scale, diversification, and technological focus.
Income Statement Comparison
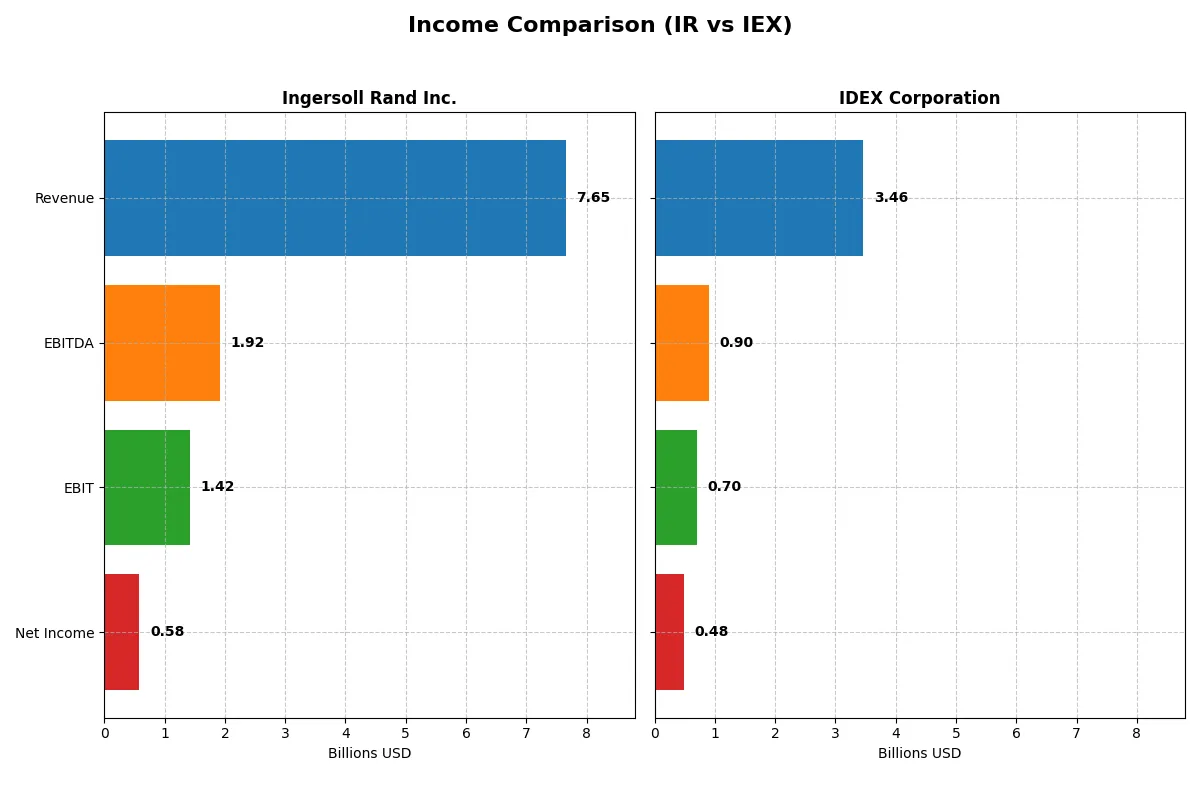
The following data dissects the core profitability and scalability of both corporate engines to reveal who dominates the bottom line:
| Metric | Ingersoll Rand Inc. (IR) | IDEX Corporation (IEX) |
|---|---|---|
| Revenue | 7.65B | 3.46B |
| Cost of Revenue | 4.70B | 1.92B |
| Operating Expenses | 1.53B | 819M |
| Gross Profit | 2.95B | 1.54B |
| EBITDA | 1.92B | 904M |
| EBIT | 1.42B | 697M |
| Interest Expense | 254M | 64M |
| Net Income | 581M | 483M |
| EPS | 1.46 | 6.41 |
| Fiscal Year | 2025 | 2025 |
Income Statement Analysis: The Bottom-Line Duel
This income statement comparison reveals the true efficiency and profitability of each company’s business engine over recent years.
Ingersoll Rand Inc. Analysis
Ingersoll Rand’s revenue climbed steadily from 5.15B in 2021 to 7.65B in 2025, showing strong top-line growth of 48% over five years. However, net income grew only modestly, peaking at 838M in 2024 before declining to 581M in 2025. Gross margin contracted to 38.5%, signaling some cost pressures. Despite this, operating income and EBIT margins remained favorable, reflecting controlled expenses and solid operational efficiency in 2025.
IDEX Corporation Analysis
IDEX’s revenue rose from 2.76B in 2021 to 3.46B in 2025, marking a 25% increase over five years with consistent growth. Net income advanced from 449M in 2021 to 483M in 2025, with a peak in 2023 of 596M. IDEX sustained superior margins, with a 44.5% gross margin and a 14% net margin in 2025, indicating robust profitability. EBIT margin near 20% highlights operational strength, though recent EPS and net margin growth showed slight declines.
Margin Strength vs. Revenue Expansion
Ingersoll Rand leads in revenue scale and growth but faces margin contraction and a recent dip in net income. IDEX delivers stronger margins and steadier profitability despite a smaller revenue base. For investors prioritizing margin resilience and consistent bottom-line results, IDEX’s profile appears more attractive. Conversely, Ingersoll Rand suits those focused on top-line expansion with acceptable margin trade-offs.
Financial Ratios Comparison
These vital ratios act as a diagnostic tool to expose the underlying fiscal health, valuation premiums, and capital efficiency of the companies compared here:
| Ratios | Ingersoll Rand Inc. (IR) | IDEX Corporation (IEX) |
|---|---|---|
| ROE | 5.8% | 12.0% |
| ROIC | 6.4% | 8.6% |
| P/E | 54.2 | 27.7 |
| P/B | 3.13 | 3.33 |
| Current Ratio | 2.06 | 2.86 |
| Quick Ratio | 1.49 | 2.02 |
| D/E | 0.47 | 0.45 |
| Debt-to-Assets | 26.1% | 26.3% |
| Interest Coverage | 5.58 | 11.18 |
| Asset Turnover | 0.42 | 0.50 |
| Fixed Asset Turnover | 8.22 | 7.39 |
| Payout ratio | 5.5% | 44.0% |
| Dividend yield | 0.10% | 1.59% |
| Fiscal Year | 2025 | 2025 |
Efficiency & Valuation Duel: The Vital Signs
Financial ratios act as a company’s DNA, unveiling hidden risks and operational strengths essential for informed investing decisions.
Ingersoll Rand Inc.
Ingersoll Rand posts a modest ROE at 5.76%, signaling limited profitability against a high P/E of 54.24 that stretches valuation. Its net margin stands neutral at 7.6%. The company maintains a strong current ratio of 2.06, reflecting sound liquidity. Dividend yield is minimal at 0.1%, suggesting limited shareholder returns with possible reinvestment in stability or debt reduction.
IDEX Corporation
IDEX presents a robust net margin of 13.98% and a healthier ROE of 12%, indicating stronger profitability. The P/E ratio at 27.73 appears more reasonable but still elevated relative to market averages. IDEX benefits from superior liquidity with a current ratio of 2.86 and a solid interest coverage of 10.82. A 1.59% dividend yield offers tangible shareholder returns alongside operational efficiency.
Valuation Stretch vs. Operational Strength
IDEX balances profitability and liquidity better than Ingersoll Rand, reflected in more favorable ratios and dividend yield. Ingersoll Rand’s high valuation and weak ROE highlight riskier reward dynamics. Investors prioritizing operational safety may lean toward IDEX, while those tolerating valuation premiums might consider Ingersoll Rand’s potential for long-term stability.
Which one offers the Superior Shareholder Reward?
I compare Ingersoll Rand Inc. (IR) and IDEX Corporation (IEX) based on dividends, payout ratios, and buybacks. IR pays a minimal dividend yield (~0.1%) with a very low payout ratio (~5%), signaling cautious cash return. IEX offers a higher dividend yield (~1.6%) but with a heavy payout ratio (~44%), which may pressure free cash flow. Both companies maintain strong buyback programs, yet IEX’s robust free cash flow per share (~8.2) supports its aggressive shareholder returns better than IR’s (~3.1). I see IEX’s distribution as more balanced and sustainable, offering a superior total return profile in 2026.
Comparative Score Analysis: The Strategic Profile
The radar chart reveals the fundamental DNA and trade-offs of both firms, highlighting their core financial strengths and weaknesses:
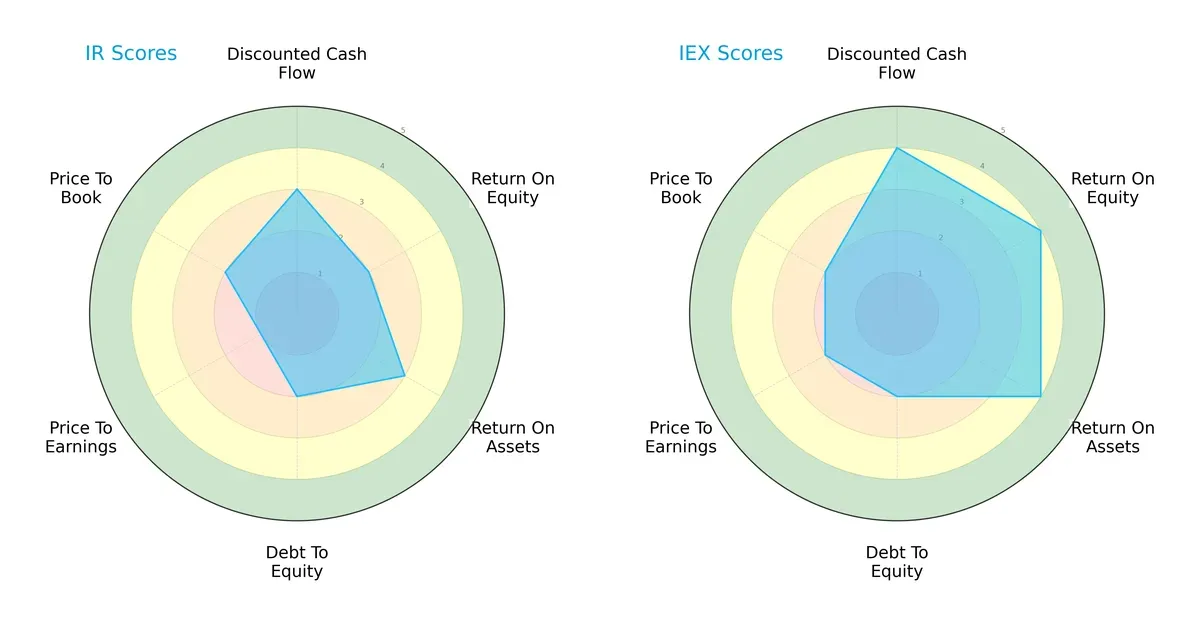
IDEX Corporation (IEX) exhibits a more balanced and robust profile, scoring favorably in DCF (4), ROE (4), and ROA (4). Ingersoll Rand Inc. (IR) shows moderate strength in DCF (3) and ROA (3) but lags in ROE (2) and valuation metrics, especially P/E (1). Both firms share similar debt-to-equity risk (2), but IEX’s superior profitability and cash flow outlook present a clearer competitive edge.
Bankruptcy Risk: Solvency Showdown
The Altman Z-Score difference signals stronger long-term solvency for IDEX, reinforcing its resilience in volatile cycles:
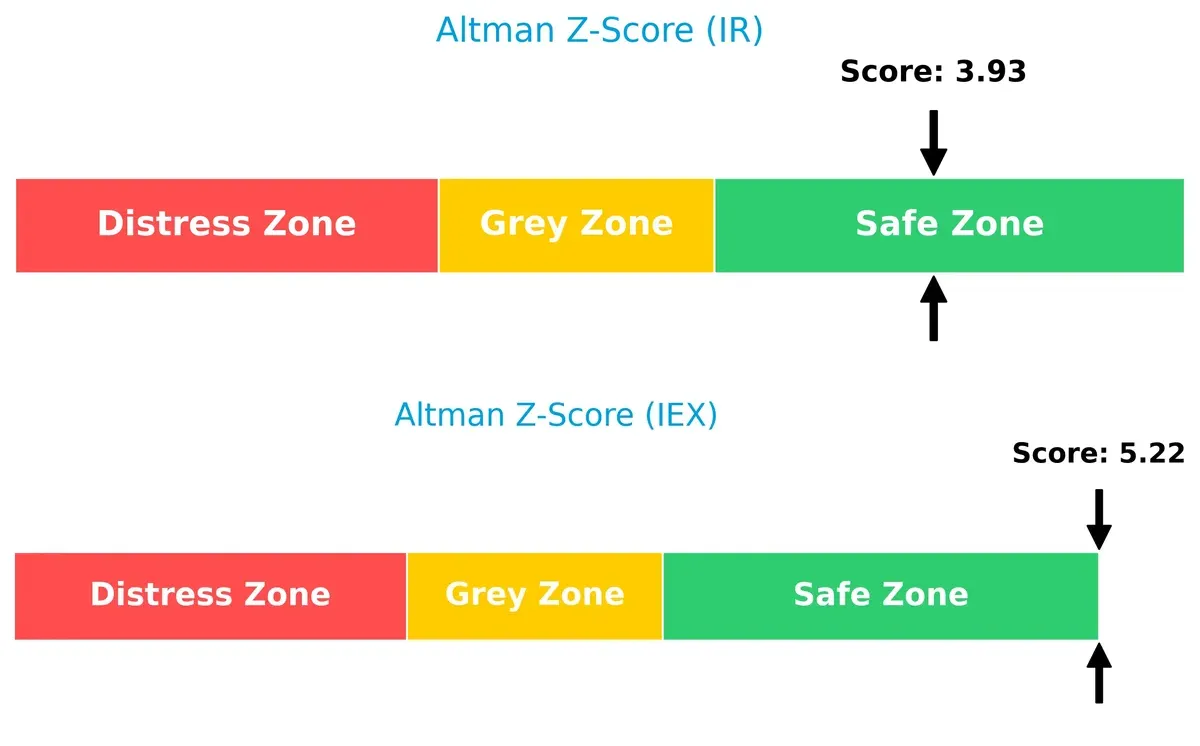
IDEX’s score of 5.22 places it deep in the safe zone, reflecting robust financial health and low bankruptcy risk. In contrast, Ingersoll Rand’s 3.93, while still safe, indicates relatively higher vulnerability. Historically, companies with higher Z-scores better navigate downturns and credit tightening.
Financial Health: Quality of Operations
The Piotroski F-Score comparison highlights IDEX’s superior operational quality and internal financial controls:
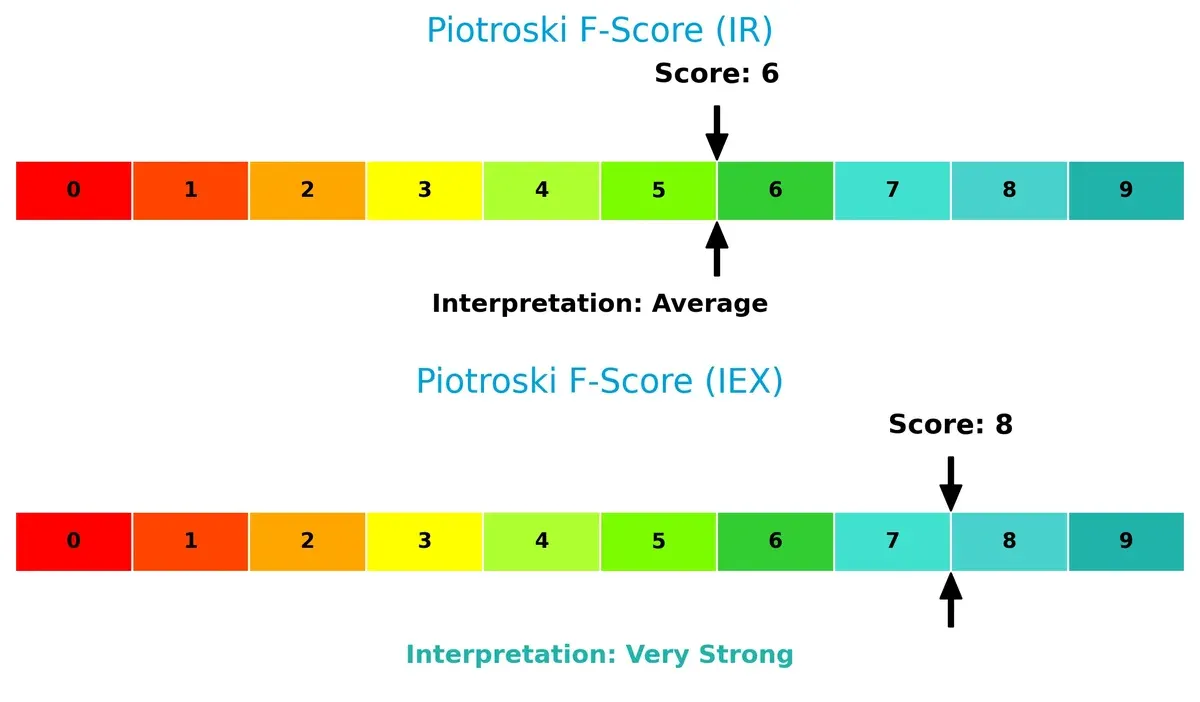
IDEX scores an impressive 8, signaling very strong financial health with minimal red flags. Ingersoll Rand’s 6, while average, suggests some weaknesses in profitability or efficiency metrics. IEX’s higher score implies better capital allocation and earnings quality, critical in sustaining growth amid sector cyclicality.
How are the two companies positioned?
This section dissects the operational DNA of IR and IEX by comparing their revenue distribution by segment alongside their internal strengths and weaknesses. The ultimate goal is to confront their economic moats and identify which business model delivers the most resilient, sustainable competitive advantage today.
Revenue Segmentation: The Strategic Mix
The following visual comparison dissects how Ingersoll Rand Inc. and IDEX Corporation diversify their income streams and where their primary sector bets lie:
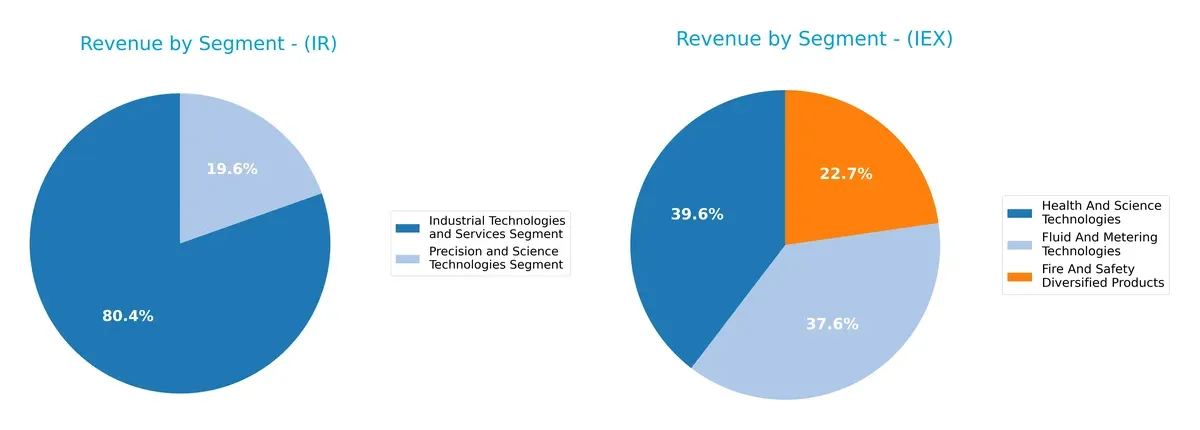
Ingersoll Rand leans heavily on its Industrial Technologies and Services segment, generating $5.8B in 2024, dwarfing its $1.4B Precision and Science Technologies segment. This concentration anchors IR’s ecosystem lock-in but poses concentration risk. Conversely, IDEX splits revenue more evenly across Health and Science Technologies ($1.3B), Fluid and Metering Technologies ($1.2B), and Fire and Safety Diversified Products ($744M). IDEX’s diversified mix reduces dependency on a single market, enhancing resilience through sector balance.
Strengths and Weaknesses Comparison
This table compares the Strengths and Weaknesses of Ingersoll Rand Inc. and IDEX Corporation:
Ingersoll Rand Inc. Strengths
- Diverse industrial and precision science segments
- Stable Americas, EMEA, and Asia Pacific revenue streams
- Favorable liquidity ratios with current ratio at 2.06 and quick ratio at 1.49
- Conservative leverage with debt to assets at 26.15%
- Strong fixed asset turnover at 8.22 supports operational efficiency
IDEX Corporation Strengths
- Balanced revenue across health, safety, and fluid technologies
- Higher net margin at 13.98% signals strong profitability
- Favorable WACC at 7.69% indicates cost-efficient capital
- Very strong interest coverage at 10.82 reflects financial stability
- Higher current and quick ratios than IR support liquidity
Ingersoll Rand Inc. Weaknesses
- Return on equity at 5.76% is unfavorable relative to cost of capital
- Price multiples (PE 54.24, PB 3.13) appear stretched
- Asset turnover at 0.42 is relatively low, impacting efficiency
- Dividend yield minimal at 0.1%, limiting income appeal
IDEX Corporation Weaknesses
- PE ratio of 27.73 and PB of 3.33 indicate premium valuation
- Asset turnover at 0.5 is weak, signaling operational challenges
- Dividend yield neutral at 1.59%, modest for income investors
Both companies exhibit solid liquidity and manageable debt levels, but IDEX shows superior profitability and capital efficiency, while Ingersoll Rand faces challenges in equity returns and valuation. Each firm’s segment diversification supports resilience, yet operational efficiency and market valuation remain key areas to monitor.
The Moat Duel: Analyzing Competitive Defensibility
A structural moat is the only shield that protects long-term profits from relentless competition and market pressures. Here’s how Ingersoll Rand and IDEX stack up:
Ingersoll Rand Inc.: Innovation-Driven Operational Moat
Ingersoll Rand’s moat stems from its extensive product diversification and rising ROIC trend despite currently shedding value. Its margin stability and expanding global reach could deepen its moat in 2026.
IDEX Corporation: Precision Engineering and Margin Leadership
IDEX’s moat relies on superior gross and EBIT margins, reflecting strong pricing power and efficient capital use. However, its declining ROIC trend signals risks, though new market segments offer growth potential.
Innovation Versus Margin Excellence: The 2026 Moat Showdown
Ingersoll Rand boasts a growing ROIC trend, indicating improving profitability despite short-term value erosion. IDEX presents stronger margins but suffers declining capital efficiency. I see Ingersoll Rand better positioned to defend and expand its market share.
Which stock offers better returns?
Over the past year, Ingersoll Rand Inc. gained nearly 4%, showing steady acceleration, while IDEX Corporation declined 13.7% despite recent strong gains.
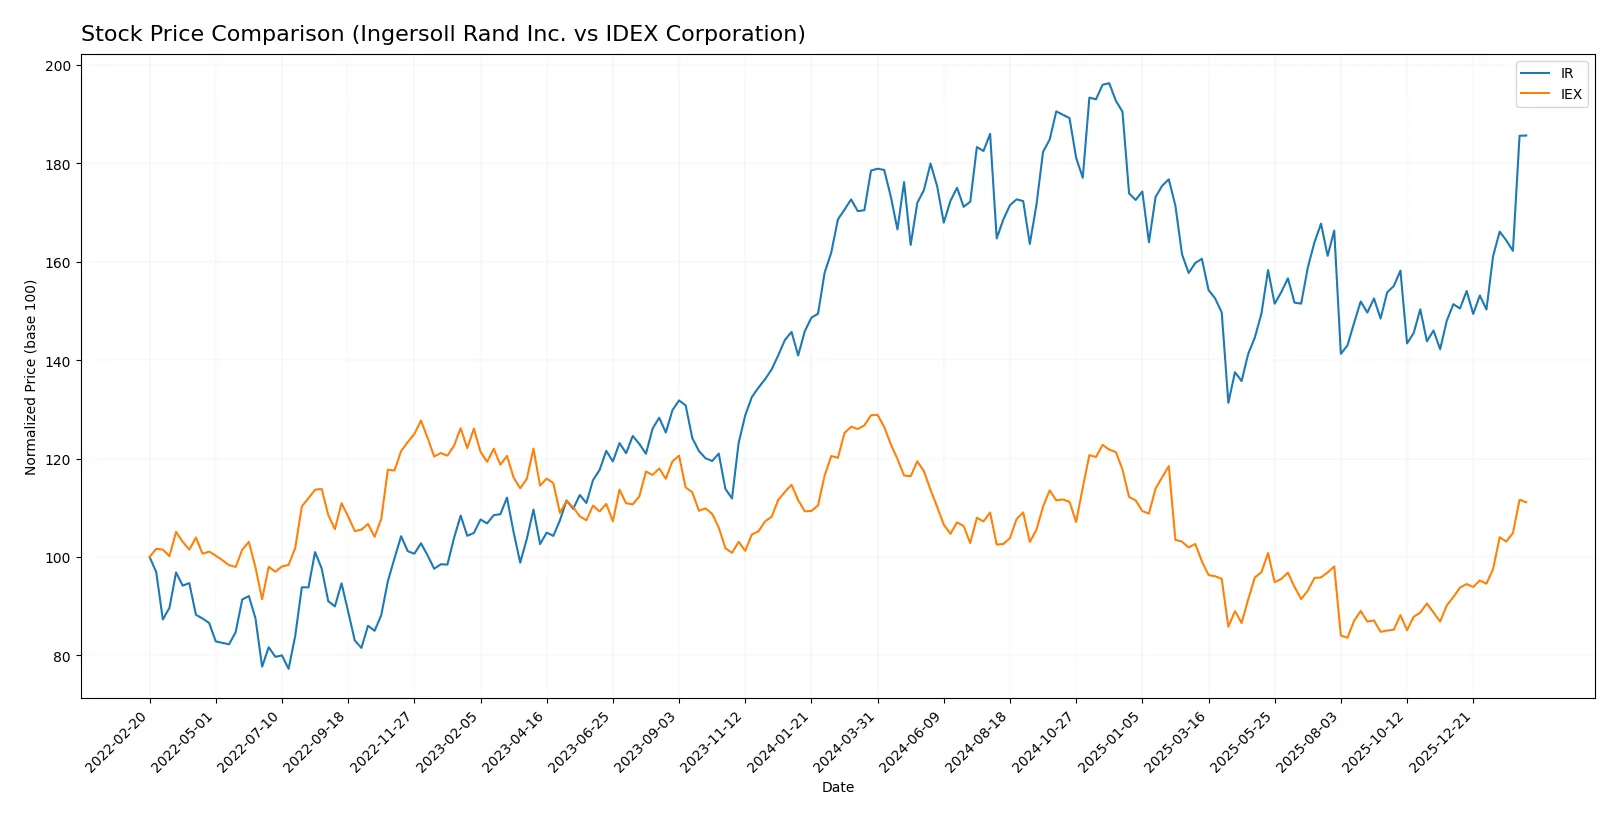
Trend Comparison
Ingersoll Rand’s stock rose 3.99% over 12 months, marking a bullish trend with accelerating momentum and prices ranging from 69.7 to 104.17. IDEX Corporation dropped 13.72% in the same period, a bearish trend despite recent acceleration and a wide price range between 158.26 and 244.02. Ingersoll Rand outperformed IDEX overall, delivering positive growth versus IDEX’s notable decline over the past year.
Target Prices
Analysts present a constructive target price consensus for Ingersoll Rand Inc. and IDEX Corporation.
| Company | Target Low | Target High | Consensus |
|---|---|---|---|
| Ingersoll Rand Inc. | 87 | 100 | 93 |
| IDEX Corporation | 220 | 247 | 236.83 |
Ingersoll Rand’s target consensus slightly trails its current price of 98.52, indicating moderate upside potential. IDEX shows a robust target consensus well above its 210.41 price, signaling stronger expected appreciation.

Don’t Let Luck Decide Your Entry Point
Optimize your entry points with our advanced ProRealTime indicators. You’ll get efficient buy signals with precise price targets for maximum performance. Start outperforming now!
How do institutions grade them?
Here is a comparison of the latest institutional grades for Ingersoll Rand Inc. and IDEX Corporation:
Ingersoll Rand Inc. Grades
The table below summarizes recent grades from notable financial institutions for Ingersoll Rand Inc.:
| Grading Company | Action | New Grade | Date |
|---|---|---|---|
| Stifel | Maintain | Hold | 2026-01-23 |
| Citigroup | Maintain | Buy | 2026-01-12 |
| Wells Fargo | Maintain | Overweight | 2026-01-07 |
| Stifel | Maintain | Hold | 2025-12-16 |
| Citigroup | Maintain | Buy | 2025-12-08 |
| Citigroup | Maintain | Buy | 2025-11-03 |
| Baird | Maintain | Outperform | 2025-11-03 |
| Stifel | Maintain | Hold | 2025-10-20 |
| Wells Fargo | Maintain | Overweight | 2025-10-06 |
| Morgan Stanley | Maintain | Equal Weight | 2025-08-13 |
IDEX Corporation Grades
Below is the recent grading summary for IDEX Corporation from leading analysts:
| Grading Company | Action | New Grade | Date |
|---|---|---|---|
| Argus Research | Upgrade | Buy | 2026-02-06 |
| RBC Capital | Maintain | Outperform | 2026-02-05 |
| Citigroup | Maintain | Buy | 2026-02-05 |
| DA Davidson | Maintain | Neutral | 2026-02-05 |
| TD Cowen | Maintain | Buy | 2026-02-05 |
| Stifel | Maintain | Buy | 2026-01-23 |
| Citigroup | Maintain | Buy | 2025-12-08 |
| RBC Capital | Maintain | Outperform | 2025-10-30 |
| Stifel | Maintain | Buy | 2025-10-20 |
| Oppenheimer | Maintain | Outperform | 2025-10-07 |
Which company has the best grades?
IDEX Corporation consistently earns “Buy” and “Outperform” ratings with an upgrade from Argus Research. In contrast, Ingersoll Rand Inc. holds a mix of “Hold,” “Buy,” and “Overweight” grades. IDEX’s stronger consensus signals greater analyst confidence, potentially influencing investor sentiment more positively.
Risks specific to each company
The following categories identify critical pressure points and systemic threats facing Ingersoll Rand Inc. and IDEX Corporation in the 2026 market environment:
1. Market & Competition
Ingersoll Rand Inc.
- Faces intense competition in industrial machinery; net margin is moderate at 7.6% indicating pricing pressure.
IDEX Corporation
- Commands stronger profitability with 14% net margin, signaling better competitive positioning.
2. Capital Structure & Debt
Ingersoll Rand Inc.
- Maintains moderate leverage (D/E 0.47) with solid interest coverage of 5.58x; balance sheet is stable but cautious.
IDEX Corporation
- Similar leverage (D/E 0.45) but superior interest coverage at 10.82x, indicating more comfortable debt servicing capacity.
3. Stock Volatility
Ingersoll Rand Inc.
- Beta of 1.31 suggests higher stock volatility, exposing investors to greater market swings.
IDEX Corporation
- Beta near 1.0 signals lower volatility, offering a steadier risk profile amid market fluctuations.
4. Regulatory & Legal
Ingersoll Rand Inc.
- Operates globally with exposure to diverse regulatory regimes, increasing compliance complexity.
IDEX Corporation
- Also global but with a more focused product range, potentially limiting regulatory risk scope.
5. Supply Chain & Operations
Ingersoll Rand Inc.
- Wide product portfolio increases operational complexity and supply chain vulnerabilities.
IDEX Corporation
- Streamlined segments reduce operational risks and enhance supply chain resilience.
6. ESG & Climate Transition
Ingersoll Rand Inc.
- Industrial sector exposure demands significant adaptation to climate policies; risks of transition costs.
IDEX Corporation
- Innovation in fluid and safety technologies may position it better for ESG compliance and market shifts.
7. Geopolitical Exposure
Ingersoll Rand Inc.
- Presence in multiple regions, including volatile markets, raises geopolitical risk.
IDEX Corporation
- More US-centric operations limit geopolitical exposure but could miss growth in emerging markets.
Which company shows a better risk-adjusted profile?
IDEX Corporation faces less stock volatility and stronger debt coverage, reflecting a sturdier financial foundation. Ingersoll Rand struggles with higher market risk and weaker profitability metrics. IDEX’s superior Altman Z-Score (5.22 vs. 3.93) and Piotroski score (8 vs. 6) confirm better financial health. However, I remain cautious about IDEX’s moderately unfavorable valuation multiples, which could cap upside. Overall, IDEX offers a better risk-adjusted profile given its balanced operational focus and financial strength, while Ingersoll Rand’s higher leverage and earnings pressure increase downside risk.
Final Verdict: Which stock to choose?
Ingersoll Rand Inc. (IR) stands out for its operational resilience and improving profitability despite currently destroying value on a capital efficiency basis. Its robust liquidity and low leverage make it a strong candidate for portfolios seeking steady industrial exposure with some patience for margin recovery. The main point of vigilance remains its below-cost-of-capital returns, which could pressure valuation in tougher cycles. This name suits investors with a tolerance for cyclical risk and a focus on long-term turnaround potential.
IDEX Corporation (IEX) boasts a clearer strategic moat with higher returns on invested capital and a strong income profile. Its superior cash flow yield and safer capital structure provide a cushion against economic volatility relative to IR. However, the recent decline in ROIC signals caution on sustaining competitive advantage. I see IEX fitting portfolios aiming for growth at a reasonable price, emphasizing stability and consistent value creation over cyclical rebound plays.
If you prioritize long-term value creation with a focus on operational improvement, IR offers an intriguing scenario due to its improving cash generation and financial stability. However, if you seek a more mature business with a defined moat and better current profitability, IEX outshines IR by offering better stability and stronger returns despite a premium valuation. Both require close monitoring of capital efficiency trends to validate their investment thesis.
Disclaimer: Investment carries a risk of loss of initial capital. The past performance is not a reliable indicator of future results. Be sure to understand risks before making an investment decision.
Go Further
I encourage you to read the complete analyses of Ingersoll Rand Inc. and IDEX Corporation to enhance your investment decisions: