Home > Comparison > Industrials > PCAR vs HY
The strategic rivalry between PACCAR Inc and Hyster-Yale Materials Handling, Inc. shapes the competitive landscape in the Industrials sector. PACCAR operates as a capital-intensive manufacturer of commercial trucks with integrated financial services. In contrast, Hyster-Yale specializes in engineered lift trucks and material handling solutions, emphasizing innovation in fuel-cell technology. This analysis will evaluate which company’s operational model delivers superior risk-adjusted returns for investors seeking diversified industrial exposure.
Table of contents
Companies Overview
PACCAR Inc and Hyster-Yale Materials Handling, Inc. both play critical roles in the industrial machinery sector, shaping global logistics and materials handling.
PACCAR Inc: Global Leader in Commercial Trucks
PACCAR Inc dominates the commercial truck manufacturing market with its Kenworth, Peterbilt, and DAF brands. Its core revenue stems from designing, manufacturing, and distributing trucks and aftermarket parts. In 2026, PACCAR’s strategic focus emphasizes expanding its financial services segment, including leasing and truck financing, to strengthen customer retention and dealer support worldwide.
Hyster-Yale Materials Handling, Inc.: Specialist in Lift Trucks
Hyster-Yale leads in lift trucks and material handling equipment, marketing under the Hyster and Yale brands. The company’s primary revenue comes from manufacturing and servicing lift trucks, components, and attachments. Its 2026 strategy centers on innovation in hydrogen fuel-cell technology and expanding aftermarket parts sales to enhance competitive positioning in global industrial markets.
Strategic Collision: Similarities & Divergences
Both companies emphasize industrial machinery but diverge sharply in their business models. PACCAR builds a closed ecosystem through truck manufacturing and integrated financial services. Hyster-Yale focuses on an open infrastructure with diversified equipment lines and aftermarket parts, including emerging fuel-cell tech. Their battleground is global logistics and materials handling efficiency, yet their investment profiles differ: PACCAR favors scale and financing, while Hyster-Yale bets on innovation and niche market expansion.
Income Statement Comparison
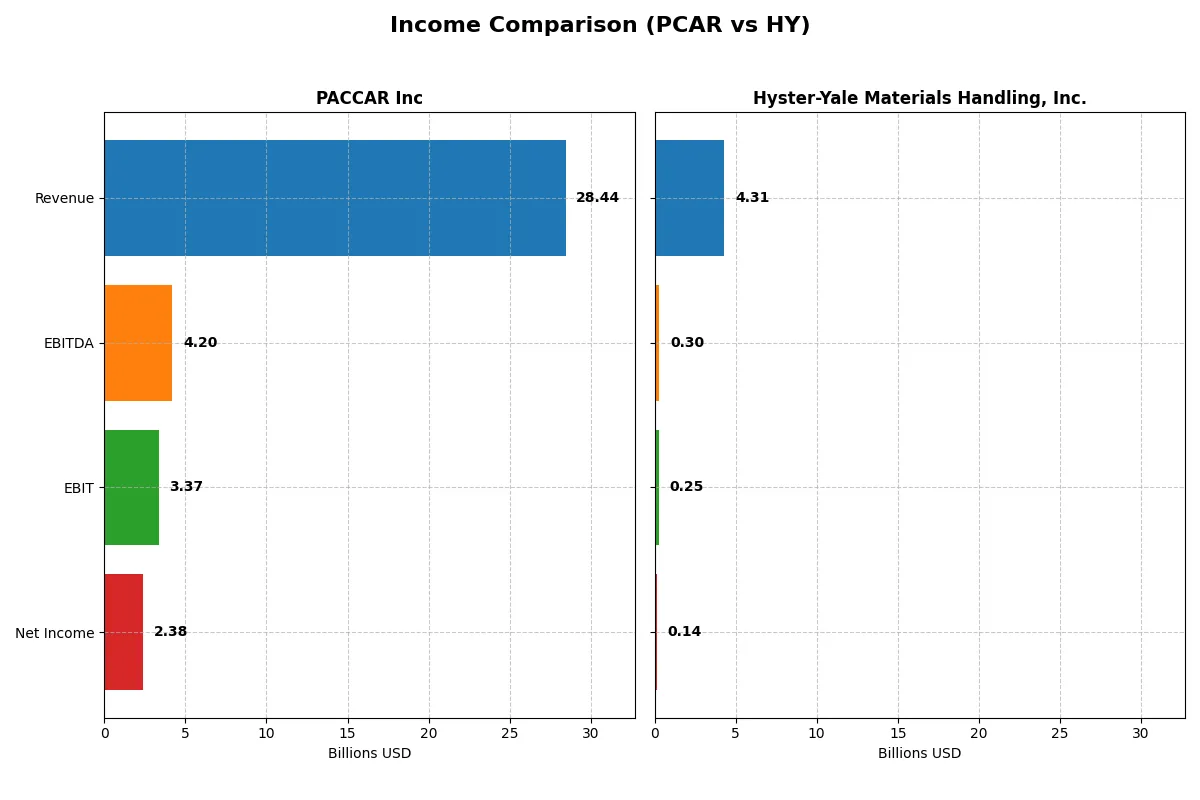
The following data dissects the core profitability and scalability of both corporate engines to reveal who dominates the bottom line:
| Metric | PACCAR Inc (PCAR) | Hyster-Yale Materials Handling, Inc. (HY) |
|---|---|---|
| Revenue | 28.4B | 4.31B |
| Cost of Revenue | 23.8B | 3.41B |
| Operating Expenses | 1.66B | 651M |
| Gross Profit | 4.62B | 896M |
| EBITDA | 4.20B | 300M |
| EBIT | 3.37B | 253M |
| Interest Expense | 347M | 34M |
| Net Income | 2.38B | 142M |
| EPS | 4.52 | 8.16 |
| Fiscal Year | 2025 | 2024 |
Income Statement Analysis: The Bottom-Line Duel
This income statement comparison reveals the true efficiency and profitability of PACCAR Inc and Hyster-Yale Materials Handling as corporate engines.
PACCAR Inc Analysis
PACCAR’s revenue grew 21% from 2021 to 2025 but declined 15.5% in the latest year to $28.4B. Net income followed a similar pattern, increasing 27% over five years, then dropping 32% to $2.38B in 2025. The firm maintains healthy gross (16.2%) and net margins (8.35%) with a strong EBIT margin of 11.85%, reflecting solid operational efficiency despite recent softness.
Hyster-Yale Materials Handling Analysis
Hyster-Yale expanded revenue by 53% from 2020 to 2024, reaching $4.31B with a modest 4.6% rise last year. Net income surged 284% over five years, hitting $142M in 2024, supported by a favorable gross margin of 20.8%. Its net margin stands lower at 3.3%, but margin and EPS growth remain robust, signaling improving profitability and momentum.
Margin Strength vs. Growth Momentum
PACCAR exhibits stronger profitability margins and scale but faces recent declines in revenue and net income. In contrast, Hyster-Yale shows impressive revenue and net income growth with expanding margins from a smaller base. For investors, PACCAR offers stable margin power while Hyster-Yale presents high growth potential, appealing to different risk and return profiles.
Financial Ratios Comparison
These vital ratios act as a diagnostic tool to expose the underlying fiscal health, valuation premiums, and capital efficiency of the companies compared below:
| Ratios | PACCAR Inc (PCAR) | Hyster-Yale Materials Handling, Inc. (HY) |
|---|---|---|
| ROE | 12.33% | 29.95% |
| ROIC | 6.39% | 13.59% |
| P/E | 24.25 | 6.24 |
| P/B | 2.99 | 1.87 |
| Current Ratio | 1.70 | 1.35 |
| Quick Ratio | 1.42 | 0.64 |
| D/E | 0.00 | 1.14 |
| Debt-to-Assets | 0.00 | 26.70% |
| Interest Coverage | 8.55 | 7.24 |
| Asset Turnover | 0.64 | 2.12 |
| Fixed Asset Turnover | 6.31 | 14.05 |
| Payout ratio | 95.42% | 16.87% |
| Dividend yield | 3.94% | 2.70% |
| Fiscal Year | 2025 | 2024 |
Efficiency & Valuation Duel: The Vital Signs
Financial ratios act as a company’s DNA, uncovering hidden risks and revealing operational excellence crucial for investment insight.
PACCAR Inc
PACCAR shows neutral profitability with a 12.33% ROE and 8.35% net margin, reflecting steady but unspectacular returns. Its valuation is neutral, with a P/E of 24.25 and P/B of 2.99 indicating a fairly priced stock. PACCAR rewards shareholders with a 3.94% dividend yield, signaling consistent income over growth reinvestment.
Hyster-Yale Materials Handling, Inc.
Hyster-Yale posts a robust 29.95% ROE but a low 3.3% net margin, suggesting high leverage or operational inefficiency. Its valuation appears attractive with a P/E of 6.24 and a P/B of 1.87, denoting a potentially undervalued stock. The 2.7% dividend yield complements its favorable capital returns, balancing income with growth prospects.
Premium Valuation vs. Operational Efficiency
PACCAR offers balanced profitability and a stable dividend, reflecting operational safety with moderate valuation. Hyster-Yale delivers higher returns on equity at a cheaper price but with margin concerns and elevated debt. Investors seeking steady income may prefer PACCAR; those favoring growth potential might lean toward Hyster-Yale’s riskier profile.
Which one offers the Superior Shareholder Reward?
I compare PACCAR Inc (PCAR) and Hyster-Yale Materials Handling, Inc. (HY) on dividends, payout ratios, and buybacks, focusing on total shareholder return sustainability in 2026. PCAR yields 3.9% with a high payout ratio of 95%, signaling mature, shareholder-friendly cash flow use. HY yields 2.7% but retains more cash for growth, with a 17% payout ratio. Both use buybacks, but PCAR’s capital allocation—backed by 68% free cash flow coverage—better sustains dividends and buybacks. HY’s lower margins and higher leverage make its model riskier despite growth focus. I find PCAR offers the superior total return profile for prudent investors in 2026.
Comparative Score Analysis: The Strategic Profile
The radar chart reveals the fundamental DNA and trade-offs of PACCAR Inc and Hyster-Yale Materials Handling, Inc., highlighting their distinct financial strengths and vulnerabilities:
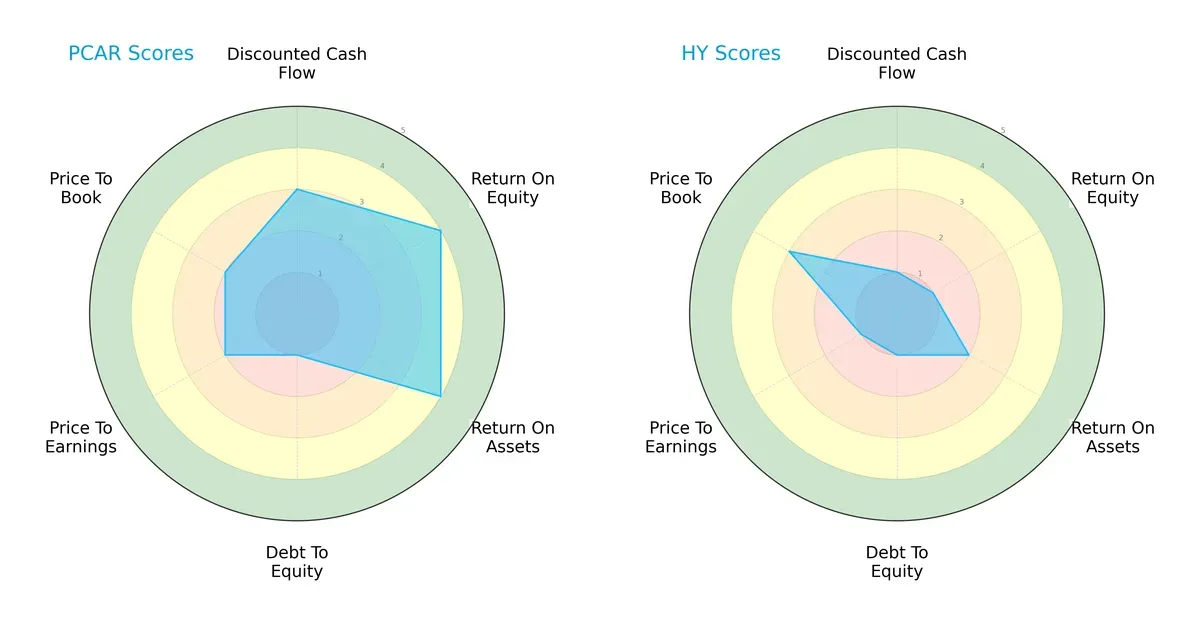
PACCAR shows a balanced profile with favorable ROE (4) and ROA (4) scores, indicating efficient profit generation and asset use. However, its debt-to-equity score is very unfavorable (1), signaling high leverage risk. Hyster-Yale scores very low in most areas except a moderate price-to-book (3), relying more on valuation metrics than operational efficiency. PACCAR’s moderate DCF (3) and valuation scores (2) contrast with Hyster-Yale’s very unfavorable scores (1) in these categories, underscoring PACCAR’s more stable financial foundation.
Bankruptcy Risk: Solvency Showdown
PACCAR’s Altman Z-Score of 2.53 versus Hyster-Yale’s 2.69 places both firms in the grey zone, indicating moderate bankruptcy risk amid current market volatility:
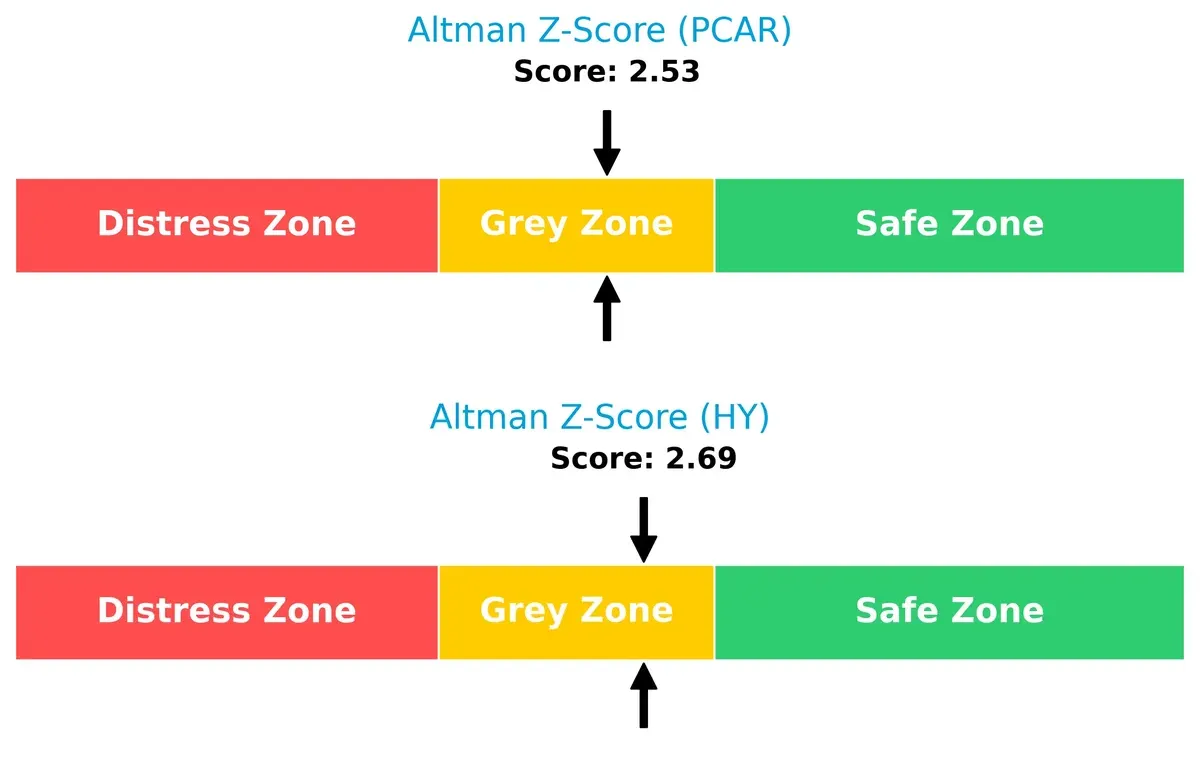
Both companies face some financial strain, but neither is in immediate distress. Investors should monitor leverage and liquidity trends closely as market conditions evolve.
Financial Health: Quality of Operations
PACCAR and Hyster-Yale share an identical Piotroski F-Score of 5, reflecting average financial health with no clear red flags or standout strengths in internal operations:
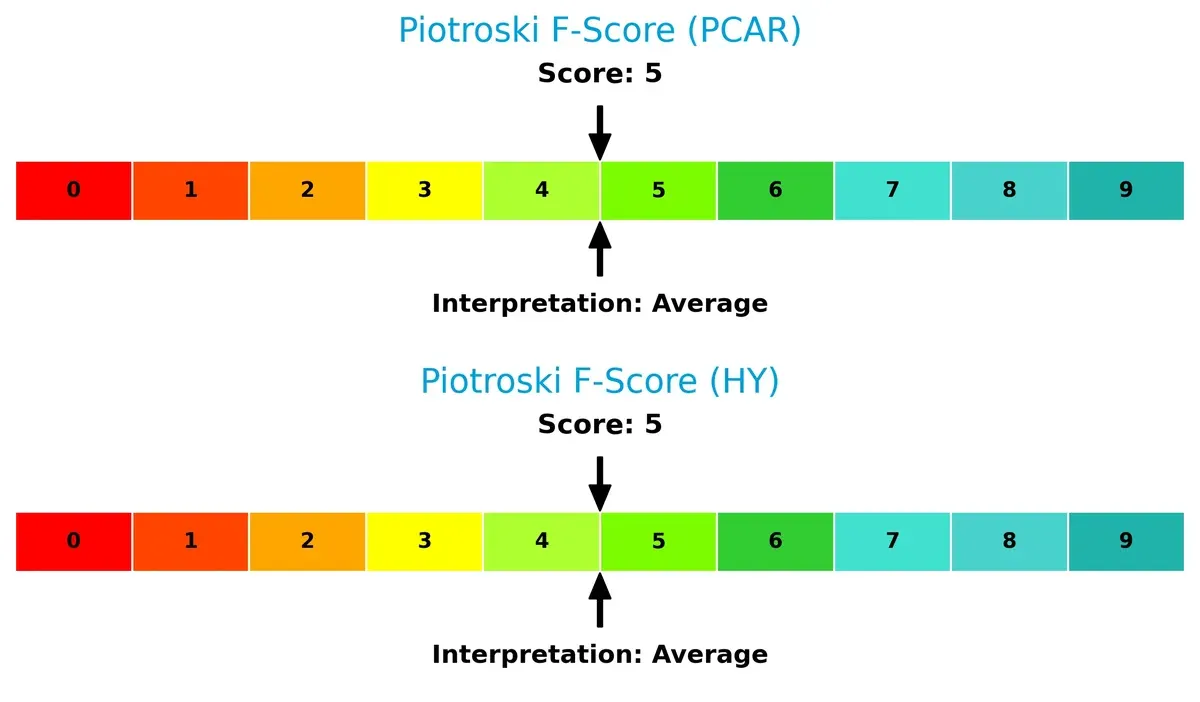
This parity suggests both firms maintain moderate operational quality but lack the robustness seen in top-tier performers. Caution is warranted given the mixed signals from other financial metrics.
How are the two companies positioned?
This section dissects the operational DNA of PACCAR and Hyster-Yale by comparing their revenue distribution across segments and analyzing internal strengths and weaknesses. The goal is to confront their economic moats to reveal which business model delivers the most resilient and sustainable competitive advantage today.
Revenue Segmentation: The Strategic Mix
The following visual comparison dissects how PACCAR Inc and Hyster-Yale Materials Handling diversify their income streams and where their primary sector bets lie:
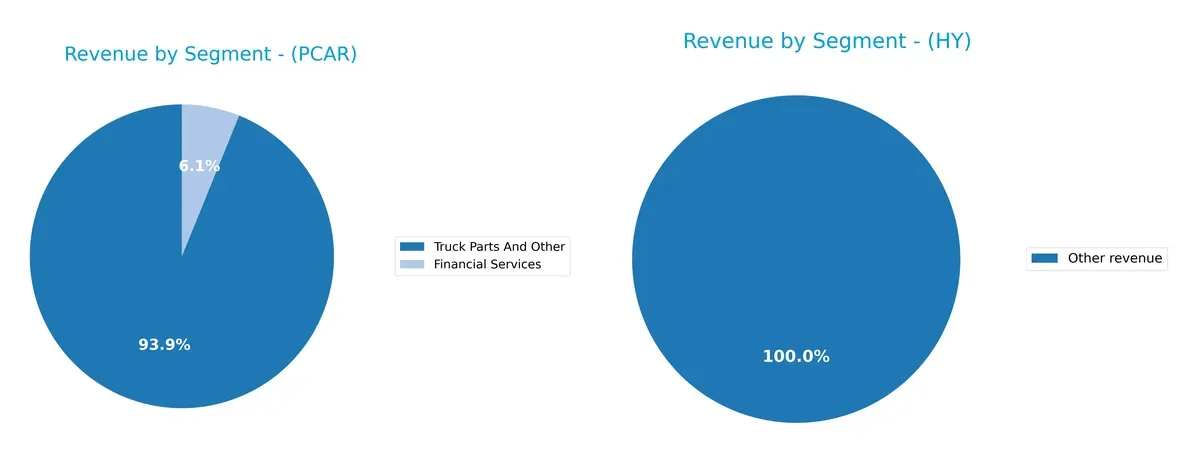
PACCAR Inc anchors its revenue in “Truck Parts And Other” with $32B in 2024, dwarfing its $2.1B Financial Services segment. This concentration signals infrastructure dominance but exposes it to truck market cycles. Hyster-Yale spreads revenue more evenly, with a $3.36B Lift truck business complemented by $356M in Other revenue and smaller units like Bolzoni and JAPIC. This mix reduces concentration risk and pivots on diverse industrial equipment demand.
Strengths and Weaknesses Comparison
This table compares the Strengths and Weaknesses of PACCAR Inc and Hyster-Yale Materials Handling, Inc.:
PACCAR Inc Strengths
- Strong financial services and truck parts diversification
- Favorable liquidity ratios with current ratio 1.7 and zero debt
- Global presence with substantial U.S., Europe, and other markets revenue
Hyster-Yale Strengths
- High profitability with ROE 29.95% and ROIC 13.59%
- Favorable asset turnover and fixed asset turnover ratios
- Geographic diversification across Americas and EMEA regions
PACCAR Inc Weaknesses
- Profitability ratios neutral with net margin 8.35% below WACC 8.62%
- Moderate asset turnover 0.64 limits efficiency
- PE ratio relatively high at 24.25
Hyster-Yale Weaknesses
- Low net margin 3.3% despite strong ROE
- Unfavorable quick ratio 0.64 and debt-to-equity 1.14 indicate financial leverage risk
- Smaller revenue scale in non-U.S. markets
PACCAR shows strength in balance sheet health and geographic reach but faces middling profitability and asset efficiency. Hyster-Yale exhibits strong returns and operational efficiency, balanced against financial leverage and thinner margins. These contrasts highlight differing strategic priorities in capital structure and market focus.
The Moat Duel: Analyzing Competitive Defensibility
A structural moat is the only fortress protecting long-term profits from relentless competitive erosion. Here’s how PACCAR and Hyster-Yale stand:
PACCAR Inc: Legacy Brand & Dealer Network Moat
PACCAR relies on its entrenched dealer network and strong brand loyalty, showing stable margins but declining ROIC signals weakening competitive advantage in 2026.
Hyster-Yale Materials Handling: Innovation & Operational Efficiency Moat
Hyster-Yale’s moat stems from operational efficiency and innovation in hydrogen fuel cells, driving strong ROIC growth and expanding market reach beyond PACCAR’s traditional footprint.
Innovation & Efficiency vs. Legacy & Scale
Hyster-Yale exhibits a wider and deeper moat with rising ROIC and value creation, while PACCAR struggles with declining profitability, making Hyster-Yale better positioned to defend and grow market share.
Which stock offers better returns?
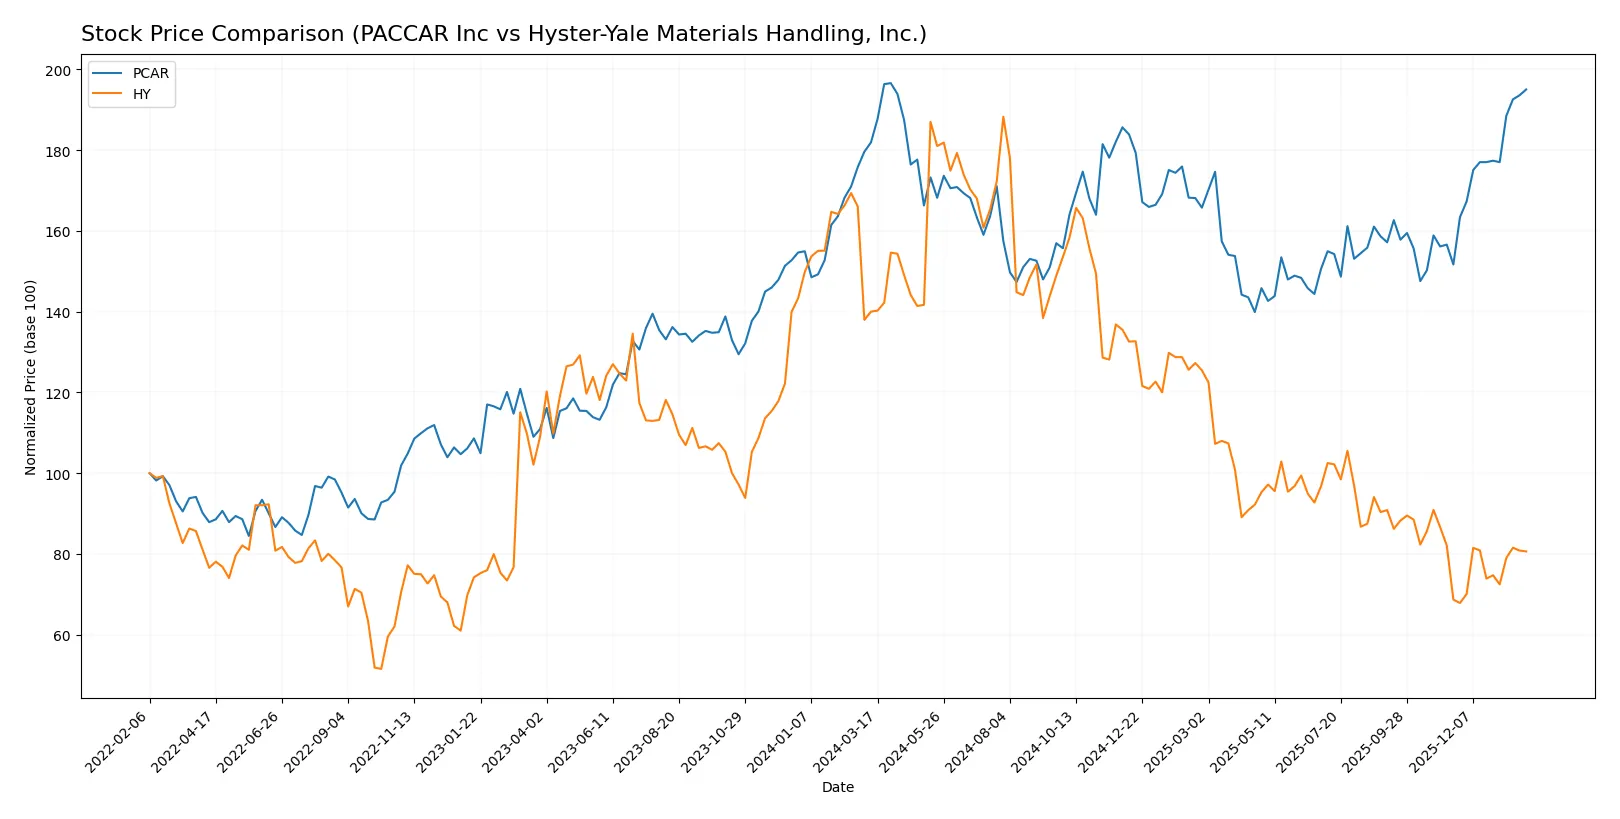
The past year reveals contrasting price dynamics: PACCAR Inc gains steadily with accelerating momentum, while Hyster-Yale Materials Handling, Inc. suffers a sharp decline despite a recent partial recovery.
Trend Comparison
PACCAR Inc’s stock rose 7.2% over the past year, signaling a bullish trend with accelerating price gains and a high near 124. Volatility measured by an 8.83% standard deviation supports active trading.
Hyster-Yale’s stock fell 42.43% over the same period, marking a clear bearish trend with accelerating losses. The price range widened significantly, reflecting elevated volatility at a 13.8% standard deviation.
PACCAR outperformed Hyster-Yale by a wide margin, delivering positive returns against a steep decline. PACCAR’s bullish momentum contrasts sharply with Hyster-Yale’s extended downtrend.
Target Prices
Analysts present a mixed but clear target consensus for PACCAR Inc and Hyster-Yale Materials Handling, Inc.
| Company | Target Low | Target High | Consensus |
|---|---|---|---|
| PACCAR Inc | 86 | 138 | 106 |
| Hyster-Yale Materials Handling, Inc. | 40 | 40 | 40 |
PACCAR’s target consensus at 106 sits below its current price of 122.91, suggesting limited upside or potential downside risk. Hyster-Yale’s consensus target of 40 exceeds its 33.45 stock price, indicating room for growth according to analysts.

Don’t Let Luck Decide Your Entry Point
Optimize your entry points with our advanced ProRealTime indicators. You’ll get efficient buy signals with precise price targets for maximum performance. Start outperforming now!
How do institutions grade them?
The following tables summarize recent grades assigned by institutional analysts for the two companies:
PACCAR Inc Grades
This table shows the most recent institutional grades for PACCAR Inc.
| Grading Company | Action | New Grade | Date |
|---|---|---|---|
| Citigroup | Maintain | Neutral | 2026-01-29 |
| Truist Securities | Maintain | Hold | 2026-01-28 |
| Wells Fargo | Maintain | Equal Weight | 2026-01-23 |
| JP Morgan | Maintain | Overweight | 2026-01-14 |
| Citigroup | Maintain | Neutral | 2026-01-13 |
| Morgan Stanley | Maintain | Equal Weight | 2026-01-13 |
| JP Morgan | Upgrade | Overweight | 2025-12-19 |
| Citigroup | Maintain | Neutral | 2025-12-11 |
| Wolfe Research | Upgrade | Peer Perform | 2025-10-22 |
| JP Morgan | Maintain | Neutral | 2025-10-22 |
Hyster-Yale Materials Handling, Inc. Grades
This table shows the most recent institutional grades for Hyster-Yale Materials Handling, Inc.
| Grading Company | Action | New Grade | Date |
|---|---|---|---|
| Roth MKM | Maintain | Buy | 2024-11-06 |
| Roth MKM | Maintain | Buy | 2024-08-08 |
| Roth MKM | Maintain | Buy | 2024-06-07 |
| Northland Capital Markets | Upgrade | Outperform | 2024-06-05 |
| Northland Capital Markets | Downgrade | Market Perform | 2024-05-10 |
| Roth MKM | Maintain | Buy | 2024-05-09 |
| EF Hutton | Maintain | Buy | 2023-05-04 |
| EF Hutton | Maintain | Buy | 2023-05-03 |
| EF Hutton | Maintain | Buy | 2023-03-01 |
| EF Hutton | Maintain | Buy | 2022-03-02 |
Which company has the best grades?
Hyster-Yale consistently receives Buy ratings, indicating stronger analyst confidence versus PACCAR’s mixed Neutral to Overweight grades. This may influence investors seeking clearer bullish signals.
Risks specific to each company
The following categories identify critical pressure points and systemic threats facing PACCAR Inc and Hyster-Yale Materials Handling, Inc. in the 2026 market environment:
1. Market & Competition
PACCAR Inc
- Operates globally with strong truck brands; faces intense competition in commercial trucks.
Hyster-Yale Materials Handling, Inc.
- Specializes in lift trucks and aftermarket parts; competes in niche industrial machinery markets.
2. Capital Structure & Debt
PACCAR Inc
- Zero debt-to-equity ratio indicates a very strong balance sheet and low financial risk.
Hyster-Yale Materials Handling, Inc.
- High debt-to-equity (1.14) poses leverage risk despite manageable debt-to-assets ratio.
3. Stock Volatility
PACCAR Inc
- Beta of 1.024 suggests stock volatility slightly above market average, indicating moderate risk.
Hyster-Yale Materials Handling, Inc.
- Higher beta of 1.441 implies more pronounced sensitivity to market swings and greater volatility.
4. Regulatory & Legal
PACCAR Inc
- Subject to stringent emissions and safety regulations in multiple jurisdictions.
Hyster-Yale Materials Handling, Inc.
- Faces evolving regulations on industrial equipment and emerging hydrogen fuel-cell technology.
5. Supply Chain & Operations
PACCAR Inc
- Large-scale global operations may face supply chain complexity but benefit from dealer networks.
Hyster-Yale Materials Handling, Inc.
- Smaller scale and specialized components risk greater disruption from supplier constraints.
6. ESG & Climate Transition
PACCAR Inc
- Moderate ESG risks; pressure to improve emissions in heavy-duty trucking.
Hyster-Yale Materials Handling, Inc.
- Opportunities and risks linked to hydrogen fuel-cell development and sustainability initiatives.
7. Geopolitical Exposure
PACCAR Inc
- Global footprint exposes it to trade tensions and regional economic fluctuations.
Hyster-Yale Materials Handling, Inc.
- Less global but still vulnerable to US and international trade policies affecting industrial sectors.
Which company shows a better risk-adjusted profile?
PACCAR’s zero debt and moderate volatility underpin a more stable financial foundation. Hyster-Yale’s higher leverage and stock volatility increase financial and market risk. PACCAR’s strong capital structure and favorable liquidity ratios demonstrate superior risk management. Hyster-Yale’s advances in hydrogen tech offer growth but add execution uncertainty. The most impactful risk for PACCAR is global market competition with evolving regulations. For Hyster-Yale, it is its high leverage combined with operational scale limitations. PACCAR shows a better risk-adjusted profile, justified by its robust balance sheet and lower beta amid 2026’s economic uncertainties.
Final Verdict: Which stock to choose?
PACCAR Inc’s superpower lies in its robust operational efficiency and strong liquidity position, making it a reliable cash generator in a capital-intensive industry. The point of vigilance remains its declining profitability and value destruction trend, which could pressure long-term returns. It suits portfolios aiming for steady, defensive industrial exposure.
Hyster-Yale Materials Handling boasts a durable competitive moat through improving returns on invested capital and an attractive valuation profile. Its strategic advantage is reinforced by rapid profitability growth and efficient asset use, although higher leverage and weaker liquidity temper its safety compared to PACCAR. It fits growth-oriented portfolios willing to accept moderate risk.
If you prioritize operational stability and consistent cash flow, PACCAR is the compelling choice due to its solid balance sheet and dividend yield. However, if you seek higher growth potential with a strong value creation track record, Hyster-Yale offers better upside through expanding profitability and an improving competitive position. Both present distinct analytical scenarios tailored to differing risk appetites and investment horizons.
Disclaimer: Investment carries a risk of loss of initial capital. The past performance is not a reliable indicator of future results. Be sure to understand risks before making an investment decision.
Go Further
I encourage you to read the complete analyses of PACCAR Inc and Hyster-Yale Materials Handling, Inc. to enhance your investment decisions: