Home > Comparison > Financial Services > GS vs HUT
The strategic rivalry between The Goldman Sachs Group, Inc. and Hut 8 Corp. shapes the Financial Services sector’s future. Goldman Sachs operates as a diversified capital markets powerhouse with broad advisory and asset management services. In contrast, Hut 8 is a niche player focused on energy-intensive Bitcoin mining and data center operations. This analysis will clarify which business model offers a superior risk-adjusted return for a diversified portfolio navigating evolving market dynamics.
Table of contents
Companies Overview
Goldman Sachs and Hut 8 Corp. represent two distinct pillars within the capital markets space, each with unique operational DNA and growth vectors.
The Goldman Sachs Group, Inc.: Global Financial Powerhouse
Goldman Sachs stands as a leading financial institution, generating revenue through diverse streams including investment banking, asset management, and wealth management. In 2026, it sharpened its focus on expanding client advisory services and enhancing digital platforms to sustain its competitive edge in global markets.
Hut 8 Corp.: Digital Asset Mining Specialist
Hut 8 Corp. operates as a vertically integrated Bitcoin mining and data center operator. It earns primarily from powering compute-intensive workloads with a strategic emphasis on scaling energy infrastructure and mining capacity in 2026, leveraging technology to capitalize on the crypto asset boom.
Strategic Collision: Similarities & Divergences
Goldman Sachs pursues a broad financial services model with a strong advisory and asset management focus, while Hut 8 bets on niche specialization in digital asset infrastructure. Their competition centers on capital allocation in emerging technology sectors and evolving client demands. This contrast defines Goldman Sachs as a diversified financial stalwart versus Hut 8’s high-volatility, technology-driven growth profile.
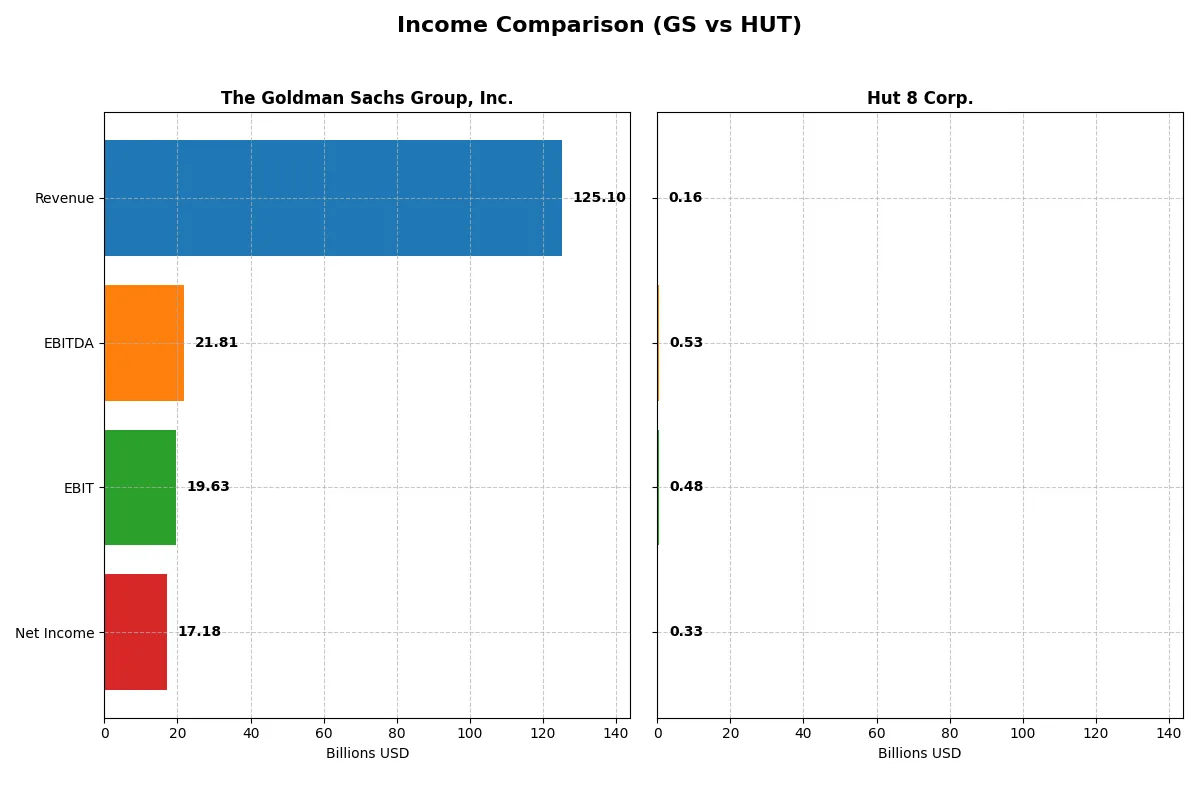
Income Statement Comparison
The following data dissects the core profitability and scalability of both corporate engines to reveal who dominates the bottom line:
| Metric | The Goldman Sachs Group, Inc. (GS) | Hut 8 Corp. (HUT) |
|---|---|---|
| Revenue | 125.1B | 162.4M |
| Cost of Revenue | 67.9B | 86.7M |
| Operating Expenses | 37.5B | -384.8M |
| Gross Profit | 57.2B | 75.7M |
| EBITDA | 21.8B | 528.7M |
| EBIT | 19.6B | 481.7M |
| Interest Expense | 66.8B | 29.8M |
| Net Income | 17.2B | 331.9M |
| EPS | 51.95 | 3.71 |
| Fiscal Year | 2025 | 2024 |
Income Statement Analysis: The Bottom-Line Duel
This income statement comparison reveals which company demonstrates superior operational efficiency and profit conversion over recent years.
The Goldman Sachs Group, Inc. Analysis
Goldman Sachs’s revenue grew 92% from 2021 to 2025, reaching $125B in 2025, but dipped slightly by 1.4% year-over-year. Net income showed volatility, declining 20.6% overall but rising 22% from 2024 to 2025 to $17.2B. Gross margin remains healthy at 45.7%, sustaining solid profitability despite a heavy interest expense burden of 53.4%. The firm’s net margin of 13.7% and rising EPS momentum signal disciplined cost control amid challenging conditions.
Hut 8 Corp. Analysis
Hut 8’s revenue surged nearly 299% over 2020-2024, hitting $162M in 2024 with a sharp 69% annual jump. Net income skyrocketed 1,819% over the period, reaching $332M, driven by an extraordinary net margin of 204%, reflecting one-off gains or accounting effects. Its gross margin of 46.6% is strong, and EBIT margin at 297% indicates operational leverage, but an 18.4% interest expense ratio tempers enthusiasm. The firm’s rapid EPS growth underscores emerging momentum but reflects a nascent, volatile business model.
Margin Power vs. Growth Momentum
Goldman Sachs delivers steady scale with consistent margins and improving net income, reflecting deep operational expertise in a mature sector. Hut 8 boasts explosive revenue and profit growth, driven by high margins but accompanied by elevated interest costs and earnings volatility. The fundamental winner depends on investor preference for stable cash flow or high-growth potential in a riskier profile.
Financial Ratios Comparison
These vital ratios act as a diagnostic tool to expose the underlying fiscal health, valuation premiums, and capital efficiency of the companies compared below:
| Ratios | The Goldman Sachs Group, Inc. (GS) | Hut 8 Corp. (HUT) |
|---|---|---|
| ROE | 13.74% | 33.98% |
| ROIC | 0.98% | 23.99% |
| P/E | 16.0 | 5.64 |
| P/B | 2.20 | 1.92 |
| Current Ratio | 1.21 | 1.67 |
| Quick Ratio | 1.21 | 1.67 |
| D/E (Debt-to-Equity) | 4.95 | 0.35 |
| Debt-to-Assets | 34.2% | 22.8% |
| Interest Coverage | 0.29 | 15.46 |
| Asset Turnover | 0.069 | 0.107 |
| Fixed Asset Turnover | 3.47 | 0.67 |
| Payout ratio | 25.5% | 0% |
| Dividend yield | 1.59% | 0% |
| Fiscal Year | 2025 | 2024 |
Efficiency & Valuation Duel: The Vital Signs
Ratios serve as a company’s DNA, uncovering hidden risks and operational excellence that raw numbers alone cannot reveal.
The Goldman Sachs Group, Inc.
Goldman Sachs posts a solid 13.7% ROE and a favorable 13.7% net margin, signaling steady profitability. Its P/E of 16.0 and P/B of 2.2 mark it as fairly valued, neither expensive nor cheap. The firm returns value through a 1.59% dividend yield, balancing shareholder payouts with operational reinvestment.
Hut 8 Corp.
Hut 8 showcases a robust 33.98% ROE and an extraordinary net margin exceeding 200%, highlighting operational efficiency. With a low P/E of 5.64, the stock appears attractively priced. Despite no dividend, it reinvests aggressively in growth, reflected by strong liquidity and low leverage ratios supporting expansion.
Premium Valuation vs. Operational Safety
Hut 8 offers superior profitability and a more favorable valuation, but with greater reinvestment risk due to zero dividends. Goldman Sachs provides moderate returns with dividend stability and a balanced capital structure. Growth seekers may prefer Hut 8, while income investors might lean toward Goldman Sachs.
Which one offers the Superior Shareholder Reward?
I observe Goldman Sachs (GS) pays a steady dividend with a 1.6% yield and a manageable 25% payout ratio, supporting sustainability. GS also runs moderate buybacks, enhancing total return. Hut 8 Corp. (HUT) pays no dividends, focusing on reinvestment and growth. HUT’s buybacks are absent, signaling reliance on capital appreciation. GS’s model balances income and capital return, while HUT bets on volatile growth. In 2026, GS offers a more attractive total shareholder reward given its sustainable distributions and prudent capital allocation.
Comparative Score Analysis: The Strategic Profile
The radar chart reveals the fundamental DNA and strategic trade-offs of The Goldman Sachs Group, Inc. and Hut 8 Corp., highlighting their distinct financial strengths and weaknesses:
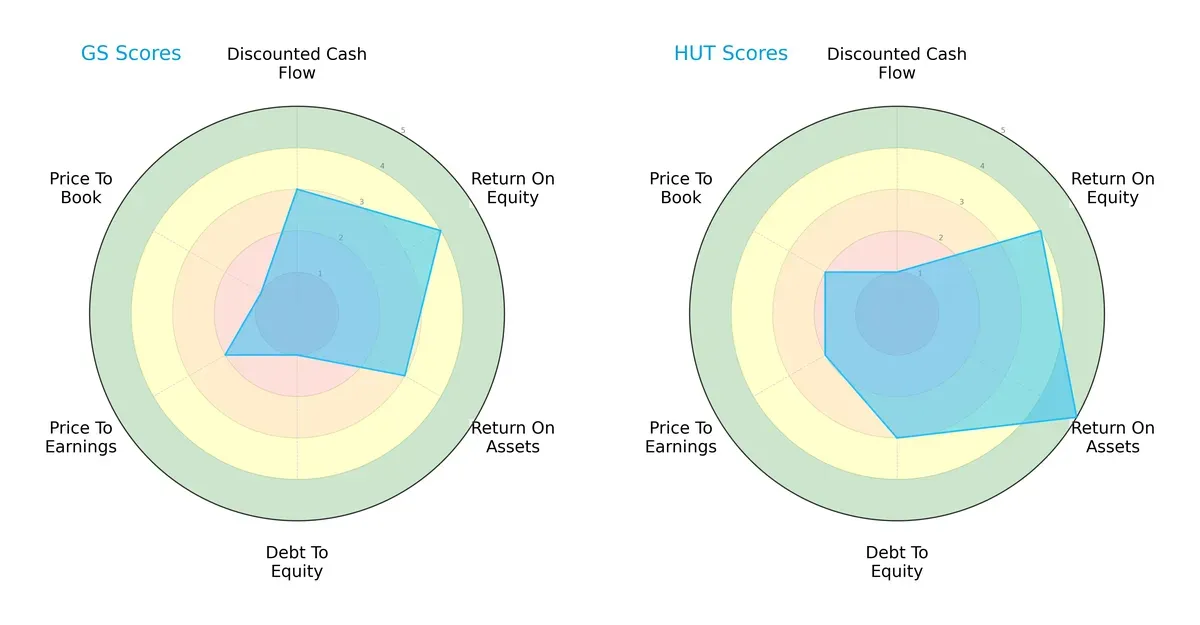
Goldman Sachs shows strength in discounted cash flow (3) and a solid return on equity (4), but its balance sheet is weakened by poor debt-to-equity (1) and price-to-book scores (1). Hut 8 excels in asset efficiency (ROA 5) and maintains a healthier debt profile (3), though it suffers from a weak discounted cash flow score (1). Hut 8 presents a more balanced profile, while Goldman Sachs relies heavily on profitability metrics despite leverage concerns.
Bankruptcy Risk: Solvency Showdown
The Altman Z-Score gap between Goldman Sachs (0.28, distress zone) and Hut 8 (3.41, safe zone) signals drastically different bankruptcy risks in this cycle:
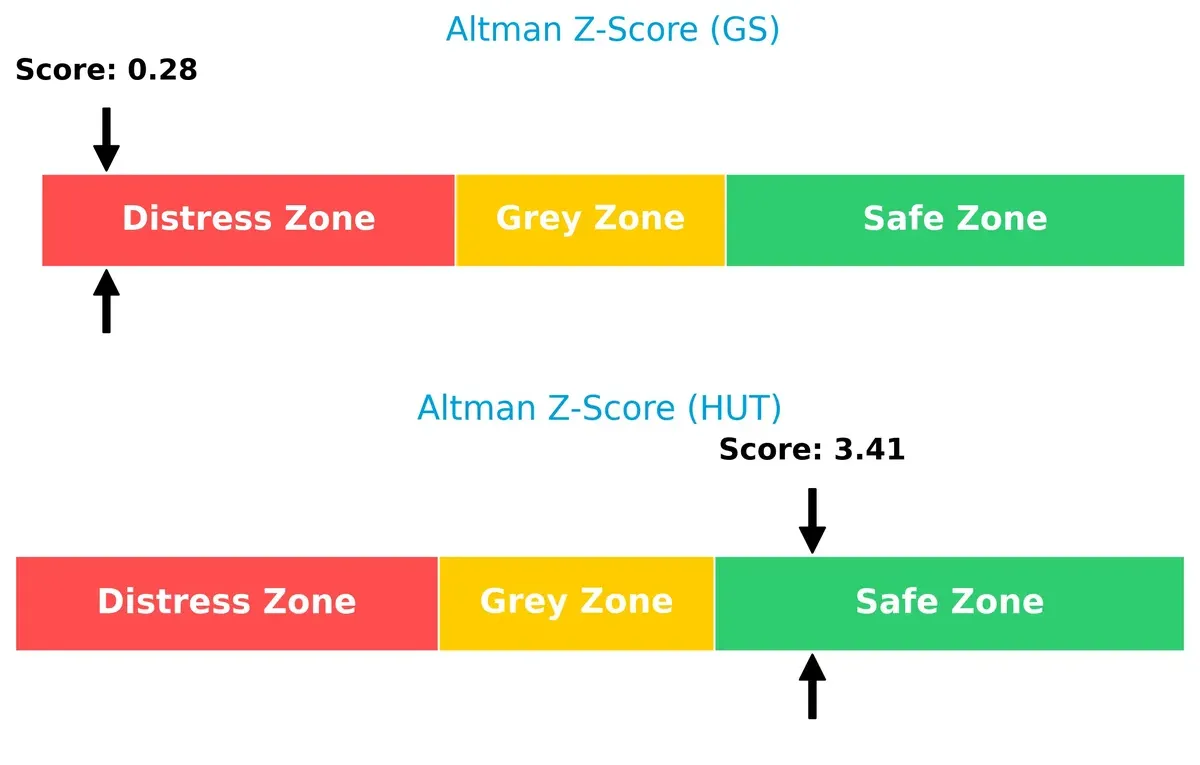
Goldman Sachs faces significant solvency challenges, suggesting elevated long-term default risk. In contrast, Hut 8 stands on solid financial footing, with a score firmly in the safe zone, indicating resilience against financial distress.
Financial Health: Quality of Operations
Goldman Sachs scores a robust 7 on the Piotroski F-Score, indicating strong financial health, while Hut 8’s 4 flags potential internal weaknesses:
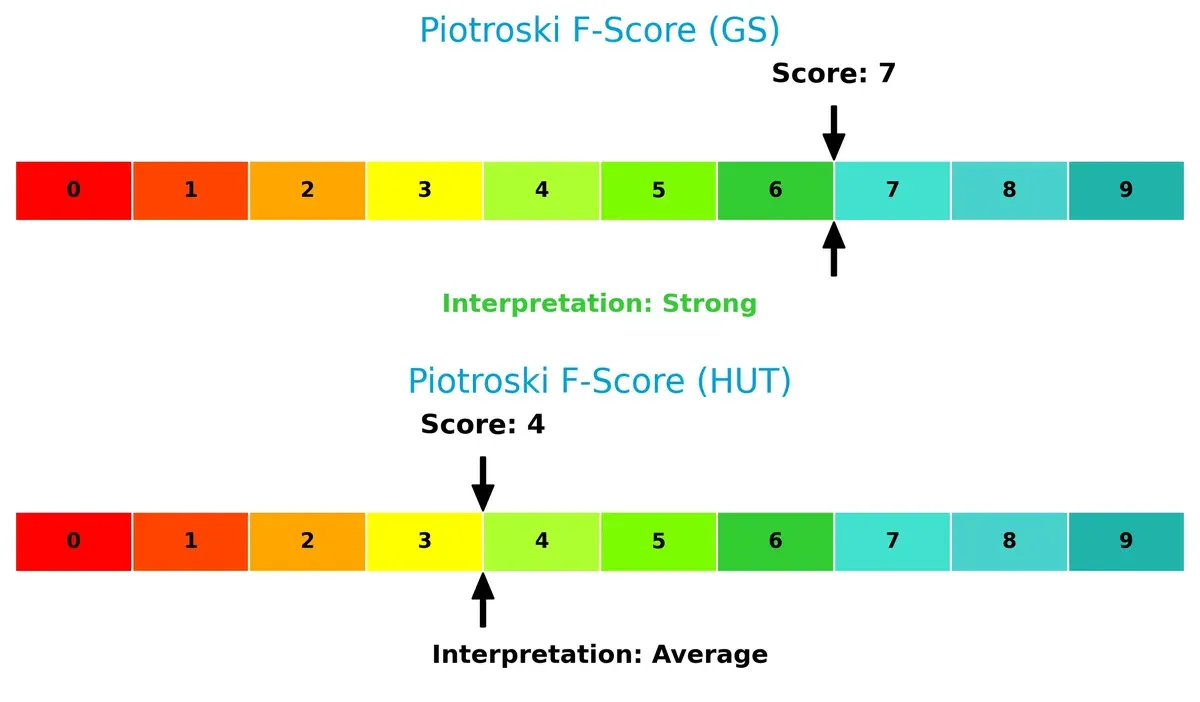
Goldman Sachs demonstrates superior operational quality and balance sheet strength, whereas Hut 8’s average score reveals cautionary signs in profitability or efficiency metrics. Investors should weigh these internal red flags carefully.
How are the two companies positioned?
This section dissects GS and HUT’s operational DNA by comparing revenue distribution and internal strengths and weaknesses. The goal is to confront their economic moats to reveal which model offers the most resilient, sustainable competitive advantage today.
Revenue Segmentation: The Strategic Mix
This comparison dissects how The Goldman Sachs Group, Inc. and Hut 8 Corp. diversify their income streams and where their primary sector bets lie:
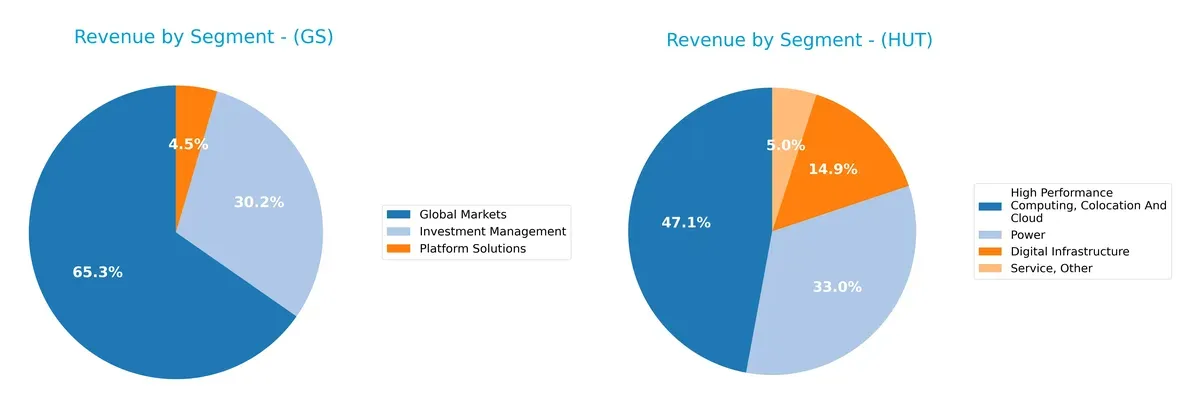
Goldman Sachs shows a balanced revenue mix, with Global Markets anchoring at $34.9B and Investment Management contributing $16.1B in 2024. Platform Solutions adds $2.4B, reflecting a diversified financial ecosystem. In contrast, Hut 8 leans heavily on High Performance Computing, Colocation And Cloud at $80.7M, supported by Digital Infrastructure at $25.5M and Power at $56.6M. Goldman Sachs’s diversification mitigates risk, while Hut 8’s concentration signals exposure to infrastructure and crypto mining cycles.
Strengths and Weaknesses Comparison
This table compares the Strengths and Weaknesses of GS and HUT:
GS Strengths
- Diversified revenue streams across Investment Management, Global Markets, and Platform Solutions
- Global presence with strong Americas, EMEA, and Asia markets
- Favorable net margin of 13.73%
- Neutral current and quick ratios indicating liquidity management
- Established market share in financial services
HUT Strengths
- Exceptional profitability with net margin over 200% and ROE near 34%
- Strong liquidity ratios and low debt-to-equity ratio
- Favorable interest coverage showcasing financial stability
- Attractive P/E ratio of 5.64 indicating value
- Focused revenue segments in digital infrastructure and computing
GS Weaknesses
- Unfavorable ROIC below WACC, signaling weak capital efficiency
- High debt-to-equity ratio near 5.0, increasing financial risk
- Low interest coverage ratio at 0.29, signaling vulnerability
- Unfavorable asset turnover, limiting operational efficiency
- Only 21% favorable ratios globally, indicating overall pressure
HUT Weaknesses
- Unfavorable high WACC at 31.84%, increasing cost of capital
- Unfavorable ROIC despite strong returns, suggesting inefficient capital use
- Lower asset turnover and fixed asset turnover ratios
- Zero dividend yield, reducing income appeal
- Limited geographic diversification focused on Canada and U.S.
Both companies exhibit clear strengths aligned with their industry focus. GS benefits from diversification and global scale but struggles with capital efficiency and leverage. HUT shows remarkable profitability and financial stability but faces challenges in capital costs and geographic reach. These contrasts highlight different strategic priorities and risk profiles in their operational models.
The Moat Duel: Analyzing Competitive Defensibility
A structural moat is the only true defense against long-term profit erosion from competition. Let’s dissect the competitive moats of Goldman Sachs and Hut 8:
The Goldman Sachs Group, Inc.: Intangible Assets & Scale Advantage
Goldman Sachs leverages deep client relationships and brand reputation as its moat. This manifests in stable margins and global presence. Yet, declining ROIC signals pressure on its capital efficiency in 2026.
Hut 8 Corp.: Cost Advantage & Operational Efficiency
Hut 8’s moat centers on low-cost Bitcoin mining operations and energy infrastructure control. Unlike Goldman Sachs, its ROIC is rising, reflecting improving profitability despite still shedding value overall.
Moat Battle: Intangible Assets vs. Cost Leadership
Goldman Sachs commands a wider economic moat through intangible assets, but deteriorating ROIC erodes this edge. Hut 8’s improving ROIC trend hints at a deepening moat, though still slightly unfavorable. Goldman Sachs remains better positioned to defend market share, but Hut 8’s operational gains merit close watch.
Which stock offers better returns?
Over the past 12 months, both stocks show strong upward momentum, with significant price appreciation and distinct trading volume dynamics reflecting investor sentiment.
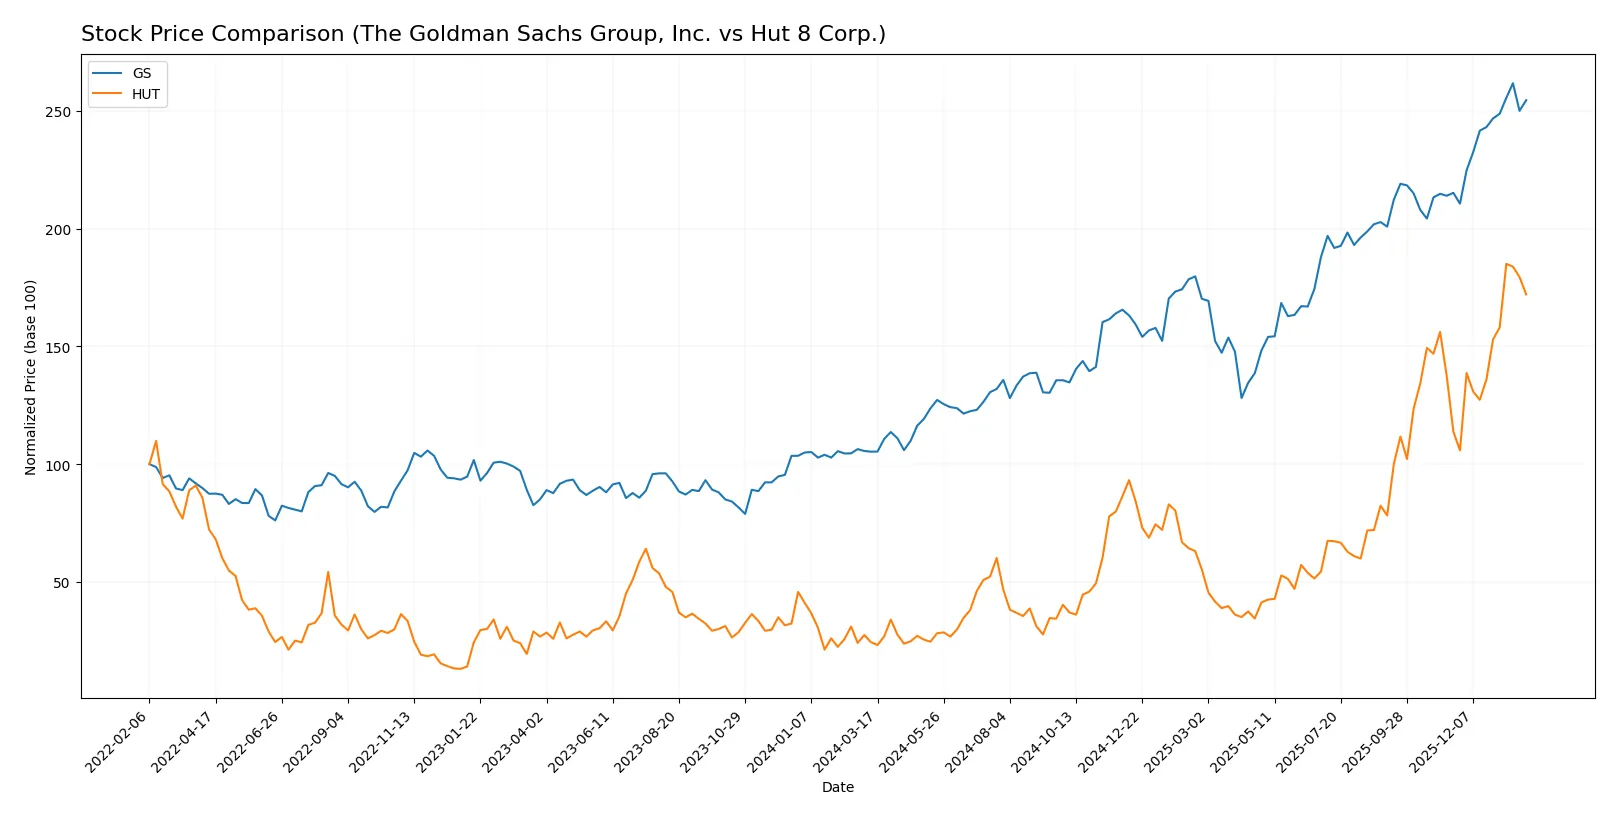
Trend Comparison
The Goldman Sachs Group, Inc. (GS) exhibits a bullish trend with a 142% price increase over the past year, showing acceleration and high volatility with a 149.43 standard deviation. Recent gains remain robust at 18%, supported by strong buyer dominance.
Hut 8 Corp. (HUT) also demonstrates a bullish trend, outperforming GS with a 604% price rise over 12 months. The trend accelerates steadily with lower volatility (13.66 std deviation). Recent growth is strong at 51%, despite slight seller dominance in volume.
Comparing both, Hut 8 Corp. delivers markedly higher market returns and sustained acceleration, whereas Goldman Sachs shows solid but more moderate growth and stronger buyer volume dominance.
Target Prices
Analysts present a broad but confident consensus on target prices for Goldman Sachs and Hut 8 Corp.
| Company | Target Low | Target High | Consensus |
|---|---|---|---|
| The Goldman Sachs Group, Inc. | 604 | 1100 | 903 |
| Hut 8 Corp. | 55 | 85 | 70 |
Goldman Sachs’s consensus target at 903 sits slightly below its current price of 935, indicating modest downside risk. Hut 8’s consensus target at 70 is well above its 56 price, suggesting potential upside.

Don’t Let Luck Decide Your Entry Point
Optimize your entry points with our advanced ProRealTime indicators. You’ll get efficient buy signals with precise price targets for maximum performance. Start outperforming now!
How do institutions grade them?
The institutional grades for The Goldman Sachs Group, Inc. and Hut 8 Corp. are as follows:
The Goldman Sachs Group, Inc. Grades
Below is a summary of recent grades assigned by major grading firms for Goldman Sachs:
| Grading Company | Action | New Grade | Date |
|---|---|---|---|
| RBC Capital | Maintain | Sector Perform | 2026-01-20 |
| Keefe, Bruyette & Woods | Maintain | Market Perform | 2026-01-16 |
| Wells Fargo | Maintain | Overweight | 2026-01-16 |
| JP Morgan | Maintain | Neutral | 2026-01-08 |
| Barclays | Maintain | Overweight | 2026-01-05 |
| Keefe, Bruyette & Woods | Maintain | Market Perform | 2025-12-17 |
| JP Morgan | Downgrade | Neutral | 2025-10-21 |
| Freedom Capital Markets | Upgrade | Hold | 2025-10-17 |
| Keefe, Bruyette & Woods | Maintain | Market Perform | 2025-10-17 |
| Citigroup | Maintain | Neutral | 2025-10-16 |
Hut 8 Corp. Grades
Here are the latest grades from reputable firms for Hut 8 Corp.:
| Grading Company | Action | New Grade | Date |
|---|---|---|---|
| Keefe, Bruyette & Woods | Maintain | Outperform | 2026-01-27 |
| Needham | Maintain | Buy | 2026-01-16 |
| B. Riley Securities | Maintain | Buy | 2026-01-09 |
| Keefe, Bruyette & Woods | Maintain | Outperform | 2025-12-19 |
| Rosenblatt | Maintain | Buy | 2025-12-18 |
| Canaccord Genuity | Maintain | Buy | 2025-12-18 |
| Needham | Maintain | Buy | 2025-12-18 |
| BTIG | Maintain | Buy | 2025-12-17 |
| BTIG | Maintain | Buy | 2025-11-06 |
| Rosenblatt | Maintain | Buy | 2025-11-05 |
Which company has the best grades?
Hut 8 Corp. consistently receives “Buy” and “Outperform” ratings from multiple firms. Goldman Sachs mostly holds “Neutral,” “Market Perform,” and “Overweight” ratings with fewer upgrades. This divergence suggests Hut 8’s grades reflect stronger near-term growth expectations, potentially influencing investor sentiment more positively.
Risks specific to each company
The following categories identify the critical pressure points and systemic threats facing both firms in the 2026 market environment:
1. Market & Competition
The Goldman Sachs Group, Inc.
- Faces intense competition in global financial services with pressure on margins and innovation.
Hut 8 Corp.
- Operates in a volatile cryptocurrency mining sector highly sensitive to Bitcoin price swings and tech advances.
2. Capital Structure & Debt
The Goldman Sachs Group, Inc.
- High debt-to-equity ratio (4.95) signals leverage risk; weak interest coverage (0.29) raises solvency concerns.
Hut 8 Corp.
- Maintains low debt-to-equity (0.35) and strong interest coverage (16.17), reflecting conservative leverage and financial stability.
3. Stock Volatility
The Goldman Sachs Group, Inc.
- Beta of 1.32 indicates moderate sensitivity to market swings typical of financial sector leaders.
Hut 8 Corp.
- Extremely high beta (6.19) exposes stock to severe price fluctuations and investor risk.
4. Regulatory & Legal
The Goldman Sachs Group, Inc.
- Subject to rigorous financial regulations and compliance costs globally, impacting operational flexibility.
Hut 8 Corp.
- Faces evolving crypto regulations and energy use scrutiny, which could disrupt operations or increase costs.
5. Supply Chain & Operations
The Goldman Sachs Group, Inc.
- Relies on global financial infrastructure and technology platforms, vulnerable to cyber risks and systemic shocks.
Hut 8 Corp.
- Depends on energy infrastructure and hardware supply chains; risks include energy price volatility and equipment shortages.
6. ESG & Climate Transition
The Goldman Sachs Group, Inc.
- Increasing pressure to enhance sustainable finance offerings and reduce carbon footprint across operations.
Hut 8 Corp.
- Energy-intensive Bitcoin mining faces significant ESG challenges and regulatory pressures to decarbonize.
7. Geopolitical Exposure
The Goldman Sachs Group, Inc.
- Global operations expose it to geopolitical tensions, trade conflicts, and sanctions risks.
Hut 8 Corp.
- US-based but exposed to global crypto market dynamics and potential cross-border regulatory actions.
Which company shows a better risk-adjusted profile?
The Goldman Sachs Group faces significant leverage and regulatory risks that weigh on its financial resilience. Hut 8 shows superior balance sheet strength and liquidity but endures extreme stock volatility and ESG challenges. Hut 8’s safer capital structure and Altman Z-Score in the safe zone underscore a stronger risk-adjusted profile despite operational uncertainties. Notably, Goldman Sachs’ distress-level Altman Z-Score signals acute financial fragility, demanding caution.
Final Verdict: Which stock to choose?
The Goldman Sachs Group, Inc. (GS) wields unmatched operational efficiency and a strong brand legacy, making it a cash machine in financial services. However, its declining ROIC signals value erosion, a point of vigilance for investors. GS fits portfolios targeting stable, large-cap financial exposure with moderate growth expectations.
Hut 8 Corp. (HUT) showcases a strategic moat in blockchain mining with rapid revenue and earnings growth. Its superior liquidity and low leverage offer better financial safety compared to GS. HUT suits aggressive growth portfolios seeking high volatility and significant upside potential in emerging tech sectors.
If you prioritize consistent cash generation and established market presence, GS is the compelling choice due to its operational resilience. However, if you seek high-growth exposure with improving profitability and lower leverage, HUT offers better stability and upside despite industry risks. Both stocks require careful risk management given their contrasting financial profiles.
Disclaimer: Investment carries a risk of loss of initial capital. The past performance is not a reliable indicator of future results. Be sure to understand risks before making an investment decision.
Go Further
I encourage you to read the complete analyses of The Goldman Sachs Group, Inc. and Hut 8 Corp. to enhance your investment decisions: